HAL Id: hal-00318139
https://hal.archives-ouvertes.fr/hal-00318139
Submitted on 9 Aug 2006
HAL is a multi-disciplinary open access
archive for the deposit and dissemination of
sci-entific research documents, whether they are
pub-lished or not. The documents may come from
teaching and research institutions in France or
abroad, or from public or private research centers.
L’archive ouverte pluridisciplinaire HAL, est
destinée au dépôt et à la diffusion de documents
scientifiques de niveau recherche, publiés ou non,
émanant des établissements d’enseignement et de
recherche français ou étrangers, des laboratoires
publics ou privés.
Limits on the core temperature anisotropy of solar wind
protons
E. Marsch, L. Zhao, C.-Y. Tu
To cite this version:
E. Marsch, L. Zhao, C.-Y. Tu. Limits on the core temperature anisotropy of solar wind protons.
Annales Geophysicae, European Geosciences Union, 2006, 24 (7), pp.2057-2063. �hal-00318139�
www.ann-geophys.net/24/2057/2006/ © European Geosciences Union 2006
Annales
Geophysicae
Limits on the core temperature anisotropy of solar wind protons
E. Marsch1, L. Zhao2, and C.-Y. Tu3
1Max-Planck-Institut f¨ur Sonnensystemforschung, 37191 Katlenburg-Lindau, Germany
2Department of Atmospheric, Oceanic, and Space Sciences, University of Michigan, Ann Arbor, Michigan, USA
3Department of Geophysics, Peking University, Beijing, China
Received: 10 May 2005 – Revised: 19 June 2006 – Accepted: 23 June 2006 – Published: 9 August 2006
Abstract. We analyse the temperature anisotropy of the
pro-tons in the solar wind and thereby concentrate on plasma data obtained in the year 1976 of the Helios 1 and Helios 2 mis-sions. We derive the core proton temperatures T⊥ and Tk, in the directions perpendicular and parallel to the magnetic field, as well as the core parallel plasma beta, βk. The data are separately analysed for two distance ranges, R≤0.4 AU and R>0.4 AU, and divided into 24 bins for the plasma beta, in the range from βk=0.1 to βk=10, and into 72 bins for the total temperature anisotropy, A=1−T⊥/Tk, which is here considered in the range from −0.9 to 0.9. The number of spectra in each bin is determined to obtain distributions. The statistical results are presented in two-dimensional his-tograms. For each column we define a critical upper and lower limit of the anisotropy. The resulting empirical points are compared with the known theoretical instability thresh-olds. The protons are found to come with increasing radial distance closer to the fire-hose instability threshold.
Keywords. Interplanetary physics (Solar wind plasma) –
Space plasma physics (Wave-particle interactions; Waves and instabilities)
1 Introduction
1.1 Nonthermal proton velocity distributions
Velocity distribution functions (VDFs) of the protons in the solar wind usually show distinct thermal anisotropies, per-pendicular to the magnetic field in the core of the VDFs as well as parallel, often in association with proton beams (Feldman et al., 1973). These nonthermal features were dis-covered in the early days of in-situ observations made near 1 AU (Goodrich and Lazarus, 1976). Some years later,
He-Correspondence to: E. Marsch
lios also found that between 0.3 AU and 1 AU the proton tem-perature ratio, T⊥/Tk, was unequal unity and highly vari-able, ranging between about 0.3 and 3 (Marsch et al., 1982), with systematic radial trends that were reviewed by Marsch (1991).
Similar anisotropies were found in the solar wind proton data obtained out of the ecliptic plane by Ulysses (Gary et al., 2002), and recently again near 1 AU from the Advanced Composition Explorer (ACE) mission (Gary et al., 2001) and the Wind spacecraft by Kasper et al. (2003), who carried out a large statistical study. There are good reasons to believe that the anisotropies are indicative of wave-particle interac-tions and the physical mechanisms by which the ions in the solar corona and solar wind are heated (for a recent review of cyclotron resonant interactions see Hollweg and Isenberg (2002). However, the origin of the proton beam, the cause for strong parallel and perpendicular proton heating, and the regulation of the temperature anisotropy are still not fully un-derstood.
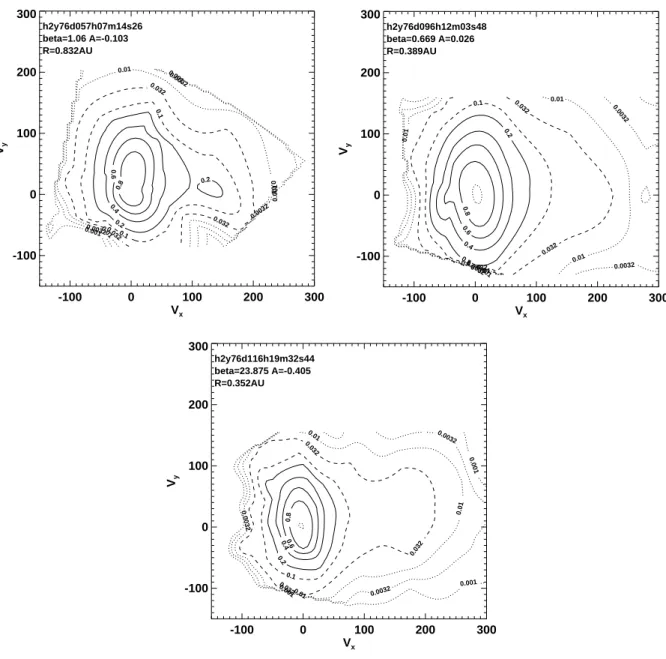
In Fig. 1 three typical examples of measured proton VDFs are shown. Note the distinct core temperature anisotropy and the extended tail along the magnetic field, often appearing as a resolved secondary proton beam component. This tail can give rise to a comparatively large total parallel plasma beta, βk=2(vk/VA)2, where vk,⊥=pkBTk,⊥/mpis the ther-mal speed based on the temperature derived from the full moment of the VDF, VAis the Alfv´en speed, mpthe proton mass, and kBBoltzmann’s constant.
Inspection of the middle VDF in Fig. 1 shows that de-spite the large core anisotropy the parallel is still larger than the perpendicular temperature, which is due to the small proton beam, travelling at more than 200 km/s speed along the local magnetic field direction. Proton beams are a well known persistent feature in the solar wind, particularly in the fast streams. However, the overall temperature anisotropy,
A=1−T⊥/Tk, is often negative, because of the bi-shell, egg-shaped core part of the VDF, a feature which was interpreted
2058 E. Marsch et al.: Proton temperature anisotropy -100 0 100 200 300 Vx -100 0 100 200 300 Vy h2y76d057h07m14s26 0.001 0.001 0.001 0.0032 0.0032 0.0032 0.01 0.01 0.01 0.032 0.032 0.032 0.1 0.1 0.2 0.2 0.4 0.6 0.8 h2y76d057h07m14s26 beta=1.06 A=-0.103 R=0.832AU -100 0 100 200 300 Vx -100 0 100 200 300 Vy 0.001 0.0032 0.0032 0.0032 0.01 0.01 0.01 0.01 0.032 0.032 0.032 0.1 0.1 0.2 0.2 0.4 0.6 0.8 h2y76d096h12m03s48 beta=0.669 A=0.026 R=0.389AU -100 0 100 200 300 Vx -100 0 100 200 300 Vy h2y76d116h19m32s44 0.001 0.001 0.001 0.0032 0.0032 0.0032 0.01 0.01 0.01 0.032 0.032 0.032 0.1 0.2 0.4 0.6 0.8 h2y76d116h19m32s44 beta=23.875 A=-0.405 R=0.352AU
Fig. 1. Contours in velocity space of typical anisotropic proton velocity distribution functions. The contours correspond to 0.0032, 0.01 (outer dotted lines), 0.032, 0.1 (dashed), 0.2, 0.4, 0.6, 0.8 (continuous), and 0.9 (innermost dotted line) of the maximum. The vx-axis points
in the magnetic field direction. The most prominent nonthermal features are the core temperature anisotropy, with T⊥c>Tkc, and the proton
beam travelling along the local magnetic field direction at speeds larger than the Alfv´en speed. Note that the artificially sharp edges in some contours correspond to the boundaries of the velocity array of the plasma instrument. From left to right, the parameter values are: plasma
beta, βk=1.06, 0.67, 23.9, anisotropy, A=−0.1, 0.03, −0.41, and heliocentric radial distance, R=0.83, 0.39, 0.35 AU.
by Marsch and Tu (2001) and Tu and Marsch (2002) as be-ing indicative of resonant pitch-angle diffusion of protons in a cyclotron-wave field.
For the VDFs in Fig. 1 from left to right, the solar wind speed is, V =591, 599, and 439 km/s, the thermal speeds are,
vk=60, 64, and 64 km/s and v⊥=50, 65, and 50 km/s, and the Alfv´en speed is VA=82, 111, and 90 km/s, respectively. A comprehensive review of the proton VDFs in the solar wind and of the related microphysics was given by Marsch (1991).
1.2 Temperature anisotropy driven instabilities
Concerning the stability of such anisotropic VDFs, Mont-gomery et al. (1976) did some early work on beam or temperature-anisotropy driven plasma instabilities. A gen-eral account of space-plasma microinstabilities was given in the book by Gary (1993). Furthermore, Daughton and Gary (1998) and Daughton et al. (1999) provided arguments from analytic instability calculations and from direct numerical
simulations, which indicated that the beam velocity is reg-ulated by electromagnetic instabilities driven by the beam kinetic energy, a process in which the core βk is a key pa-rameter. Dum et al. (1980) found evidence for wave growth from the detailed measured VDFs, and so did Leubner and
Vi˜nas (1986) for double-peaked proton VDFs. More
re-cently, Araneda et al. (2002) analysed the effects of the pro-ton core temperature on the relative drift and anisotropy evo-lution of the ion beam instability in the fast solar wind.
The intention of this paper is to complement these stud-ies, and to analyse in particular whether the measured VDFs are prone to the firehose fluid instability and its kinetic rela-tives, or to the mirror fluid instability. A statistical analysis is carried out, based on a large data set obtained during the Helios primary mission phases in 1976, including the first perihelion passages and covering a distance range between 1 AU and 0.3 AU. The main goal is to provide evidence for empirical relations between the core temperature anisotropy and the parallel core plasma beta, a parameter which is also found to play a key role in the wave regulation of the shape of the VDFs and drift speeds of the beams in fast wind (Tu et al., 2004).
Before we give the detailed results from our data analysis, we would like to discuss an important issue. In the cited pre-vious studies the total distribution function including the pro-ton beams was mostly studied. However, the entire distribu-tion cannot be described by a single bi-Maxwellian. There-fore, we use in what follows the parameters Tkand T⊥being only based on the partial velocity moments of the core (de-fined as being above the 20% level of the maximum) tion. Certainly, as Fig. 1 shows, the overall velocity distribu-tion is not a bi-Maxwellian, and we need (and in fact used in other studies) more parameters to describe it adequately, and in particular the instability associated with a proton beam. But this has little effects on the instability related with the temperature anisotropy of the core. Hence the core distri-bution, while being regulated by the fluid or kinetic firehose instability, can essentially be described by two parameters,
Tkand T⊥of the core, see again Fig. 1.
Kasper et al. (2002) evaluated from WIND data the pro-ton anisotropy and investigated the firehose instability, which may arise in the solar wind. They demonstrated, with a large data set of more than seven years, that the observed limit to the temperature anisotropy for Tk/T⊥>0 was in agreement with constraints posed by theory and simulations on the fire-hose instability according to (Gary et al., 1998; Gary et al. , 2000). This constraint is analogous to the anisotropy limit obtained by theoretical and computational methods for the electromagnetic cyclotron instability driven by T⊥/Tk>1; see, e.g. Gary et al. (2001) and references therein.
Pronounced proton core temperature anisotropies were usually found in connection with ion differential streaming and simultaneous Alfv´en wave activity in the solar wind Marsch et al. (1982). But only recently have Marsch and Tu (2001) found observational evidence in the Helios data
for the regulation of the anisotropy through diffusion-related plateaus, which seem to form in the VDFs of the protons in resonance with cyclotron waves. Cyclotron-resonant diffu-sion is an important process in shaping the proton anisotropy, as was recently also shown by Marsch et al. (2004).
The linear theory and 1-D simulations (Gary et al., 1998) predict that enhanced electromagnetic field fluctuations arise from the proton-resonant firehose instability, which imposes on the proton temperature anisotropy a constraint attaining the simple form,
A =1 − T⊥/Tk=S βk−α, βk=8π nkBTk/B2, (1) where n the proton density, and B the magnetic field strength. The theoretical parameters are S=2 and α=1 for the non-resonant firehose fluid instability, and S=1.5 and α=0.74 for the resonant temperature-anisotropy-driven kinetic instabil-ity, according to the work of Gary et al. (1998).
The unique proton in-situ measurements made on the He-lios spacecraft will be used here to determine the fitting parameters S and α empirically, and to carry out statisti-cal analyses in the form of histograms for A and βk. We will also test the relevance of the two simple threshold re-lations of the fire-hose and mirror fluid instabilities, which are determined by the inequalities βk>2+β⊥, respectively,
β⊥2/βk>1+β⊥. These can be cast into threshold relations that give the anisotropy in dependence on the parallel plasma beta, for the firehose instability,
A ≥ 2 βk
, (2)
and for the mirror instability,
A ≤ 1 2 1 − s 1 + 4 βk ! . (3)
The relations (2) and (3) are plotted in both subsequent fig-ures as yellow reference lines for comparison with the mea-sured data.
2 Helios observations and data analysis
2.1 General remarks
For the present analysis, we used the Helios proton data ob-tained by the plasma analyser (Rosenbauer et al., 1977). We employed the standard Helios data analysis methods, as de-scribed originally by Marsch et al. (1982) and recently by Marsch et al. (2004), in order to separate the ion count rates and to remove those counts from the proton spectra which are apparently contributed by alpha particles. For the reliable VDFs we calculated the proton number density, n, and the parallel and perpendicular temperature based on the full mo-ment integration of the measured distribution function. Note that, unlike in the analysis by Kasper et al. (2002, 2003), no
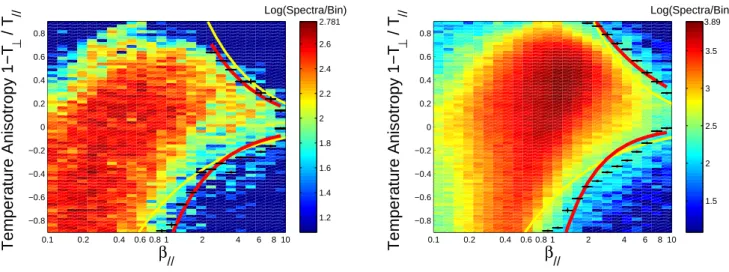
2060 E. Marsch et al.: Proton temperature anisotropy 0.1 0.2 0.4 0.6 0.8 1 2 4 6 8 10 −0.8 −0.6 −0.4 −0.2 0 0.2 0.4 0.6 0.8
β
//Temperature Anisotropy 1−T
⊥/ T
// Log(Spectra/Bin) 1.2 1.4 1.6 1.8 2 2.2 2.4 2.6 2.781 0.1 0.2 0.4 0.6 0.8 1 2 4 6 8 10 −0.8 −0.6 −0.4 −0.2 0 0.2 0.4 0.6 0.8β
//Temperature Anisotropy 1−T
⊥/ T
// Log(Spectra/Bin) 1.5 2 2.5 3 3.5 3.89Fig. 2. Two-dimensional histogram of the solar wind proton anisotropy as measured within two radial distance ranges, R≤0.4 AU (left
frame) and R>0.4 AU (right frame). The core temperature anisotropy, A=1−T⊥/Tk, is shown as a function of the parallel plasma βkof the
core protons. The colour coding logarithmically indicates the number of spectra per bin. The color scale itself is linear. Black horizontal bars in each βk-column indicate where the logarithm of the number of spectra equals 1.6 (2.2 in the right frame), which is used as a limiting value. The red lines are theoretical fits to these data points. The total number of proton spectra is 24 856 (left), respectively, 193 902 (right).
assumption (such as the VDF being a bi-Maxwellian) about the shape of the VDF was made here. For typical examples of proton velocity distributions with different anisotropies see again Marsch (1991).
2.2 Data analysis procedure
We calculated the proton core temperatures T⊥and Tkin the directions parallel and perpendicular to the magnetic field, as well as the parallel core plasma beta, βk. To ease the nota-tion we will use these symbols without an index for core in the remainder of this paper. The core is defined as the inner-most part of the VDF and given by the continuous contours in Fig. 1 that are above the 20% level of the maximum. Con-tributions of a possible proton beam component were thus excluded from the calculation of βk.
Observationally, a large total parallel beta is mainly due to the proton beam and its differential kinetic energy, which contributes to the total parallel kinetic “temperature”, which is to say the random energy of the protons in their common center-of-mass frame. Examples of unambiguous, double or multiple, proton beams were presented and discussed by Rosenbauer et al. (1977) and Feldman and Marsch (1997). Figure 1 gives typical examples of pronounced proton tails and secondary resolved components. To eliminate the beam influence on our analysis we just used the beta of the core here. This restriction is also suggested by the theoretical sta-bility analyses (Daughton and Gary, 1998; Daughton et al., 1999).
We analysed our data separately for two distance ranges,
R≤0.4 AU and R>0.4 AU, and divided the data in 24 bins,
in the range from βk=0.1 to βk=10, and in 72 bins for 1−T⊥/Tk, ranging from −0.9 to 0.9. We then counted the number of spectra in each bin to obtain frequency distribu-tions. The total number of data points (i.e., proton VDFs) is 193 902 for the interval with 0.4<R≤1 AU, and 24 856 for the perihelion regime with R≤0.4 AU. The statistical results from these measurements are presented in Fig. 2. In the de-sign of these plots, we followed Kasper et al. (2002, 2003) to facilitate a comparison with their results obtained at 1 AU.
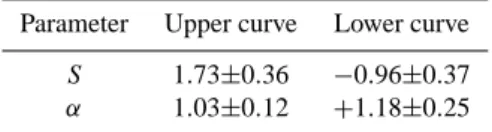
The two subsequent figures are 2-D histograms of the number of proton spectra as a function of A and βk. They demonstrate that the temperature anisotropy is constrained by βk, and most strongly so if it is larger than unity, indi-cating that the constraint may be due to the fluid or kinetic firehose instability. For negative A, which we also discuss here, there are theoretical constraints depending on βk, in particular for the core proton temperature anisotropy, which was extensively discussed by Marsch et al. (2004). To quan-tify the observational limits for comparison with theoretical predictions, an upper or lower limit of the anisotropy was calculated. It can be obtained by fitting to the edges of the data distributions the same function (1) that was used above to represent the theoretical thresholds.
For our data we used the following method: For each
βk-bin, an upper (or lower) limit for positive (or negative)
Amay be defined by that value at which the normalized (to a maximum of unity) frequency distribution in any given bin falls, at its steep slope towards larger positive (negative) val-ues, below a certain threshold level. Instead of using like Kasper et al. (2002, 2003) a normalized ratio of 0.1 to define the boundary points, we used the following procedure: We
selected those points where the logarithm of the frequency distribution for R≤0.4 AU had the fixed value of 0.6 of the maximum value of 2.7, which was 1.6. The corresponding value for the distribution for R>0.4 AU was 2.2, which is 0.6 of its maximum value of 3.7. We thus picked up every point where the logarithm reaches 1.6 (see the colour bars with spectra/bin in the subsequent figures), respectively, 2.2 for the other distance interval, and then used all these points to determine a fit like in Eq. (1) to represent the requested border line. The reason why we chose 1.6 (or 2.2) to find the boundary is that using this number of 60% of the maxi-mum gave a boundary (red) line that was best adjusted to the curvature of the point clouds.
Note the following technical aspects. Since the number of our data points is limited, it is possible that in some βk-bins there are no data points exactly at 1.6 (or 2.2). Then we used the idea of adding dummy points, which was suggested by Kasper et al. (2002) in their paper (see their Fig. 3). For ev-ery fixed beta bin, we applied a linear fit in A to find the dummy point where the logarithm of the number of spec-tra was exactly 1.6 (or 2.2). We then made use of all these dummy points to get a smoothly interpolated boundary line. We also defined a kind of an error bar for each dummy point. This error bar corresponds to the distance between a dummy point and its nearest real data point.
2.3 Observational results
The temperature anisotropy, A, is plotted as a scatter
dia-gram versus βk of the proton core for the distance range
R≤0.4 AU, including the Helios perihelion passage, in the left frame of Fig. 2. In the same presentation, we show the results for R>0.4 AU, including the aphelion passage, in the right frame of Fig. 2. On the left side, the majority of the data points cluster along a ridge reaching about from βk≈0.6
and A≈0.2 to βk≈0.3 and A≈−0.2 , which correspond to
Tk≈1.2 T⊥, respectively T⊥≈1.2 Tk. In contrast on the right side, the majority of the data points cluster around βk≈1 and
A≈0.4, which means that on average Tk≈1.4 T⊥, These re-sults are consistent with an earlier analysis by Marsch et al. (1982), see again their Fig. 15, which directly shows that the ratio Tk/T⊥radially increases.
The black little bars (crosses) in both frames of Fig. 2 indi-cate the upper, respectively lower, empirical limiting values of A, and the red lines respectively give the corresponding least-squares fit, as based on the theoretical function given in Eq. (1). The black error bar parallel to the x-axis is given by the width of the bin. The error bar along the y-axis is small, often too small to be seen. It is mainly given by the distance between the dummy point (indicated in red) and its nearest real point. Note that in Fig. 2 the statistics are generally get-ting poorer for βk>3, and the resulting points there are less reliable than the ones in the range 0.1≤βk≤3.
The fitted red curves indicate that the boundaries of the spectra distributions mostly stay, for βk>3, close to the
yel-low curves, which correspond to the two main non-resonant fluid instabilities, namely the fire-hose stability threshold given by the upper yellow line after Eq. (2), respectively the mirror stability threshold given by the lower yellow line after Eq. (3). The relative positions of the red and yellow lines dis-criminate the domains of stability, respectively instability, of the corresponding proton VDFs, and indicate which regions of the A–βk-plane these domains cover. In the left frame, the fitted top red curve stays well below the top yellow curve, corresponding to the non-resonant fluid fire-hose instability. Therefore, despite their distinct nonthermal features the pro-ton VDFs are not prone to this instability at distances smaller 0.4 AU. For distances larger than 0.4 AU (right frame), the top red curve stays well above the top yellow curve. So the thermal anisotropy of the proton core VDF is limited, and appears to be influenced by the fire-hose instability.
In the right frame of Fig. 2, the data points (with large vari-ances, though) lie for βk>2 on average beyond the theoret-ical yellow threshold line, a result which indicates a strong tendency towards instability for the higher plasma beta en-countered at larger heliocentric distances. However, the low relative occurrence rate of these data point does not allow a firm conclusion. Qualitatively speaking, this trend is to be expected, since fully scatter-free protons, while conserv-ing their magnetic moment, would tend to develop an ever larger A, since only T⊥will decline whereas Tkalmost stay constant. This trend was empirically established before and already illustrated in the cited Fig. 15 of Marsch et al. (1982). A comparison of the left with the right panel of Fig. 2
reveals the following radial trends. The center of the
point cloud is slightly shifted from βk≈0.6 and A≈0.2 for
R≤0.4 AU to the values βk≈1.0 and A≈0.4 for R>0.4 AU. This also means that β radially increases in the solar wind, a result which was obtained before by Marsch and Richter (1984) (see their Fig. 5), when analysing the total beta as obtained by summing up the pressure contributions of elec-trons and ions. This result indicates that T⊥ generally de-clines more strongly with distance than Tk, consistent with the radial gradients presented by Marsch et al. (1982) in their Figs. 18 and 19. As Fig. 1 shows, the core protons cool off perpendicular to the magnetic field more strongly than paral-lel. But they still remain strongly anisotropic out to 1 AU and beyond even out to the Mars orbit (Astudillo et al., 1996).
2.4 Comparison of observations with theories
Concerning the parameters of the empirical fit using Eq. (1), we obtained different parameter values for the two distance ranges, R≤0.4 AU and R>0.4 AU. The resulting values are listed in Table 1, respectively, Table 2. These observational values are to be compared with known theoretical thresh-olds. For the fire-hose instability the parameters are S=2 and α=1 for the non-resonant fluid instability, and S=1.5 and α=0.74 for the resonant temperature-anisotropy-driven kinetic instability. Since both thresholds quantitatively do
2062 E. Marsch et al.: Proton temperature anisotropy
Table 1. Fit parameters of the limiting anisotropy for R≤0.4 AU.
Parameter Upper curve Lower curve
S 1.73±0.36 −0.96±0.37
α 1.03±0.12 +1.18±0.25
not differ much, we just refer to and discuss the nonresonant firehose threshold in this paper.
These stability thresholds were also considered in the cor-responding data plots of Kasper et al. (2002), who showed proton measurements from WIND at 1 AU, which can be di-rectly compared with our results due to the same data formats used. For their data set they obtained the best fit parameters:
S=1.21 and α=0.76, with about 20 % uncertainty. These
values were found to be in good agreement with the results by Gary et al. (1998) from linear stability analysis and numerical simulation of the resonant firehose instability. For the non-resonant case Gary et al. (1998) found α=1.0 for 2≤βk≤10, and thus the agreement was worse. Our above values indicate that the protons in the solar wind at distances below 0.4 AU are generally not prone to the firehose instability, neither of resonant kinetic nor nonresonant fluid type. In a simulation study of the expanding solar wind, Matteini et al. (2005) found α=0.8 and S=0.93 for the protons. However, be-yond 0.4 AU the proton VDF may become increasingly more prone to the firehose instability, which yet is known to have a comparatively small growth rate.
It seems more likely that the proton-proton beam instabil-ity plays a major role in limiting and regulating the proton total temperature anisotropy in the solar wind. This was al-ready suggested in the early analysis of Montgomery et al. (1976). The beam instability was recently scrutinized in a statistical study by Tu et al. (2004). They established an em-pirical relationship between the normalized beam drift speed,
Vd/VA and the core plasma beta, βk. By analysing individ-ual proton VDFs, they found that also most of the beam dis-tributions are rather stable. In contrast, the core tempera-ture anisotropy, appears to be close to a cyclotron-resonant instability threshold. The proton-proton instabilities have also been experimentally studied by Goldstein et al. (2000). In their Vlasov analysis and hybrid numerical simulations, Araneda et al. (2002) came to the conclusion that it is the core protons, with T⊥/Tk>1, which essentially control the anisotropic heating and drift energy of the beam protons.
3 Conclusions
The Helios proton data were analysed with respect to possi-ble constraints on the core temperature anisotropy, A, in the solar wind between 0.3 and 1.0 AU. Empirical limits for A were determined as a function of the parallel plasma beta, βk,
Table 2. Fit parameters of the limiting anisotropy for R>0.4 AU.
Parameter Upper curve Lower curve
S 1.64±0.18 −1.33±0.46
α 0.71±0.07 +1.50±0.23
of the proton core and compared with the theoretical thresh-olds for the mirror and firehose instability, as obtained from linear stability analysis and numerical simulation. Nearer to the Sun the solar wind core protons were found to be largely stable against growth of the firehose mode. But they stay close to the fluid nonresonant as well as the kinetic resonant instability thresholds at larger solar distances.
Acknowledgements. The National Natural Science Foundation of
China supported C.-Y. Tu and L. Zhao under projects with the con-tract numbers 40336053, 40436015, and 40574078, and Beijing Ed-ucation Project XK100010404.
Topical Editor B. Forsyth thanks P. Gary for his help in evaluat-ing this paper.
References
Araneda, J. A., Vi˜nas, A. F., and Astudillo, H. F.: Proton core tem-perature effects on the relative drift and anisotropy evolution of the ion beam instability in the fast solar wind, J. Geophys. Res., 107, A12, 1453, doi:10.1029/2002JA009337, 2002.
Astudillo, H. F., Livi, S., Marsch, E., and Rosenbauer, H.: Evi-dence for nongyrotropic alpha particle and proton distribution functions: TAUS solar wind measurements, J. Geophys. Res., 101, 24 423–24 432, 1996.
Daughton, W. and Gary, S. P.: Electromagnetic proton/proton insta-bilities in the solar wind, J. Geophys. Res., 103, 20 613–20 620, 1998.
Daughton, W., Gary, S. P., and Winske, D.: Electromagnetic pro-ton/proton instabilities in the solar wind: Simulations, J. Geo-phys. Res., 103, 4657–4667, 1999.
Dum, C. T., Marsch, E., and Pilipp, W.: Determination of wave growth from measured distribution functions and transport the-ory, J. Plasma Phys., 23, 91–113, 1980.
Feldman, W. C., Asbridge, J. R., Bame, S. J., and Montgomery, M. D.: Double ion streams in the solar wind, J. Geophys. Res., 78, 2017–2027, 1973.
Feldman, W. C. and Marsch, E.: Kinetic phenomena in the solar wind, in Cosmic Winds and the Heliosphere, edited by: Jokipii, J. R., Sonett, C. P., and Giampapa, M. S., The University of Tuc-son Press, TucTuc-son, USA, 617–676, 1997.
Gary, S. P.: Theory of Space Plasma Microinstabilities, Cambridge University Press, Cambridge, U.K., 1993.
Gary, S. P., Li, H., Rourke, S. O., and Winske, D.: Proton resonant firehose instability: Temperature anisotropy and fluctuating field constraints, J. Geophys. Res., 103, 14 567–14 575, 1998. Gary, S. P., Yin, L., and Winske, D.: Electromagnetic proton
cy-clotron anisotropy instability: Wave-particle scattering rate, Geo-phys. Res. Lett., 27, 2457–2459, 2000.
Gary, S. P., Skoug, R. M., Steinberg, J. T., and Smith, C. W.: Proton temperature anisotropy constraint in the solar wind: ACE obser-vations, Geophys. Res. Lett., 28, 2759–2762, 2001.
Gary, S. P., Goldstein, B. E., and Neugebauer, M.: Signatures of wave-ion interactions in the solar wind, J. Geophys. Res., 107, doi:10.1029/2001JA000269, 2002.
Goldstein, B. E., Neugebauer, M., Zhang, L. D., and Gary, S. P.: Observed constraint on proton-proton relative velocities in the solar wind, J. Geophys. Res. Lett., 27, 53–56, 2000.
Goodrich, C. C. and Lazarus, A. J.: Suprathermal protons in the in-terplanetary solar wind, J. Geophys. Res., 81, 2750–2754, 1976. Hollweg, J. V. and Isenberg, P. A.: Generation of the fast solar wind: A review with emphasis on the resonant cyclotron interaction, J. Geophys. Res., 107, NO. A7, doi:10.1029/2001JA000270, 2002. Kasper, J. C., Lazarus, A. J., Gary, S. P., and Szabo, A.: Solar wind temperature anisotropies, in: Solar Wind 10, edited by: Velli, M., Bruno, R., and Malara, F., AIP Conference Proceedings Volume 679, 538–541, 2003.
Kasper, J. C., Lazarus, A. J., and Gary, S. P.: Wind/SWE ob-servations of firehose constraint on solar wind proton tem-perature anisotropy, Geophys. Res. Lett., 29, (17), 1839, doi:10.1029/2002GL015128, 2002.
Leubner, M. P. and Vi˜nas, A. F.: Stability analysis of double-peaked proton distribution functions in the solar wind, J. Geophys. Res., 91, 13 366–13 372, 1986.
Marsch, E., M¨uhlhauser, K.-H., Schwenn, R., Rosenbauer, H., Pilipp, W., and Neubauer, F.: Solar wind protons: Three-dimensional velocity distributions and derived plasma parame-ters measured between 0.3 and 1 AU, J. Geophys Res., 87, 52– 72, 1982.
Marsch, E. and Richter, A. K.: Helios Observational Constraints on Solar Wind Expansion, J. Geophys. Res., 89, 6599–6612, 1984. Marsch, E.: Kinetic Physics of the Solar Wind Plasma, in: Physics
of the Inner Heliosphere, edited by: Schwenn, R. and Marsch, E., Springer-Verlag, Heidelberg, Germany, 45–133, 1991. Marsch, E. and Tu, C.-Y.: Evidence for pitch-angle diffusion of
so-lar wind protons in resonance with cyclotron waves, J. Geophys. Res., 106, 8359–8361, 2001.
Marsch, E., Ao, X.-Z., and Tu, C.-Y.: On the temperature
anisotropy of the core part of the proton velocity distribution function in the solar wind, J. Geophys. Res., 109, A04102, doi:10.1029/2003JA010330, 2004.
Matteini, L., Landi, S., Hellinger, P., and Velli, M.: Proton fire hose instability in the expanding solar wind, Proc. Solar Wind 11 – SOHO 16 “Connecting Sun and Heliosphere”, Whistler, Canada, 12–17 June, ESA SP-592, 503–506, 2005.
Montgomery, M. D., Gary, S. P., Feldman, W. C., and Forslund, D. W.: Electromagnetic instabilities driven by unequal proton beams in the solar wind, J. Geophys. Res., 81, 2743–2749, 1976. Rosenbauer, H., Schwenn, R., Marsch, E., Meyer, B., Miggenrieder, H., Montgomery, M. D., M¨uhlhauser, K.-H., Pillip, W., Voges, W., and Zink, S. M.: A survey of initial results of the Helios plasma experiment, J. Geophys., 42, 561–580, 1977.
Tu, C.-Y. and Marsch, E.: Anisotropy regulation and plateau for-mation through pitch angle diffusion of solar wind protons in resonance with cyclotron waves, J. Geophys. Res., 107, 1249, doi:10.1029/2001JA000150, 2002.
Tu, C.-Y., Marsch, E., and Qin, Z.-R.: Dependence of
the proton beam drift velocity on the proton core plasma beta in the solar wind, J. Geophys. Res., 109, A05101, doi:10.1029/2004JA010391, 2004.