The sea surface microlayer (SML) is generally defined as the uppermost millimeter of the ocean (Liss and Duce 1997), how-ever, most processes at the air-sea interface occur over gradients of varying thickness. It is now well recognized that physical, chemical, and biological processes are distinctly different in the SML as compared to underlying waters (UW) (for an exhaustive review, see Liss and Duce 1997). The primary inter-est in the structure and function of the SML is based on its cru-cial role in exchange processes of gases and matter across the air-water interface. In the oceanic environment, the primary
source of surface-active material is phytoplankton primary pro-duction (Zutic et al. 1981), whereas in coastal systems terrestri-ally derived material can also significantly contribute to the formation of distinct surface layers. Localized concentrations of surface active material, so-called “slicks,” are limited to low wind speed (<3 m s–1) (Liss and Duce 1997), however, signifi-cant accumulation of organic matter at the air-sea interface occurs also in the absence of slicks (Williams et al. 1986). Sea surface observations by optical imagery indicate that surface films are a frequent phenomenon, covering large areas of the coastal and open ocean (Kaltenbach 1984; Romano 1996).
Since the discovery of surface-dwelling organisms desig-nated as “neuston” by Naumann (1917), the term “neuston” is commonly used to define all organisms associated with the SML, including microscopic and macroscopic organisms (Welch 1935). Intensive ecological studies of neuston as a specific community started in 1959 when Zaitsev described marine neuston in the Black Sea (Zaitsev 1971). Up until now, bacterioneuston were considered to be the smallest organisms of the neuston community but this community should be extended to virioneuston since viruses may also be present in the SML.
Comparison of samplers for the biological characterization of
the sea surface microlayer
Hélène Agogué
1, Emilio O. Casamayor
1, Fabien Joux
1, Ingrid Obernosterer
1, Christine Dupuy
2, François Lantoine
1,
Philippe Catala
1, Markus G. Weinbauer
3, Thomas Reinthaler
3, Gerhard J. Herndl
3, and Philippe Lebaron
1*1Observatoire Océanologique, Université Pierre et Marie Curie UMR 7621-INSU-CNRS, BP44, 66651 Banyuls-sur-Mer Cedex, France 2Université de La Rochelle, Pôle Sciences, LBEM, EA 3168, Av. Michel Crépeau, 17042 La Rochelle, France
3Department of Biological Oceanography, Royal Netherlands Institute for Sea Research (NIOZ), P.O. Box 59, 1790 AB Den Burg, The Netherlands
Abstract
The surface film of the hydrosphere covers more than 70% of the world’s surface. The sea surface microlayer (SML) or “skin” of the ocean is a sink for natural and anthropogenic material originating from the atmosphere and the water column. Organisms living in this SML are called “neuston.” Our knowledge of the biology of the SML is still in its infancy. Research of the sea surface microlayer requires the use of appropriate sampling tech-niques and strategies, and the question of what is the most suitable device has not yet been answered. In the pres-ent study, we have compared the efficiency of the Harvey glass plate (GP) and the Garrett metal screen (MS) to analyze a wide range of microbiological parameters in SML samples collected at two coastal stations in the NW Mediterranean Sea. Two types of membranes (Teflon and polycarbonate) were also used to collect bacterioneuston. The MS was the most appropriate technique for most biological parameters providing higher enrichment fac-tors as compared to the GP and, therefore, the highest enrichment facfac-tors compared with underlying waters (UW). Control experiments with UW demonstrated that the enrichment reported for the MS was not biased by any selectivity of the sampler itself. Therefore, we recommend the use of the MS when the aim is to compare different biological parameters. In contrast, there is clear evidence that hydrophobic and hydrophilic mem-branes have an important drawback and should not be used for quantification purposes.
*Corresponding author: E-mail: lebaron@obs-banyuls.fr
Acknowledgments
This work was supported by the European Commission (Research Directorate General-Environment Program-Marine Ecosystems) through the AIRWIN project “Structure and role of biological communities involved in the transport and transformation of persistent pollutants at the marine AIR-Water Interface” (contract EVK3-CT2000-00030). The AIRWIN project is part of the EC IMPACTS cluster. We thank Frédérique François-Carcaillet for helpful comments on statistical analysis and Danielle Boissé for language improvements. We are also grateful to the two anonymous reviewers for valuable comments on a previous version of the manuscript.
Limnol. Oceanogr.: Methods 2, 2004, 213–225
© 2004, by the American Society of Limnology and Oceanography, Inc.
and
Our knowledge on the biology of the SML, however, is still in its infancy. On the one hand, organisms present in the SML may have developed life strategies to survive in this habitat exposed to intense solar radiation, high temperature and/or salinity gradients, toxic organic substances, and heavy metals (Liss and Duce 1997). On the other hand, the SML is generally enriched in organic material, and this might fuel bacterial growth and the development of microbial food webs. How-ever, the role of microorganisms in the SML is still unclear and it is a controversial matter. Although higher abundances of microorganisms are frequently reported for the SML as opposed to UW, lower microbial abundances are also reported for the SML (Marumo et al. 1971; Bell and Albright 1982). This variability in microbial abundances reported in the literature might be related to the use of different sampling devices to collect the SML and/or to natural ecological variability of the enrichment (Hardy 1997).
One of the challenges in neustonology is the sampling strategy. The most common samplers are the metal screen (Garrett 1965), the glass plate (Harvey and Burzell 1972), the rotating drum (Harvey 1966; Hardy et al. 1988), the Teflon plate (Larsson et al. 1974), and the tray (Hatcher and Parker 1974). Among these, the metal screen (MS), the glass plate (GP), and the rotating drum (RD) are the most commonly used. The thickness of the SML collected with the MS varies between 250-440 µm (Daumas et al. 1976). In contrast, the GP collects a microlayer of 60 to 100 µm adhered to both sides of the plate (Harvey and Burzell 1972). GP and RD have been compared for abiotic SML components such as oil and metals and no significant differences were found between samplers (Hardy et al. 1988). These two devices sampled, on average 50 to 70 µm of the SML in the same way, i.e., using viscosity and adhesion forces (Hardy et al. 1988). Hydrophilic (e.g. polycar-bonate) and hydrophobic (e.g., Teflon) membranes are also used and the SML thickness collected with these membranes is in the range of 1 to 40 µm (Kjelleberg et al. 1979). Using these membranes, many authors have suggested that bacteri-oneuston tend to be concentrated in the uppermost 1 µm (Norkrans 1980; Hermansson 1990).
Field studies comparing the efficiency of different sampling devices on given SML parameters are relatively scarce (Daumas et al. 1976; Carlson 1982; Falkowska 1999a, 1999b). In fact, the question of the most suitable method of sampling the SML is far from being answered. To determine the influence of the type of sampler on SML enrichment factors, one should com-pare data of several types of samplers used simultaneously. However, the higher the number of parameters to be analyzed and, therefore, the volume to be collected, the greater the impact of spatial and temporal SML heterogeneity on the final results. Indeed, the SML in the natural environment is patchy (Hardy and Apts 1984) and submitted to temporal variations at a given site (Carlucci et al. 1992).
The aim of this study was to compare the performance of two SML sampling devices, GP and MS, respectively for a large
set of biological parameters. In addition, we used two types of membranes to compare their efficiency for specific bacterial parameters. The intercomparison was carried out in the Mediterranean Sea at a coastal oligotrophic site (Bay of Banyuls-sur-Mer, France) and a eutrophic, heavily human-impacted coastal station (off Barcelona, Spain). The results for the SML with the different sampling devices are compared with those from UW (i.e., 50 cm below the surface) and are expressed as enrichment factors (EF).
Materials and procedures
Field sites and sample collection—Samples were collected at two coastal stations in the NW Mediterranean Sea: the Bay of Banyuls-sur-Mer (France) and off the Olympic Harbour in Barcelona (Spain) (Fig. 1). The Bay of Banyuls-sur-Mer is olig-otrophic (Médernach et al. 2001; Grémare et al. 2003). The Barcelona site is moderately eutrophic and heavily impacted by the urban sewage sludge outfall (Bayona et al. 1991; Cha-laux et al. 1994). Samples were collected early in the morning around 4 to 5 h during four field campaigns (March 2001, Sep-tember 2001, March 2002, and June-July 2002). Samples were taken from an inflatable boat and the abundance, biomass, and activity of heterotrophic and autotrophic microorganisms were determined in the SML and UW as described below.
At each site, 20 L of the SML were simultaneously collected by MS and GP. The MS consists of a stainless steel screen (mesh size: 1.25 mm, wire diameter: 0.36 mm) stretched over a 60 × 80 cm steel frame (Garrett 1965; Daumas et al. 1976). The MS was lowered vertically through the surface of the water then oriented horizontally and lifted through the SML. To collect 20 L, about 200 to 250 successive samplings (~2 h) were car-ried out (Hühnerfuss 1981a, 1981b). The GP (500 × 250 × 4 mm) thoroughly cleaned with ethanol and Milli-Q water, was verti-cally introduced across the SML and withdrawn vertiverti-cally (Harvey and Burzell 1972). The excess water was allowed to drain for about 20 s by holding the GP in a vertical position and the water adhering to the plate was subsequently removed from both sides of the GP with a Teflon wiper blade. About 1 L was collected within one hour for each GP sampler. Samples from UW were collected by submerging a polycarbonate (PC) bottle and opening it at a 0.5 m depth.
During periods when the wind force was below 3 m s–1, the SML was also sampled with membranes that were allowed to float on the surface of the water for 1 min. Two types of mem-branes were used for the sampling: a hydrophilic polycarbon-ate membrane (diameter = 47 mm, 0.22 µm pore size, Isopore Membrane Filter, Millipore) and a hydrophobic Teflon mem-brane (diameter = 47 mm, 0.22 µm pore size, Fisher Bioblock Scientific). The membranes imbibed in the sea-surface film were retrieved with forceps and transferred to sterile flasks filled with 20 mL of 0.22 µm filter-sterilized seawater. A total of six membranes were placed in each flask. Tween 80 (2% final concentration) was added and the flasks were shaken vig-orously for 5 min. Tween 80 was used as a washing agent to
detach the microorganisms from the membrane (Norkrans and Sörensson 1977; Kjelleberg et al. 1979; Dahlbäck et al. 1981). Five independent samplings with 3 sets of 6 mem-branes each were carried out. To estimate both dilution factors and final concentrations for each parameter analyzed, we used the mean volume collected per membrane calculated by dif-ferential weighting. The SML thickness sampled was deter-mined by dividing the mean volume collected by the mem-brane, by the membrane area.
EF were calculated as the ratio of the biological parameters in the SML to those in UW. An EF > 1.0 indicates an enrich-ment in the SML, and an EF < 1.0 indicates a depletion.
Experiment to determine the potential selectivity of the sampling devices—Samplers might have inherent properties, which could lead to biases such as selectivity in adsorbing microor-ganisms to the collecting surface. To test the inherent proper-ties of the samplers used, 3 independent experiments were car-ried out in the Bay of Banyuls-sur-Mer over a diurnal cycle. Therefore, water was pumped from 1 m depth at 900 h, 1400 h, and 1700 h, local time, and transferred to 2 polycarbonate containers (110 × 70 × 60 cm) of 400 L each. The water was homogenized and immediately sampled from the containers by the MS (for the first container) and the GP (for the second container). The water in the polycarbonate containers was
homogenized during the sampling. Controls consisted of water sampled with a 500-mL PC bottle submerged to 0.5 m in the containers. Five replicate samples were collected for all parameters analyzed.
A second set of control experiments was also carried out for the two types of membranes. During 5 independent field campaigns, UW were sampled with a PC bottle and trans-ferred to a 4-L incubator. Subsequently, bacteria were sampled from UW using Teflon and polycarbonate membranes as described above. The results were compared with standard bottle sampling.
Enumeration of the autotrophic and heterotrophic microbial community—Samples (3 mL) for flow cytometry analyses of both heterotrophic and autotrophic bacteria and photosyn-thetic eukaryotes were fixed with formaldehyde (2% final con-centration) in cryotubes. The samples were left at room tem-perature for 10 to 15 min, frozen in liquid nitrogen, and stored at –80°C until analysis. The samples were run through a flow cytometer (FACScan, Becton Dickinson) equipped with a 488-nm, 15-mW Argon laser. Phytoplankton cells were dis-criminated and counted according to Legendre et al. (2001) and Marie et al. (2000). The phycobilins of the cyanobacteria Synechococcus emit strong orange fluorescence and were dis-tinguished from the red fluorescence of the chlorophyll. The 2 groups of microbial photosynthetic eukaryotes (i.e., picoeukaryotes and nanoeukaryotes) were discriminated by their scatter signals and the fact that red fluorescence from their chlorophyll was more intense than that of Synechococcus. Heterotrophic bacteria were stained with a nucleic acid dye (SYBR-Green I; final concentration 0.01% [vol/vol] of the commercial solution; Molecular Probes) and stored for at least 15 min at room temperature in the dark before count-ing was carried out. Stained bacteria were discriminated and counted according to their right angle light scatter and the green fluorescence measured at 530/30 nm (Marie et al. 1997, 2000). The number of bacterial cells with a high and low nucleic acid (HNA and LNA, respectively) content are determined according to Servais et al. (2003) and Lebaron et al. (2002).
Enumeration of culturable bacteria—Samples for culturable bacteria were processed within 4 h after sampling. Serial dilu-tions (1:10 and 1:100) were prepared with filter-sterilized sea-water and 100 µL of each dilution was plated on 3 replicate plates on Marine Agar 2216 media (Difco). Colony-forming units (CFU) were counted after an incubation at 25°C in the dark for 1 to 2 weeks.
Enumeration of viruses—Samples (2 mL) were fixed with formaldehyde (2% final concentration) and filtered onto 0.02 µm filters (Whatman; Anodisc, 25 mm diameter). Viral particles were stained on the filters using SYBR-Green I (Molecular Probes) and enumerated under a Zeiss Axiophot microscope equipped for epifluorescence microscopy as previously described (Noble and Fuhrman 1998). At least 400 viral parti-cles were counted per filter.
Enumeration of ciliates and flagellates—Ciliates and flagel-lates were fixed, stained, and enumerated according to Dupuy et al. (1999). This method is a modified version of the method previously described by Haas (1982), Caron (1983), and Sherr et al. (1994). Briefly, for counting flagellates, triplicate 100 mL samples were preserved with formaldehyde (1% final concen-tration). Each sample was concentrated by filtration through 0.8 µm to a volume of 10 mL and subsequently stained with primulin (50 µg mL–1final concentration) and flagellate abun-dance was determined by epifluorescence microscopy. For cil-iates, triplicate 1 L samples were stained alive for 10 min by adding proflavin hemisulfate solution (0.00066% final con-centration). Then, stained ciliates were preserved by adding glutaraldehyde (1% final concentration), and the cells were enumerated using a reverse epifluorescence microscope.
Bacterial production—Bacterial production was estimated from the rates of protein synthesis using [14C]L-leucine (Amer-sham, S.A.; 319 mCi mmol–1) (Simon and Azam 1989) or via [3H]-thymidine incorporation (Amersham, S.A.; 85 Ci mmol–1) (Fuhrman and Azam 1982). Duplicate samples and one formaldehyde-killed control were incubated with 20 nmol L–1of [14C]L-leucine or with [3H]-thymidine (final concentra-tion). Five- or 10-mL samples were incubated in the dark at in situ temperature for 0.5 to 1 h. Incubations were termi-nated by adding formaldehyde (2% final concentration). Subsequently, the samples were filtered through 0.45 µm Millipore HAWP filters followed by 3 rinses with 5 mL of ice-cold 5% trichloroacetic acid. The filters were subsequently dissolved in 1 mL ethyl acetate (Riedel de Haen) and after 10 min, 8 mL of scintillation cocktail (Insta-gel plus II, Canberra Packard) were added. The radioactivity of the filter was assessed after 18 h.
Pigments—Chlorophyll a, b, and c and phaeophytin a were determined according to Neveux and Lantoine (1993). Tripli-cate samples (200 mL) were passed through Whatman GF/F fil-ters, which were immediately frozen in liquid nitrogen. Filters were extracted in acetone (90% final concentration). Extracts were kept at 4°C for 12 h and centrifuged before the absorbance of the supernatant was measured on a Perkin Elmer MPF66 spectrofluorometer (Neveux and Lantoine 1993).
Population structure of the bacterial communities—Two genetic fingerprinting techniques were used to study the bac-terial community structure, i.e., denaturing gel gradient elec-trophoresis (DGGE) and single-strand conformation polymor-phism (SSCP).
For DGGE analysis, 10 mL of water sample were filtered through 0.2 µm pore size filters (GTTP, Millipore) and the fil-ters were processed according to Bernard et al. (2000). Twenty milliliters of lysed solution were used as template for poly-meric chain reaction (PCR) amplification of bacterial 16S rDNA. The forward primer 358f (CCTACGGGAGGCAGCAG) with a GC-clamp and the reverse primer 907r (CCGTCAATTC-CTTTGAGTTT) were used following the protocol described elsewhere (Casamayor et al. 2000). DGGE was performed with
the DGGE-D-CODE system (BioRad) at 200 V, 60°C for 3.5 h on a 6% polyacrylamide gel. The denaturing gradient in the gel was 20% to 70% (100% denaturing agent is defined as 7 M urea and 40% deionized formamide). The gel was stained with SybrGold nucleic acid gel stain (1:10,000 dilution; Molecular Probes) in the dark for 20 min, rinsed with Milli-Q water, and visualized under ultraviolet light. Digitized images were obtained with a Pulnix TM-6EX camera, saved as computer files, and analyzed with the NIH Image (National Institutes of Health) software. Bands occupying the same position in dif-ferent lanes were identified using software facilities, and one matrix with presence or absence data were built. A binary data set was used to calculate a similarity matrix using the Jaccard’s coefficient with the software SYSTAT 5.2.1 for Macintosh, and a dendogram was obtained by UPGMA (unweighted pair-group method with arithmetic averages) in cluster analysis (Casamayor et al. 2002).
For SSCP analysis, 50 mL of water sample were filtered through 0.2 µm pore size filters (GTTP, Millipore) and stored at –80°C. Filters were thawed and resuspended in 900 µL of lysis buffer (40 mM EDTA, 50 mM Tris-HCl pH 8, 0.75 M sucrose). Lysozyme was added (1 mg mL–1final concentration) and the suspension was incubated at 37°C for 45 min. After addition of proteinase K (0.2 mg mL–1final concentration) and sodium dodecyl sulfate (1% final concentration), the samples were incubated at 55°C for 1 h. DNA was then extracted with an equal volume of phenol-chloroform-isoamyl alcohol (25:24:1, vol/vol/vol) and was precipitated by the addition of one-tenth of the volume of 3 M sodium acetate and two vol-umes of cold isopropanol followed by incubation at –20°C for 3 h. DNA was recovered by centrifugation at 10000g for 30 min, and the pellet was washed with cold 70% ethanol, dried, and resuspended in 20 µL of sterile Milli-Q water. For PCR amplification, the bacterial primers W49 dir (Escherichia coli position 331; 5′-ACG-GTC-CAG-ACT-CCT-ACG-GG-3′) and W34 rev (E. coli position 533; 5 ′-TTA-CCG-CGG-CTG-CTG-GCA-C-3′; 5′-labeled with fluoresceine phosphoramidite TET, Applied Biosystems) were used as reported elsewhere (Servais et al. 2003). For SSCP fingerprinting analysis, PCR products were heat denatured at 94°C for 5 min and immediately placed on ice for at least 10 min. A fluorescently labeled inter-nal size marker was added (Genescan-400 Rox, Applied Biosys-tems). The size standard contained a different fluorophore and permitted, after computing correction, a reliable comparison of patterns from each sample. SSCP electrophoresis was carried out as previously described (Servais et al. 2003) using the ABI 310 Genetic Analyzer equipped with a capillary tube (Applied Biosystems). Computer files were analyzed with the 310 Genescan Analysis software (Applied Biosystems).
Statistical analysis—To test statistical differences between results obtained with the MS and the GP, and between the SML and UW, the Wilcoxon signed rank test was applied (Scherrer 1984; Siegel and Castellan 1988; Zar 1999). The Wilcoxon signed rank test was chosen because of the
non-parametric distributions of the parameters analyzed. To ensure valid statistical comparisons, the data of the sampler control experiment were analyzed using a Student t test at the 99% confidence level.
Assessment
Experiments to determine the potential selectivity of the sam-pling devices—To test the potential biases of the MS and the GP as compared to standard bottle sampling, 3 independent experiments were carried out using UW confined in 400-L containers (Table 1). Control experiments are essential to determine whether selective adsorption to the different sam-pler surfaces exist. It should be performed to check for the potential bias that can be introduced by the sampler itself. Surprisingly, we are aware of only one published study that takes such potential bias into consideration (Hatcher and Parker 1974). These authors analyzed UW collected with both SML samplers (drum, metal screen, and tray) and the standard bottle and found no significant difference in CFU counts, the only parameter tested. In our study, we analyzed a large set of parameters of UW collected with the GP, the MS, and the standard PC bottle. Overall, no significant differences among UW sampled with the MS, the GP, and the PC bottle were detectable for the parameters studied (Student t test, P > 0.05). Concentrations of chlorophyll, however, were significantly lower in UW collected with the MS as compared to the PC bot-tle (Student t test, P < 0.01) (Table 1), probably due to the adsorption or attachment of large autotrophic cells on the sur-face of the screen. Estep et al. (1985) and Falkowska (1999b) have already suggested that macroscopic algal filaments often remain trapped on the screen during draining. In the present study, the SML sampled by the MS was significantly enriched in chlorophyll. However, as indicated by the control experi-ment for the MS, this enrichexperi-ment of chlorophyll is probably slightly underestimated. For culturable bacteria and bacterial production, substantial variability among replicates of UW was observed independent of the sampling device used. Nev-ertheless, as a whole, there were no significant differences between these SML samplers and the PC bottle suggesting that the MS and the GP did not introduce any bias.
Hydrophobic (Teflon) and hydrophilic (polycarbonate) membranes were also used to collect total and culturable bac-teria from the UW. The small sample volume collected by these membranes reduced the number of parameters that could be analyzed (Table 2). Furthermore, due to the autofluorescence of the surfactant used to detach cells from the membranes, flow cytometry analysis of autotrophic cells was not possible. To our knowledge, only one published study has carried out control experiments for selective attachment to membranes (Crow et al. 1975). These authors report similar counts for culturable bacteria in UW collected with membranes and using a standard bottle. On the other hand, in the present study, the enrich-ment detected in total and culturable bacteria using both Teflon and polycarbonate membranes, as compared with the
traditional bottle sampling, was not restricted to the SML. When UW were sampled with these membranes, the enrich-ment was in the same order of magnitude as that found for the SML (Table 2). This important drawback is due to adsorption of bacteria to surface on hydrophilic and hydrophobic mem-branes. Such a bias is probably more important for viable cells with electrically charged membranes. Consequently, this adsorption effect is more readable for culturable bacteria because all the counted cells are living, whereas total counts include a more or less important fraction of dead cells.
Reference depth of UW—EF are determined in reference to concentrations found in UW with depths that vary greatly among reports, ranging from 0.10 to 5.0 m. In this study, two depths in UW (0.50 and 5.0 m) were analyzed during two campaigns in March and June through July 2002. For most biological parameters, no significant difference was found between the two depths (Wilcoxon test rank, P > 0.05, n > 16) (data not shown). However, total bacteria, bacterial produc-tion by thymidine and leucine incorporaproduc-tion, and chloro-phyll a were significantly enriched by EF of 1.10, 1.90, 2.74,
Table 1
. Analysis of underlying water sampled by the metal screen (MS), the glass plate (GP), and the polycarbonate (PC) bottle to test for possible adsorption artifacts introduced by the MS and the GP as compared to sampling with the PC bottle*900 h, mean (CV%) 1400 h, mean (CV%) 1700 h, mean (CV%)
Total bacteria (105mL–1) MS 7.73 (7) 7.15 (10) 8.17 (3) GP 7.71 (3) 7.17 (10) 8.15 (4) PC bottle 7.46 (3) 5.41 (10) 7.69 (4) Culturable bacteria (102mL –1) MS 5.16 (22) 3.69 (5) 19.35 (36) GP 4.24 (3) 4.51 (27) 3.20 (33) PC bottle 2.85 (15) 3.14 (27) 4.85 (33)
Bacterial production (pmol leucine L–1 h–1)
MS 31.60 (18) 34.10 (39) 45.56 (18) GP 39.91 (53) 23.44 (45) 50.63 (47) PC bottle 65.15 (24) 40.12 (35) 28.14 (37) Synechococcus (104mL–1) MS 8.24 (2) 6.95 (1) 6.55 (1) GP 8.17 (2) 6.74 (4) 7.06 (1) PC bottle 7.85 (1) 6.88 (1) 6.64 (1) Photosynthetic picoeukaryotes (103mL–1) MS 2.46 (4) 2.46 (4) 2.43 (3) GP 2.78 (1) 2.50 (3) 2.66 (5) PC bottle 2.83 (6) 2.72 (2) 2.45 (4) Photosynthetic nanoeukaryotes (103mL–1) MS 1.68 (1) 1.24 (6) 1.38 (1) GP 1.74 (19) 1.23 (9) 1.67 (5) PC bottle 1.79 (5) 1.81 (1) 1.78 (4) Chlorophyll a (µg L–1) MS 0.353† (3) 0.368† (5) 0.384† (4) GP ND ND ND PC bottle 0.532 (6) 0.560 (4) 0.527 (7) Chlorophyll b (µg L–1) MS 0.027‡ (7) 0.03‡ (8) 0.032‡ (4) GP ND ND ND PC bottle 0.049 (5) 0.051 (4) 0.053 (7) Chlorophyll c (µg L–1) MS 0.048† (3) 0.05† (8) 0.053† (4) GP ND ND ND PC bottle 0.079 (5) 0.082 (4) 0.078 (7)
*Values are means of 5 replicate samples. CV, coefficient of variation; ND, not determined. †P < 0.01 (Student t test).
and 1.34 respectively, at 0.5 m as compared to 5 m (Wilcoxon test rank, P < 0.05, n > 13) (data not shown). Therefore, the depth at which samples of UW are collected should be care-fully defined and controlled at each sampling because varia-tions in the depth at which UW are collected may result in different EF.
Metal screen versus glass plate—A comparison between the MS and the GP was carried out to determine their perform-ances for sampling microbiological parameters of the SML. EF for the individual parameters from the two different coastal stations were not significantly different from each other (Stu-dent t test, P > 0.05). Thus, EF obtained for the 2 study sites were pooled and are shown for the individual parameters in Table 3. Overall, EF varied substantially between the two sam-pling devices for all the biological parameters determined in the present study. SML samples collected with the MS were for 10 of 14 parameters higher as compared to SML samples col-lected with the GP. Significant differences between the SML and UW were detectable for both sampling devices. Using the MS, 10 of 14 parameters were significantly enriched in the SML as compared to UW, whereas for samples collected with the GP, only 4 parameters were significantly enriched (Wilcoxon test rank, P < 0.05) (Table 3).
Phytoneustonic and zooneustonic parameters—The GP was less efficient than the MS for the analysis of phytoneustonic parameters (e.g., abundance of photosynthetic nanoeukary-otes, chlorophyll a, b, and c, phaeophytin a) (Wilcoxon test rank, P < 0.005) (Table 3). Moreover, the SML was significantly depleted in photosynthetic nanoeukaryotes and chlorophyll a and c when the GP was used (Wilcoxon test rank, P < 0.005). Carlson (1982) also reports that most of the GP samples were depleted in chlorophyll a as compared to UW. Depletion of phytoneuston and chlorophyll a in the SML has been attrib-uted to inhibitory factors such as high light intensities, pesti-cides, and heavy metals (Albright 1980; Falkowska and Latala
1995). However, the bias introduced by the sampler itself should be also taken into account. Large cells such as diatoms are probably not retained on the surface of glass plates, result-ing in lower EF in comparison to the MS.
When photosynthetic nanoeukaryote counts, chlorophyll and phaeophytin a were determined in MS samples, the EF was significantly higher than one and consistently higher than those reported with the GP (Table 3). Other studies inves-tigating the concentration of chlorophyll a in the SML reveal in general similar moderate values for the EF (Daumas et al. 1976; De Souza Lima and Chrétiennot-Dinet 1984). In the present study, EF for phaeophytin a were consistently higher than those for chlorophyll a. The ratio of phaeophytin a to chlorophyll a is generally higher in the SML than in UW, and it is believed that this indicates unfavorable conditions for photosynthesis (Daumas et al. 1976). The comparatively high content of phaeophytin in the SML may be attributable to photo-oxidation of chlorophyll, significant consumption of microalgae by zooneuston, and the input of positively buoy-ant dead cells from UW (Hardy and Apts 1984). As discussed earlier for chlorophyll a, there is probably also a bias for phaeophytin when using the MS, most likely due to the adsorption of cells to the screen. However, the MS appears to be better suited for the analysis of phytoneustonic parameters than the GP.
For heterotrophic nanoflagellates, a significant enrichment was found with the GP and the MS. EF were higher with the MS but the difference between samplers was not significant (Table 3). In contrast, ciliates were depleted in SML samples collected by both samplers and the depletion was more pro-nounced with the GP (Table 3). This is probably due to the fact that the larger the organisms are, the lower their capacity to attach to the surface of the plates and, to a lesser extent, to the screen. Ciliates are usually concentrated in the SML during the night (Hardy 1982; Falkowska and Latala 1995), and this could
Table 2.
Comparison between the Teflon membrane and polycarbonate membrane in terms of volume sampled, thickness of the water layer sampled, the range of enrichment factors (EF)Teflon membrane Polycarbonate membrane
SML* UW* SML* UW* Volume sampled Range 40-202 µL 27-79 µL 174-368 µL 91-175 µL Mean (CV%) 134 µL (60) 54 µL (47) 265 µL (33) 125 µL (26) Thickness of water Range 23-117 µm 16-46 µm 100-212 µm 52-101 µm Mean (CV%) 78 µm (60) 31 µm (47) 153 µm (33) 72 µm (26)
Total bacteria (EF )
Range 2.1-46.3 3.0-50.1 0.7-20.8 2.1-18.8
Mean (CV%) 25.7 (84) 19.8 (94) 12.2 (68) 10.2 (68)
Culturable bacteria (EF )
Range 9.1-101 3.6-85 2.5-58 0.7-126
Mean (CV%) 52.0 (89) 44.2 (77) 42.4 (63) 45.7 (111)
explain why our SML samples taken early in the morning were depleted. Furthermore, zooneuston are larger in size than microorganisms and nets are probably more appropriate to collect these organisms.
Virioneustonic and bacterioneustonic parameters—The EF reported for culturable bacteria were the highest of all the determined parameters in this study (11.1 and 13 for MS and GP, respectively) (Table 3) and similar enrichments are reported in the literature. Tsyban (1971) reported CFU con-centrations 10 to 20 fold higher in the SML than in UW for samples collected with an MS. Using a GP, Dietz et al. (1976) report culturable counts 2 orders of magnitude higher in the neuston as compared to UW. In the present study, both sam-plers resulted in EF not significantly different from each other. However, remarkable variations in EF were detectable inde-pendent of the sampler used. The enrichment of CFU in the SML could be explained by (1) the higher concentrations of dissolved and colloidal organic compounds in the SML pro-viding energy and nutrients, (2) by protective agents toward stress factors such as radiation (Liss and Duce 1997), and (3) by preferential attachment of living cells with polarized membranes to bubbles and particles.
Reports on the abundance of total bacteria in the SML vary greatly among studies. Whereas some studies report EF in the order of 102to 103(Marumo et al. 1971; Harvey and Young 1980a, 1980b; Carlucci et al. 1991), bacterial abundance is also reported to be depleted in the SML (Bell and Albright 1982). We found only a slight but significant enrichment of total bac-terial counts in the SML when samples were collected with the GP and the MS (Wilcoxon test rank, P < 0.005) (Table 3). Higher enrichments (EF ranging from 1.7 to 32) have been reported for samples collected with the MS and counted by epifluorescence microscopy (Marumo et al. 1971; Harvey and Young 1980a, 1980b). The lower values reported in this study could be due to the fact that particle-attached bacteria cannot be counted by flow cytometry and may represent a significant part of total bacteria present in the SML (Harvey and Young 1980a, 1980b). However, we determined from a few samples that the fraction of attached bacteria was less than 3% of total bacteria (Obernosterer et al. subm.). Therefore, differences in the reported EF for bacteria might also reflect the heterogene-ity of the systems studied. In addition to the reported param-eters, flow cytometry analysis was used to determine the frac-tion of cells with a high (HNA) and a low (LNA) nucleic acid
Table 3.
Summary of enrichment factors (EF) of all biological parameters derived from the metal screen (MS) and the glass plate (GP) and statistical comparison between the sea surface microlayer (SML) samplers and underlying waters (UW)*Metal screen† Glass plate† Wilcoxon test‡
Mean Mean MS vs GP vs MS vs EF Range n EF Range n UW n UW n GP n Total bacteria 1.09 0.73-1.50 38 1.18 0.82-2.65 28 S*** 36 S** 25 NS 25 Culturable bacteria 11.07 0.50-49 31 13.00 0.02-75 18 S*** 30 S*** 17 NS 16 Bacterial production 1.21 0.07-6.23 27 1.02 0.05-5.42 15 NS 27 NS 16 NS 15 (leucine) Bacterial production 0.69 0.07-3.09 12 0.76 0.16-1.60 10 NS 10 NS 10 NS 10 (thymidine) Virus 2.11 0.76-8.54 11 1.93 0.47-4.86 9 NS 11 NS 10 NS 9 Synechococcus 1.10 0.45-1.92 31 1.05 0.15-1.61 21 S** 34 S* 24 NS 25 Photosynthetic 1.42 0.29-7.66 31 1.12 0.75-2.61 21 S* 33 NS 24 NS 25 picoeukaryotes Photosynthetic 1.63 0.81-3.55 31 0.86 0.46-1.34 21 S*** 34 S*** 24 S*** 25 nanoeukaryotes Chlorophyll a 1.76 0.94-4.33 24 0.71 0.26-1.13 11 S*** 24 S*** 11 S*** 12 Chlorophyll b 2.16 0.66-9.95 24 1.03 0.46-1.71 11 S* 23 NS 11 S*** 12 Chlorophyll c 1.62 0.82-3.14 24 0.62 0.23-0.93 11 S*** 24 S*** 11 S*** 12 Phaeophytin a 9.97 0.06-41.46 21 1.04 0.22-2.57 11 S*** 20 NS 10 S*** 12 Heterotrophic 5.44 0.67-15.57 18 2.81 1.38-4.50 6 S*** 18 S* 6 NS 6 flagellates Ciliates 0.63 0.05-2.78 11 0.29 0.10-1.11 6 S* 11 NA <6 NS 6
*Results from the two sampling sites are pooled. †Depletions are in bold type.
‡S*, significant difference P < 0.05; S**, significant difference P < 0.01; S***, significant difference P < 0.005; NA, not applicable; NS, no significant difference.
content, which represent the most and the least active cells, respectively, within natural communities (Lebaron et al. 2002; Servais et al. 2003) (data not shown). No significant difference between the MS and the GP for HNA and LNA cells was found (Wilcoxon test rank, P > 0.05, n = 19) (data not shown). Our experience indicate that both samplers provide similar counts and they seem to be appropriate for sampling total and cul-turable bacteria in the SML.
Bacterial activity was estimated from DNA and protein synthesis measurements. Again, the range of EF was impor-tant for both thymidine and leucine incorporation rates and no significant difference between samplers and between the SML and UW was detectable for this parameter (Table 3). This indicates that bacterial activity in the SML was not enhanced as compared to that in UW. Results reported in the literature are very contradictory so far. The SML collected by the GP, Bell and Albright (1982) as well as Dietz et al. (1976) found higher incorporation rates in UW in comparison to SML. Other studies on bacterial activity in SML have used different kinds of samplers, and they are, therefore, not directly com-parable with our study. From our results we may conclude that both, the GP and the MS are performing equally well for bacterial activity assessments.
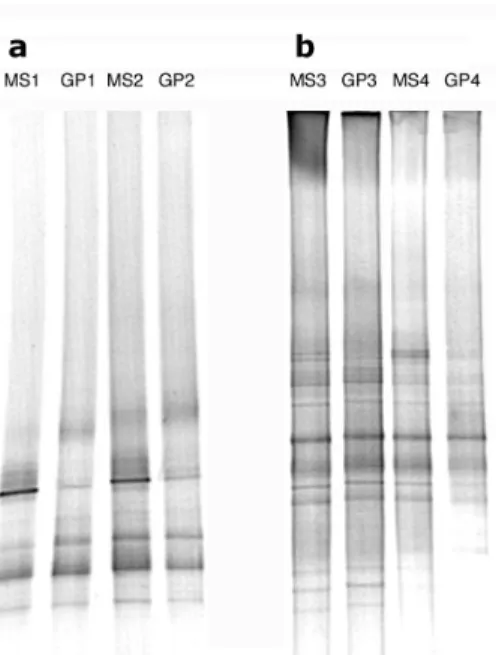
Considering that the two samplers had surfaces with differ-ent physical properties, we also investigated the effect of each sampler on the structure of bacterial communities. We specu-lated that even if counts were similar, each sampler may have a selective effect on bacterial species, which have different sur-face properties. Genetic fingerprinting methods showed that
the MS and the GP had no selective effect on the main ponents of the bacterial communities. Fig. 2 shows the com-parison using DGGE for Barcelona and Banyuls-sur-Mer sam-pling points in March 2001. The banding pattern was qualitatively identical for samples collected using either the MS or the GP as indicated by the similarity values calculated (Table 4). However, changes in the signal intensity were detectable for a few DGGE bands (Fig. 2). We carried out the same procedure with samples collected in June and July 2002 using a more precise genetic fingerprinting method (SSCP, Fig. 3). The SSCP products were not exactly the same for the GP and the MS as indicated by similarity values calculated in Table 4. However, the qualitative differences found corre-sponded to minor components of the bacterial assemblage (minor peaks in the SSCP profiles). These results indicate that both samplers collect the same dominant species, although some differences were found in the relative contribution of some populations. These differences were higher than differ-ences found among PCR replicates. Therefore, both samplers can be used to investigate the structure of bacterial communi-ties but quantitative data requires a cautious interpretation.
Viruses can be counted by epifluorescence microscopy after staining with a nucleic acid dye (Noble and Fuhrman 1998). We are not aware of any results on the abundance of viruses in the SML of marine waters. In the present study, no signifi-cant difference was detectable between counts in the SML and that in UW. Furthermore, no significant differences between samplers were observed. Therefore, the GP and the MS are per-forming equally well for counting viruses.
The case of membranes—Membranes offer the advantage of collecting a very thin layer (10 to 50 µm) to further inves-tigate the vertical distribution of organisms in the SML. In this study, the EF found for total and culturable bacteria using membranes were higher than those obtained with the GP and the MS. EF for the SML sampled with the two types of membranes varied between 0.7 and 46.3 and 2.5 and 101 for total bacterial abundance and culturable bacteria, respec-tively (Table 2). The high enrichments found in the present study are congruent with data reported from other environ-ments. For total bacteria and hydrophobic Nuclepore filters,
Table 4.
Similarity values (Jaccard coefficient) for the absence/ presence of data of the DGGE gel and of the SSCP data shown in Fig. 2 and 3 respectivelyDate MS vs GP DGGE 14 March 2001 1.00 15 March 2001 1.00 17 March 2001 1.00 18 March 2001 1.00 SSCP 26 June 2002 0.87 27 June 2002 0.79 2 July 2002 1.00
Fig. 2.Negative image of DGGE gels containing PCR-amplified seg-ments of bacterial 16S rRNA genes from (a) Barcelona and (b) Banyuls-sur-Mer sampling stations using the metal screen (MS) and the glass plate (GP). MS1 and GP1: 15 March 2001; MS2 and GP2: 14 March 2001; MS3 and GP3: 18 March 2001; MS4 and GP4: 17 March 2001.
Sewell et al. (1981) and Hardy and Apts (1984) found EF ranging from 9,678 to 32,305 and from 23 to 12,000, respec-tively. While the volume of water sampled by the Teflon membrane was substantially lower than that sampled by the polycarbonate membrane, the Teflon membrane exhibited about twice the EF for total and culturable bacteria (Table 2). In this line, Kjelleberg et al. (1979) found an enrichment in culturable bacteria ranging from 80 to 10,100 when the SML was collected with hydrophobic membranes and for hydrophilic membranes from 2 to 284. Thus, hydrophobic membranes collect more bacteria, although the SML thick-ness collected is two times smaller than the SML collected with hydrophilic membranes. Although many results of the
literature suggest that most bacteria are concentrated in the top 10 µm of the SML, these studies also suggest that dilu-tion of bacteria could occur with other sampling devices. However, as stated above, these high EF exceeding by far those of the MS and the GP are due to the selective adsorp-tion of microorganisms by these membranes as determined in the present study. These conclusions should be consid-ered with caution due to the sampling bias.
Discussion
Control experiments are essential to determine whether selective adsorption to the different sampler surfaces exist. Surprisingly, we are aware of only one published study that
Fig. 3.SSCP fingerprints containing PCR-amplified segments of bacterial 16S rRNA genes from (a) and (b) Barcelona (26 and 27 June 2002, respec-tively) and (c) Banyuls-sur-Mer (2 July 2002) sampling stations using MS and GP samplers.
takes such potential bias of SML samplers into consideration (Hatcher and Parker 1974) and one published study, which has carried out control experiments for selective attachment to membranes (Crow et al. 1975). Sampling with membranes has important drawbacks due to the selective adsorption of bacteria to surfaces. As a consequence, many reports on bacte-rioneuston, based on this sampling technique, have generally overestimated bacterial counts yielding the conclusion that bacteria are present at high concentrations in the SML. There-fore, high bacterial abundances reported in the literature for SML collected with membranes should be considered with caution. Because membranes cannot be used for quantifica-tion purposes, their use should be limited to the isolaquantifica-tion of bacterial cells.
In the same way, the depth at which samples of UW are col-lected should be carefully defined and controlled at each sam-pling because variations in the depth at which UW are col-lected may result in different EF. Consequently, any comparison with EF reported in the literature should also be related to the reference depth of UW.
The MS and the GP seem to be appropriate for sampling total and culturable bacteria and viruses, for bacterial activity assessments, and for investigating the structure of bacterial communities in the SML. However, the MS appears to be bet-ter suited for the analysis of phytoneustonic paramebet-ters than the GP. Nets are probably more appropriate to collect organ-isms, which are larger than flagellates.
Comments and recommendations
The question about the most suitable method for sampling the SML for biological studies has not yet been answered. At present, the metal screen and the glass plate are the most fre-quently used samplers. They differ in the thickness of the col-lected SML, the thickness being larger with the MS, and they differ by their physical properties. Obviously, the problem of comparison of data obtained by different types of samplers is closely related to where the different types of organisms from virioneuston to zooneuston are located in the SML.
The thinner is the layer collected, the closer the biological composition of the sample to the original distribution in the SML will be. Under this point of view, the GP is preferable. However, the MS offers the smallest contact area between the water film to be sampled and the sampler, which probably results in the lowest contamination of the SML. Furthermore, the MS offers the advantage of being more adapted than the GP to collect organisms within a wide range of sizes (from viruses to flagellates). Another advantage is that the MS col-lects larger volumes in shorter periods of time (roughly 10 L per hour and per screen), something essential when many parameters are to be analyzed. In contrast, the GP has a much lower sampling capacity (1 L per hour and per plate). The time of sampling is of great importance because the longer the time of sampling, the higher the effect of temporal and spatial vari-ability. Thus, we recommend the use of the MS when the aim
is the comparison of different parameters. In all cases, control experiments should be performed to check for the potential bias that can be introduced by the sampler itself. There is clear evidence from this study that membranes have important drawbacks and should not be used for quantification pur-poses. Both hydrophobic and hydrophilic membranes over-estimate the concentration of living organisms by selective surface adsorption. However, sampling with membranes remains of interest for rapid and easy collection of bacteria liv-ing in the surface microlayer.
Finally, the depth at which UW samples are collected must be carefully determined depending on the question to be answered. Furthermore, any comparison with other reports in the literature should be based not only to the SML sampler but also to the reference depth of UW.
References
Albright, L. 1980. Photosynthetic activities of phytoneuston and phytoplankton. Can. J. Microbiol. 26:389-392.
Bayona, J. M., P. Fernandez, C. Porte, I. Tolosa, M. Valls, and J. Albaiges. 1991. Partitioning of urban wastewater organic microcontaminants among coastal compartments. Chemosphere 23:313-326.
Bell, C. R., and L. J. Albright. 1982. Bacteriological investiga-tion of the neuston and plankton in the Fraser River estu-ary, British Columbia. Estuar. Coast. Shelf Sci. 15:385-394. Bernard, L., C. Courties, P. Servais, M. Troussellier, M. Petit,
and P. Lebaron. 2000. Relationships among bacterial cell size, productivity, and genetic diversity in aquatic environ-ments using cell sorting and flow cytometry. Microb. Ecol. 40:148-158.
Carlson, D. J. 1982. A field evaluation of plate and screen microlayer sampling techniques. Mar. Chem. 11:189-208. Carlucci, A. F., D. B. Craven, and D. M. Wolgast. 1991.
Micro-bial populations in surface films and subsurface waters: amino acid metabolism and growth. Mar. Biol. 108:329-339. ———, D. M. Wolgast, and D. B. Craven. 1992. Microbial pop-ulations in surface films: amino acid dynamics in nearshore and offshore waters off Southern California. J. Geophys. Res. 97:5271-5280.
Caron, D. A. 1983. Technique for enumeration of het-erotrophic and phototrophic nanoplankton, using epifluo-rescence microscopy, and comparison with other proce-dure. Appl. Environ. Microbiol. 46:491-198.
Casamayor, E. O., and others. 2002. Changes in archaeal, bac-terial and eukaryal assemblages along a salinity gradient by comparison of genetic fingerprinting methods in a multi-pond solar saltern. Environ. Microbiol. 4:338-348.
———, H. Schäfer, H. Baneras, C. Pedros-Alio, and G. Muyzer. 2000. Identification and spatio-temporal differences between microbial assemblages from two neighboring sul-furous lakes: comparison by microscopy and denaturing gradient gel electrophoresis. Appl. Environ. Microbiol. 66:499-508.
Chalaux, N., J. M. Bayona, and J. Albaiges. 1994. Determina-tion of nonylphenols as pentafluorobenzyl derivatives by capillary gas chromatography with electroncapture and mass spectrometric detection in environmental matrices. J. Chromatogr. A. 686:275-281.
Crow, S. A., D. G. Ahearn, W. L. Cook, and A. W. Bourquin. 1975. Densities of bacteria and fungi in coastal surface films as determined by a membrane-adsorption procedure. Lim-nol. Oceanogr. 20:644-646.
Dahlbäck, B., M. Hermansson, S. Kjelleberg, and B. Norkrans. 1981. The hydrophobicity of bacteria—An important factor in their initial adhesion at the air-water interface. Arch. Microbiol. 128:267-270.
Daumas, R. A., P. L. Laborde, J. C. Marty, and A. Saliot. 1976. Influence of sampling method on the chemical composi-tion of water surface film. Limnol. Oceanogr. 21:319-326. De Souza Lima, Y., and M. J. Chrétiennot-Dinet. 1984.
Mea-surements of biomass and activity of neustonic microor-ganisms. Estuar. Coast. Shelf Sci. 19:167-180.
Dietz, A. S., L. J. Albright, and T. Tuominen. 1976. Het-erotrophic activities of bacterioneuston and bacterioplank-ton. Can. J. Microbiol. 22:1699-1709.
Dupuy, C., S. Le Gall, H. J. Hartmann, and M. Bréret. 1999. Retention of ciliates and flagellates by the oysters Cras-sostrea gigas in French Atlantic coastal pond: protists as a trophic link between bacterioplankton and benthic suspension-feeders. Mar. Ecol. Prog. Ser. 177:165-175. Estep, K. W., J. S. Maki, S. C. Danos, and C. C. Remsen. 1985.
The retrieval of material from the surface microlayer with screen and plate samplers and its implications for partion-ing of material within the microlayer. Freshwater Biol. 15:15-19.
Falkowska, L. 1999a. Sea surface microlayer: a field evaluation of teflon plate, glass plate and screen sampling techniques. Part 1. Thickness of microlayer samples and relation to wind speed. Oceanologia 41:211-221.
———. 1999b. Sea surface microlayer: a field evaluation of teflon plate, glass plate and screen sampling techniques. Part 2. Dissolved and suspended matter. Oceanologia 41:223-240.
——— and A. Latala. 1995. Short-term variations in the con-centrations of suspended particles, chlorophyll a, and nutrients in the surface seawater layers of the Gdansk Deep. Oceanologia 37:249-284.
Fuhrman, J. A., and F. Azam. 1982. Thymidine incorporation as a measure of heterotrophic bacterioplankton production in a marine surface waters. Evaluation and field results. Mar. Biol. 66:109-120.
Garrett, W. D. 1965. Collection of slick-forming materials from the sea surface. Limnol. Oceanogr. 10:602-605. Grémare, A., and others. 2003. The effects of a strong winter
storm on physical and biological variables at a shelf site in the Mediterranean. Oceanol. Acta 26:407-419.
Haas, L. W. 1982. Improved fluorescence microscopy for
observing planktonic microorganisms. Ann. Inst. Oceanogr. 58:261-268.
Hardy, J. T. 1982. The sea surface microlayer: biology, chem-istry and anthropogenic enrichment. Prog. Oceanogr. 11:307-328.
———. 1997. Biological effects of chemicals in the sea-surface microlayer, p. 339-370. In P.S. Liss and R.A. Duce [eds.], The sea surface and global change. Cambridge University Press. ———, and C. W. Apts. 1984. The sea-surface microlayer: phy-toneuston productivity and effects of atmospheric particu-late matter. Mar. Biol. 82:293-300.
———, J. A. Coley, L. D. Antrim, and S. L. Kiesser. 1988. A hydrophobic large-volume sampler for collecting aquatic surface microlayers: characterization and comparison with glass plate method. Can. J. Fish. Aquat. Sci. 45:822-826. Harvey, G. W. 1966. Microlayer collection from the sea
sur-face: a new method and initial results. Limnol. Oceanogr. 11:608-614.
———, and L. A. Burzell. 1972. A simple microlayer method for small samples. Limnol. Oceanogr. 17:156-157.
Harvey, R. W., and L. Y. Young. 1980a. Enrichment and asso-ciation of bacteria and particulates in salt march surface waters. Appl. Environ. Microbiol. 39:894-899.
——— and ———. 1980b. Enumeration of particle-bound and unattached respiring bacteria in the salt marsh environ-ment. Appl. Environ. Microbiol. 40:156-160.
Hatcher, R. F., and B. C. Parker. 1974. Microbiological and chemical enrichment of freshwater-surface microlayers rel-ative to the bulk-subsurface water. Can. J. Microbiol. 20: 1051-1057.
Hermansson, M. 1990. The dynamics of dissolved and partic-ulate organic material in surface microlayers. In R. S. Wot-ton [ed.], The Biology of Particles in Aquatic Systems. CRC Press.
Hühnerfuss, H. 1981a. On the problem of sea surface film sampling: a comparison of 21 microlayer-, 2 multilayer-, and 4 selected subsurface- samplers. Part 1. Sonderdruck aus Meerestechnik 12:137-142.
———. 1981b. On the problem of sea surface film sampling: a comparison of 21 microlayer-, 2 multilayer-, and 4 selected subsurface- samplers. Part 2. Sonderdruck aus Meerestech-nik 12:170-173.
Kaltenbach, J. L. 1984. The view from the Shuttle-Orbier: observing the oceans from manned space flights. Proc. Int. Soc. Opt. Eng. (SPIE), 489, Ocean Optics VIII:203-207. Kjelleberg, S., T. A. Stenström, and G. Odham. 1979.
Compar-ative study of different hydrophobic devices for sampling lipid surface films and adherent microorganisms. Mar. Chem. 53:21-25.
Larsson, K., G. Odham, and A. Sodergren. 1974. On lipid sur-face films on the sea. I. A simple method for sampling and studies of composition. Mar. Chem. 2:49-57.
Lebaron, P., P. Servais, A. C. Baudoux, M. Bourrain, C. Courties, and N. Parthuisot. 2002. Variations of bacterial-specific
activity with cell size and nucleic acid content assessed by flow cytometry. Aquat. Microb. Ecol. 28:131-140.
Legendre, L., C. Courties, and M. Trousselier. 2001. Flow cytometry in oceanography 1989-1999 : environmental chal-lenges and research trends. Cytometry 44:164-172.
Liss, P. S., and R. A. Duce. 1997. The sea surface and global change. Cambridge University Press.
Marie, D., F. Partensky, S. Jacquet, and D. Vaulot. 1997. Enumer-ation and cell cycle analysis of natural populEnumer-ations of marine picoplankton by flow cytometry using the nucleic acid stain SYBR Green I. Appl. Environ. Microbiol. 63:188-193.
Marie, D., N. Simon, L. Guillou, F. Partensky, and D. Vaulot. 2000. Flow cytometry analysis of marine picoplankton, p. 421-454. In S. DeMaggio [ed.], Living color: Protocols in flow cytometry and cell sorting. Springer Verlag.
Marumo, R., N. Taga, and T. Nakai. 1971. Neustonic bacteria and phytoplankton in surface microlayers of the Equatorial waters. Bull. Plank. Soc. Japan 18:36-41.
Médernach, L., A. Grémare, J. M. Amouroux, J. C. Colomines, and G. Vétion. 2001. Temporal changes in the amino acid contents of particulate organic matter sedimenting in the Bay of Banyuls-sur-Mer (northwestern Mediterranean). Mar. Ecol. Prog. Ser. 214:55-65.
Naumann, E. 1917. Uber das neuston des Süsswassers. Biol. Centralblatt 37:98-106.
Neveux, J., and F. Lantoine. 1993. Spectrofluorometric assay of chlorophylls and phaeopigments using the least squares approximation technique. Deep-Sea Res. 40:1747-1764. Noble, R. T., and J. A. Fuhrman. 1998. Use of SYBR Green I for
rapid epifluorescence counts of marine viruses and bacteria. Aquat. Microb. Ecol. 14:113-118.
Norkrans, B. 1980. Surface microlayers in aquatic environ-ments, p. 51-83. In M. Alexander [ed.], Advances in Micro-bial Ecology. Plenum Press, New York and London.
Norkrans, B., and F. Sörensson. 1977. On the marine lipid sur-face microlayer-bacterial accumulation in models systems. Bot. Mar. 20:473-478.
Obernosterer, I., P. Catala, T. Rheinthaler, G. J. Herndl, and P. Lebaron. subm. Enhanced heterotrophic activity in the
sur-face microlayer of the Mediterranean Sea.
Romano, J. C. 1996. Sea-surface slick occurrence in the open sea (Mediterranean, Red Sea, Indian Ocean) in relation to wind speed. Deep-Sea Res. I 43:411-423.
Scherrer, B. 1984. Biostatistique. G. Morin.
Servais, P., E. O. Casamayor, C. Courties, P. Catala, N. Parthuisot, and P. Lebaron. 2003. Activity and diversity of bacterial cells with high and low nucleic acid content. Aquat. Microb. Ecol. 33:41-51.
Sewell, L. M., G. Bitton, and J. S. Bays. 1981. Evaluation of membrane adsorption-epifluorescence microscopy for the enumeration of bacteria in coastal surface films. Microb. Ecol. 7:365-369.
Sherr, E. B., D. A. Caron, and B. F. Sherr. 1994. Staining of het-erotrophic protists for visualisation via epifluorescence microscopy, p. 213-227. In J. J. Cole [ed.], Handbook of methods in aquatic microbial ecology. Lewis Publishers. Siegel, S., and N. J. J. Castellan. 1988. Non parametric statistics
for the behavioral sciences.
Simon, M., and F. Azam. 1989. Protein content and protein synthesis rates of planktonic marine bacteria. Mar. Ecol. Prog. Ser. 51:201-213.
Tsyban, A. V. 1971. Marine bacterioneuston. J. Oceanogr. Soc. Japan 27:56-66.
Welch, P. S. 1935. Limnology. Mc Graw Book.
Williams, P. M., and others 1986. Chemical and microbiologi-cal studies of sea-surface films in the Southern Gulf of Cal-ifornia and off the West Coast of Baja CalCal-ifornia. Mar. Chem. 19:17-98.
Zaitsev, Y. P. 1971. Marine neustonology. VA: National Marine Fisheries Service, NOAA and National Science Foundation, National Technical Information Service.
Zar, J. H. 1999. Biostatistical analysis. Prentice-Hall.
Zutic, V. B., E. Cosovic, E. Marcenko, and N. Biharu. 1981. Sur-factant production by marine phytoplankton. Mar. Chem. 10:505-520.
Submitted 13 January 2004 Revised 5 March 2004 Accepted 27 March 2004