HAL Id: hal-00317902
https://hal.archives-ouvertes.fr/hal-00317902
Submitted on 14 Oct 2005
HAL is a multi-disciplinary open access
archive for the deposit and dissemination of
sci-entific research documents, whether they are
pub-lished or not. The documents may come from
teaching and research institutions in France or
abroad, or from public or private research centers.
L’archive ouverte pluridisciplinaire HAL, est
destinée au dépôt et à la diffusion de documents
scientifiques de niveau recherche, publiés ou non,
émanant des établissements d’enseignement et de
recherche français ou étrangers, des laboratoires
publics ou privés.
Unusual strong quasi-monochromatic ground Pc5
geomagnetic pulsations in the recovery phase of
November 2003 superstorm
N. G. Kleimenova, O. V. Kozyreva, J. Manninen, A. Ranta
To cite this version:
N. G. Kleimenova, O. V. Kozyreva, J. Manninen, A. Ranta. Unusual strong quasi-monochromatic
ground Pc5 geomagnetic pulsations in the recovery phase of November 2003 superstorm. Annales
Geophysicae, European Geosciences Union, 2005, 23 (7), pp.2621-2634. �hal-00317902�
SRef-ID: 1432-0576/ag/2005-23-2621 © European Geosciences Union 2005
Annales
Geophysicae
Unusual strong quasi-monochromatic ground Pc5 geomagnetic
pulsations in the recovery phase of November 2003 superstorm
N. G. Kleimenova1, O. V. Kozyreva1, J. Manninen2, and A. Ranta21Institute of the Physics of the Earth RAS, B. Gruzinskaya 10, Moscow, 123995, Russia
2Sodankyl¨a Geophysical Observatory, T¨ahtel¨antie 62, FIN-99600 Sodankyl¨a, Finland
Received: 10 April 2005 – Revised: 24 June 2005 – Accepted: 22 July 2005 – Published: 14 October 2005
Abstract. Unusually large-amplitude morning Pc5 netic pulsations during the recovery phase of the huge mag-netic storm in November 2003 have been studied by using ground-based multi-point observations. Two main spectral Pc5 enhancements were observed: at f≈2 mHz, which fea-tured slowly increasing frequency with decreasing latitude, and at f≈3 mHz, which was latitude independent. The Pc5 pulsations were observed at wide range of latitudes (more
than 10◦) with the same very strong amplitude (up to 500 nT)
and with the same polarization. Only the 3-mHz peak was clearly seen in the spectra of pulsating auroral radio absorp-tion, as observed by the Finnish riometer chain. Short and localized bursts of PiB (f∼50–100 mHz) magnetic pulsations and simultaneous short bursts of energetic electron precipita-tion were observed in the morning sector, as well. The begin-ning of the large-amplitude morbegin-ning Pc5 activity occurred si-multaneously with a substorm onset in the evening and mid-night sectors. However, the spectra of pulsations in the morn-ing and evenmorn-ing sectors were different. They were compared with spectra of IMF and solar wind parameters, measured by ACE spacecraft. The similarity between the spectra of
morn-ing Pc5 and IMF By was found, but the spectra of evening
Pi3 pulsations were similar to the spectra of solar wind den-sity variations. The Pc5 and PiB pulsations, as well as bursts of the auroral radio absorption, suddenly disappeared, when the solar wind density abruptly dropped. We suppose that the
∼2-mHz Pc5 geomagnetic pulsations could be attributed to
field line resonance (FLR), however, the 3-mHz oscillations were apparently non-resonance origin.
Keywords. Magnetospheric physics (MHD waves and
in-stabilities; Solar wind-magnetosphere interaction; Storms and substorms)
1 Introduction
Several magnetic superstorms occurred in October–
November 2003 (see, e.g. the special issue of Geomagnetism
and Aeronomy, Vol. 45, No. 1, 2005). In late October
Correspondence to: N. G. Kleimenova (kleimen@ifz.ru)
there were two huge magnetic storms with Dst as great as
–400 nT. The storms were produced by extremely powerful solar flares. When the same active region on the Sun ap-peared one solar rotation later, a new coronal mass ejection (CME) toward the Earth occurred and as result, a huge geomagnetic storm developed on 20 November 2003 with
Dst=–465 nT.
The variations of the Dst-index on 20–21 November 2003,
as well as the IMF and solar wind data collected from the ACE spacecraft are shown in Fig. 1. The ACE was located
far upstream at the distance of ∼240 RE; the estimated time
lag for ground observations was about 50 min.
In the main phase of this storm (when the Earth was inside
the body of the magnetic cloud), the negative IMF Bz was
as strong as –45 nT and IMF B reached ∼60 nT. During the recovery phase of the storm, on 21 November at ∼03:00– 06:00 UT, several dense transients were detected by ACE, and at ∼06:00 UT the solar wind density suddenly dropped to a background level. On the ground a strong substorm was observed at about 05:40 UT, with the AE index more than 1500 nT.
During the recovery phase of this storm, unusually strong Pc5 geomagnetic pulsations appeared in the morning sector, when a sharp density enhancement in the solar wind arrived at the dayside magnetopause, at ∼03:00 UT. We focus here on the analysis of these magnetic pulsations and pulsating au-roral radio wave absorption, as a magnetospheric response to the abrupt density enhancement of solar wind in the recovery phase of a magnetic storm.
2 Data
We analysed the magnetic data collected from: (a) the
IM-AGE network of 21 magnetometer stations (8=54.4–76.1◦,
unfortunately, there were no data from BJN), (b) the SAM-NET magnetometer network at subauroral latitudes and (c) globally distributed INTERMAGNET magnetometer sta-tions (60 stasta-tions). We also analyzed data from the Finnish
∼30-MHz riometer (a relative ionospheric opacity meter,
which detects the presence of energetic particle precipitation) chain at 6 stations, usually completed by magnetometers:
2622 N. G. Kleimenova et al.: Pc5 geomagnetic pulsations
Fig. 1. Dstindex and IMF parameters from ACE (240, 22, –15 RE).
ABK, SOD, IVA, JYV (near IMAGE station HAN), OUL (near IMAGE station OUJ) and ROV (no magnetometer). We have also used here the imaging IRIS (38.2 MHz) riometer at KIL, which has 49 narrow beams. We used the sum of 9 central narrow beams of IRIS to estimate wide beam ri-ometer data. To study short period geomagnetic pulsations (f=50–100 mHz), we used the induction magnetometer data at the Finnish (OUL, ROV, SOD, IVA and KIL) stations. The locations of stations in the IMAGE, SAMNET, Finnish ri-ometer and pulsation magnetri-ometer arrays are shown in the Table 1.
3 Observations
3.1 The morning Pc5 magnetic pulsations and auroral
ab-sorption
According to IMAGE magnetometer data (Fig. 2) very intense Pc5 magnetic pulsations (peak-to-peak, up to 500–600 nT) were observed in the morning sector on 21 November. The wave activity suddenly started at ∼03:00 UT.
Near that time a dense, interplanetary transient (see Fig. 1) reached the magnetosphere. Figure 2 shows that the Pc5 pulsations occurred simultaneously in a wide latitude region
(8≈55–70◦). There was practically no pulsation activity in
the polar cap (LYR, NAL), and the pulsation intensity sharply
decreased at the latitudes <55◦(TAR). The pulsation activity
suddenly disappeared near 07:30 UT. At that time the sharp density depletion of solar wind reached the Earth’s magneto-sphere (Fig. 1).
The strongest magnetic pulsations were observed on 21 November, between 05:30 UT and 07:30 UT. The mag-netic X and Y components (not filtered data) and absorption data are shown in Fig. 3. There were three different bursts of long period pulsations: (1) the first one at 05:45–06:05 UT, (2) the second one at 06:05–06:50 UT, and (3) the third one at 07:00–07:30 UT. The behaviours of the oscillations were different, particularly at 05:40–06:00 UT, when the ampli-tude of the Y component strongly increased with latiampli-tude while the X component was practically latitude independent. After 06:00 UT the X component became twice stronger than the Y component, and increased with latitude while the
Table 1. The parameters of the IMAGE, SAMNET, Finnish riometer and pulsation magnetometers.
Satellite X Y Z
ACE 240 22 -15
abbrev name geogr. lat geogr. long CGM lat CGM long
NAL Ny Ålesund 78.79 11.95 76.07 112.25 LYR Longyearbyen 78.20 15.82 75.12 113.00 SOR Sørøya 70.54 22.22 67.24 106.71 TRO Tromsø 69.66 18.94 66.54 103.44 AND Andenes 69.30 16.03 66.36 100.92 MAS Masi 69.46 23.70 66.07 106.92 KIL Kilpisjärvi 69.02 20.79 65.78 104.31 LEK Leknes 68.13 13.54 65.35 98.31 ABK Abisko 68.35 18.82 65.04 103.31 IVA Ivalo 68.56 27.29 64.75 110.06 MUO Muonio 68.02 23.53 64.62 105.70 LOZ Lovozero 67.97 35.08 64.10 114.89 SOD Sodankylä 67.37 26.63 63.80 107.70 PEL Pello 66.90 24.08 63.46 105.38 RVK Rørvik 64.94 10.98 62.20 93.80 OUJ Oulujärvi 64.52 27.23 60.89 106.54 DOB Dombås 62.07 09.11 59.31 90.83 HAN Hankasalmi 62.30 26.65 58.62 104.99 UPS Uppsala 59.90 17.35 56.81 102.54 NUR Nurmijärvi 60.50 24.65 56.83 103.04 TAR Tartu 58.26 26.46 54.37 103.32 ROV Rovaniemi 66.78 25.94 62.90 107.00 OUL Oulu 65.08 25.90 61.50 106.00 JYV Jyväskylä 62.42 25.28 58.50 104.20 IRIS Kilpisjärvi 69.05 20.79 65.78 104.31 BRW Barrow 71.40 203.70 69.71 250.08 FCC Fort Churchill 58.80 265.90 69.80 329.00 BLC Baker Lake 64.30 264.00 74.18 326.45 GDH Godhavn 69.25 306.47 77.29 41.40 HRN Hornsund 77.00 15.60 74.03 110.84
Y component showed a maximum near 64–65◦(SOD-IVA).
In the third Pc5 burst (07:00–07:30 UT) the amplitude of the X and Y components became approximately the same. Also, at the same time a strong decrease in electron precipitation (riometer absorption) was observed at all latitudes (Fig. 3, bottom panel).
The second Pc5 magnetic pulsation burst was accompa-nied by a simultaneous enhancement of pulsating absorption from OUL to ABK, where the strongest value 4 dB was ob-served at ROV (Fig. 3, bottom panel).
3.2 The spectral analysis
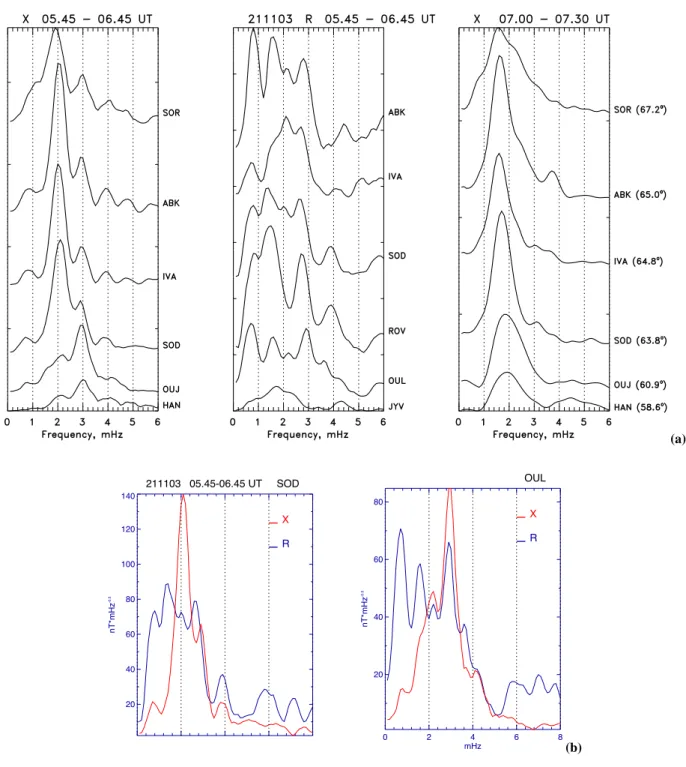
The Fourier amplitude spectra of magnetometer and riome-ter data are shown in Fig. 4 for two time inriome-tervals: 05:45– 06:45 UT and 07:00–07:30 UT. In the first interval there were two main enhancements in the spectra of magnetic pulsation: the first at 2 mHz and the second at 3 mHz. The lower (2 mHz) maximum was observed only at high-latitude stations (SOD–SOR), with the maximum amplitude
at 8=64–65◦and with the peak frequency increasing slowly
from 1.9 mHz at SOR to 2.1 mHz at SOD. The higher fre-quency (2.8–2.9 mHz) enhancement was seen in a large
lati-tude area (8≈58–67◦). The maximum occurred at OUJ.
The spectra of pulsations of the auroral radio absorp-tion (Fig. 4a, in the middle) were more complicated. No strong enhancements were observed at ∼2 mHz. One com-mon maximum was observed at 1.4–1.6 mHz. The frequency
of the second maximum increased from 2.5–2.6 mHz at SOD–IVA to 2.7–2.9 mHz at ROV-OUL. We have compared these spectra with the spectra of magnetic Pc5 pulsations at SOD and OUL (Fig. 4b). The spectra of magnetic pulsa-tions (red line) and oscillapulsa-tions in precipitation (blue line) at OUL were relative similar (except the 1.4–1.6 mHz peak in absorption) and showed a common main peak at ∼3 mHz. However, at SOD the main peak in the spectrum of magnetic pulsation at ∼2 mHz was not accompanied by a significant enhancement in precipitation.
The spectra of magnetic pulsations at 07:00–07:30 UT (Fig. 4a, right panel) reveal that these pulsations were rather monochromatic, with one maximum shifted from 1.6 mHz at SOR to 1.9 mHz at HAN. The maximum amplitude occurred
at 8≈64–65◦(SOD–ABK) likewise, as in the previous time
interval. These magnetic pulsations were accompanied by a strong decrease in the auroral radio absorption (Fig. 3).
The dynamic spectra of the Pc5 pulsations in the morning sector (Fig. 5) show that the pulsations started first at higher frequencies (2.7–3.2 mHz). The waves occurred
simultane-ously in a wide range of geomagnetic latitudes (58–65◦) with
maximum amplitude at OUJ. About 15 min later the max-imum intensity of pulsations shifted into lower frequencies (1.7–2.3 mHz). The burst of pulsations with similar ampli-tude and duration was observed from SOD to ABK.
The phase delay of the 3-mHz pulsations was about
2624 N. G. Kleimenova et al.: Pc5 geomagnetic pulsations
Fig. 2. IMAGE magnetometer data (X component) during the recovery phase of the magnetic storm on 20–21 November 2003. The codes of the stations and their corrected geomagnetic latitudes indicated are on the right side.
90–100 s between SOD and SOR (18=3.4◦). Waves
propagated from OUJ to the higher latitudes, with an ap-parent horizontal speed of 3.5–4.0 km/s. As a result, the 3-mHz pulsations at SOR became approximately anti-phase with pulsations at OUJ. However, there were no phase delays between the stations at lower latitudes (HAN, NUR, UPS). At these stations the waves were approximately in phase. The 2-mHz magnetic pulsations also propagated from lower (SOD) to higher latitudes with the similar phase speed. The azimuthal wave number (m) estimated by comparing data
from the easternmost (LOZ, 3=114.9◦) and the westernmost
(LEK, 3=98.3◦) IMAGE stations was about 2 for both
fre-quencies.
The rotation of the polarization vector of 1.7–2.3 mHz waves, as well as 2.7–3.2 mHz waves, were counterclock-wise at all stations where the Pc5 wave was observed. The polarization reversal was observed across the equatorial boundary (HAN) of this area.
3.3 The PiB magnetic pulsations and auroral absorption
We have also analyzed the data collected from the induction magnetometers at six Finnish stations (NUR, OUL, ROV, SOD, IVA and KIL). The dynamic power spectra (in arbitrary units) of these shorter period magnetic pulsations (f=50– 100 mHz) are presented in Fig. 6. The top panel in Fig. 6 shows the unfiltered magnetic Pc5 pulsations at SOD. The absorption data at a given station is shown by a solid black line. Because of the lack of wide beam riometer data at KIL, we used as wide beam values a sum of 9 central nar-row beams from IRIS.
The strongest magnetic Pi pulsations were observed at the
frequencies less than 70–80 mHz. The pulsations looked
like short bursts and they can be attributed to PiB type (Heacock, 1967). The PiB pulsations at all stations except SOD suddenly disappeared from 06:00–06:15 UT. There was no precipitation before 05:55 UT, when strong PiB pulsations
Fig. 3. The X and Y components of magnetic field variations and riometer data (bottom) at the selected Finnish stations in the time interval 04:00–08:00 UT on 21 November 2003.
were observed. However, at 05:55-06:15 UT an
enhance-ment in precipitation was observed at all stations. After
06:00 UT practically each burst of PiB pulsations had a one-to-one correspondence to the absorption peaks. The best cor-relation between the PiB and precipitation was observed at SOD, where the strongest PiB pulsations occurred. The PiB pulsations at all stations, as well as the bursts of auroral radio absorption, suddenly decreased at about 07:00 UT, when the solar wind density abruptly dropped.
To examine the dynamics of the regions of the auroral absorption, we used data from the IRIS imaging riometer
located at KIL (geographic latitude 69◦). Details of the
imaging riometer and of the data processing technique are given by Detrick and Rosenberg (1990). The field-of-view of this instrument is about 250×250 km at 90 km altitude. The absorption keogram (geographic latitude – UT), shown in Fig. 7, and the bottom panel of Fig. 3, indicate that the ab-sorption before ∼06:00 UT was not as intense as it was after-ward. Five well-defined absorption bursts, marked in Fig. 7 by a red number, were compared with PiB dynamic spectra in Fig. 6. Each of them (vertical arrows with numbers in Fig. 6) has a one-to-one correspondence to PiB bursts at KIL and the peaks in riometer data. The first precipitation burst (at 06:07–06:09 UT) and the second (at 06:16–06:17 UT) occurred south of KIL, as well as the most intense PiB pul-sations. The strongest absorption burst, observed at 06:40– 06:43 UT, also started south of KIL and shifted very quickly to the zenith. We may conclude that the bursts of PiB mag-netic pulsations show similar spatial and temporal dynamics as the bursts of particle precipitations.
3.4 The morning Pc5 pulsations and night side substorm
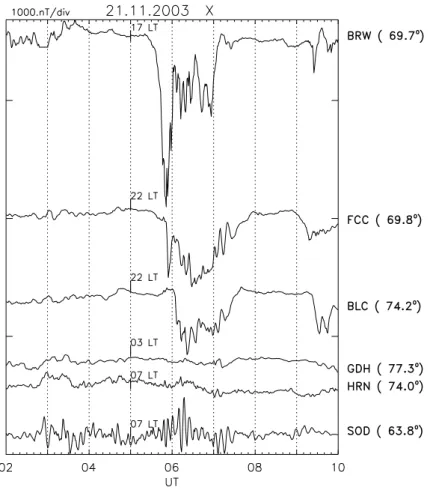
The AE index (not shown here) indicates that a short, strong substorm (AL=–1400 nT and AU=200 nT) suddenly started at 05:40 UT. The magnetic data in Fig. 8 from BRW, which was located in the evening sector (18:00–20:00 MLT), and FCC and BLC, which were located near local midnight (22:00–24:00 UT), also confirm the substorm development. The second substorm activation started a half an hour later (at 06:05 UT), near midnight (BLC). There was no signifi-cant activity at polar latitudes in Greenland (GDH) and Sval-bard (HRN). The SOD data in Fig. 8 shows Pc5 pulsations in the morning sector. One can see that the bursts of the Pc5 pulsations in the morning sector started simultaneously with substorm activations in the evening side. The obtained results confirm the earlier studies by Afanasyeva (1978) and Rostoker et al. (1984), who found that morning Pc5 magnetic pulsation activity increases with a substorm onset in the night sector.
The spectra of simultaneous morning Pc5 and evening Pi3 magnetic pulsations were different (Fig. 9), as it was pre-viously found by Pilipenko et al. (1997). The main peaks at 2 mHz and 3 mHz observed in the spectra of the morning Pc5 magnetic pulsations (SOD, OUJ, Fig. 9, left panel) coincided with the clearly defined minima in the spectra of evening Pi3 magnetic pulsations (BRW, CMO, Fig. 9, right panel).
3.5 The comparison of the spectra of morning and evening
magnetic pulsations with the spectra of IMF and solar wind density
We also compared the spectra of magnetic pulsations in the morning and evening sectors with the corresponding oscillations in IMF and solar wind density (Fig. 9). We found
2626 N. G. Kleimenova et al.: Pc5 geomagnetic pulsations Fig. 4a (a) 0 2 4mH z 6 8 20 40 60 80 100 120 140 nT*mHz -0.5 R X 211103 05.45-06.45 UT SOD 0 2 4 6 8 mHz 20 40 60 80 nT*mHz -0.5 R X OUL Fig. 4b 0 2 4mH z 6 8 20 40 60 80 100 120 140 nT*mHz -0.5 R X 211103 05.45-06.45 UT SOD 0 2 4 6 8 mHz 20 40 60 80 nT*mHz -0.5 R X OUL Fig. 4b (b)
Fig. 4. (a) Fourier spectra of the X component of magnetic field variations and radio absorption (arbitrary units) at stations shown in Fig. 3 for the time intervals 05:45–06:45 UT and spectra of the X component in 07:00-07:30 UT; (b) comparison the spectra of Pc5 magnetic (red line) and absorption (blue line) pulsations at OUL and SOD.
wind (ACE spacecraft, X=240 RE matched with the spectra
of the morning Pc5 pulsations and showed enhancements at
∼2 mHz and ∼3 mHz (Fig. 9, left panel). However, the main
maximum (∼2.4–2.5 mHz) in the spectra of density varia-tions of solar wind fits with the maximum in the spectra of the evening pulsations (Fig. 9, right panel). This indicates that the nightside magnetosphere is remarkably sensitive to density oscillations of solar wind.
3.6 Global distribution of Pc5 magnetic activity
The distribution of global pulsation activity (8-MLT plots) was computed for three time intervals, 05:30–06:00 UT, 06:00-06:30 UT and 07:00-07:30 UT, based on magnetic data from 64 ground stations, Fig. 10. The frequency band corresponds to the main enhancement in the wave spectra in the given time interval shown in Fig. 5.
Fig. 5 Fig. 5. Dynamic amplitude spectra of Pc5 pulsations (nT/mHz0.5)observed at selected IMAGE stations.
The strongest pulsations are seen in the morning sector. In the first time interval the main intensity of the 2.7–3.2 mHz pulsations (Fig. 10, upper panel) was concentrated in a
con-siderably narrow latitude range (8≈61–63◦). But the strong
1.7–2.3-mHz pulsations in the second time interval (Fig. 10,
middle panel) appeared in a much wider area (8≈60–70◦).
The maps indicate a sharp equatorial boundary shifting to
higher latitudes, from HAN (8≈58◦) to OUJ (8≈61◦). The
morning pulsations in the two first intervals were accompa-nied by magnetic pulsation activity at auroral latitudes in the evening sector. The strong decrease of Pc5 pulsations inten-sity at the midnight sector (Fig. 10) is consistent with the results obtained by Hudson et al. (2004). They concluded that this was due to a clear absence of fundamental toroidal mode power near midnight. In the third interval (Fig. 10, bot-tom panel) strong nighttime pulsations were observed near
midnight and only at the geomagnetic latitude at around 70◦;
the evening sector was relatively undisturbed.
3.7 The summary of the observed results
The observed features of magnetic Pc5 pulsations in the morning sector in the recovery phase of the November 2003 superstorm can be summarized as follows: (1) their ampli-tudes were unusually strong, several times stronger than typ-ical values; (2) they occurred at unusually large latitude area
(more than 10◦) with the same strong amplitude and
polar-ization; (3) the sense of polarization reversed across a sharp low-latitude boundary of Pc5 occurrence; (4) the spectral peak frequency at 3 mHz did not change with latitude, how-ever, the spectral peak frequency at 2 mHz slowly increased with decreasing latitude; (5) only the second Pc5 burst was accompanied by a pulsating enhancement in auroral radio absorption, with a common spectral maximum near 3 mHz; (6) Pc5 pulsation activity started suddenly, simultaneously with an impulsive enhancement of solar wind density and the wave disappeared when a sharp density depletion of
2628 N. G. Kleimenova et al.: Pc5 geomagnetic pulsations 05:30 06:30 07:30 UT 50 60 70 80 90 100 mHz 05:30 06:30 07:30 UT 50 60 70 80 90 100 mHz OUL (61.5O ) 50 60 70 80 90 100 m H z 50 60 70 80 90 100 m H z ROV (62.9 O ) 50 60 70 80 90 100 m H z 50 60 70 80 90 100 m H z SOD (63.8 O) 50 60 70 80 90 100 m H z 50 60 70 80 90 100 m H z IVA (64.8 O) 50 60 70 80 90 100 m H z 50 60 70 80 90 100 m H z 4.0 8.0 KIL (65.8O) 05:30 0 6: 30UT 07 :30 0 1 2 3 4 dB 05:30 06:30UT 07:30 0 1 2 3 4 dB 05:30 06:30UT 07:30 0 1 2 3 4 dB 05:30 06:30UT 07:30 0 1 2 3 4 dB 05:30 06:30UT 07:30 0 1 2 3 4 dB 05:30 06:30 07:30 UT -100 0 100 200 300 nT SOD( 63.8O) 211103 X 100. nT 1 2 3 4 5 Fig. 6
Fig. 6. The dynamic power spectra of Pi1 type short period (f=50–100 mHz) magnetic pulsations (in arbitrary units), collected from five Finnish stations, in comparison with riometer data (black lines) and Pc5 pulsations. The arrows with numbers indicate that the short bursts of Pi1 coincided with the absorption peaks (see Fig. 7).
solar wind reached the Earth’s magnetosphere; (7) the spec-tra of Pc5 pulsations in the morning sector did not fit with the spectra of the solar wind density variations but showed
some similarity with spectra of IMF By; however, the
spec-tra of evening-midnight side pulsations showed some simi-larity with the spectra of solar wind density; (8) the strongest Pc5 bursts in the morning sector started simultaneously with substorm activations in the evening side, but the spectra of pulsations in the morning and evening sectors were different.
4 Discussion
Numerous ground and satellite observations (e.g. Oberts and Raspopov, 1968; Gupta, 1975; Ziesolleck and McDiarmid, 1995; Engebretson et al., 1998; Nos´e et al., 1998; Baker et al., 2003; Posch et al., 2003 and many others) show that classical Pc5 magnetic pulsations typically have a peak oc-currence at the dawn sector of the magnetosphere. Usually, these waves are attributed to a toroidal wave of fundamen-tal mode of field line resonance (FLR), which dominates on
the dawn side. There are two principally different ways for coupling the solar wind energy into Pc5 range pulsations ob-served on the ground: (1) the fast solar wind streams lead to an enhanced Kelvin-Helmholtz instability on the flanks of the magnetosphere, mainly on the dawn flank and that arouses enhanced ULF waves inside the magnetosphere through sur-face mode (e.g. Miura, 1992) or by cavity/waveguide modes (e.g. Samson et al., 1992; Mann et al., 1999); (2) fluctuations in the solar wind can directly drive ULF waves in the magne-tosphere (Kepko et al., 2002; Stephenson and Walker, 2002) or lead to an enhanced excitation of the field line resonance or cavity/waveguide magnetospheric waves.
The strong morning Pc5 pulsations discussed in this pa-per can be attributed to FLR exited by high solar wind speed (∼550 km/s). However, the observed maxima at ∼2 mHz and ∼3 mHz in the spectra of ULF waves do not fit with the known multiple, discrete FLR frequencies of 1.3, 1.9, 2.6 and 3.4 mHz (e.g. Samson et al., 1992). Only the 2-mHz peak may be clearly attributed to a 1.9-2-mHz FLR peak. Moreover, the frequency of the 2-mHz peak slowly increased
Fig. 7
Fig. 7. IRIS absorption keogram (05:30–07:30 UT) in geographic coordinates; the red numbers show the strong electron precipitation bursts.
with decreasing latitude, while the 3-mHz peak was latitude independent. The similar strong daytime Pc5 pulsations with latitude independent frequency maximum near 3 mHz were observed at a wide latitude region in the recovery phase of another huge magnetic storm on 31 October 2003 (Kleimen-ova and Kozyreva, 2005).
The very strong burst of 2-mHz pulsations observed at 06:05–06:40 UT (Fig. 3) was most pronounced in the X com-ponent, which was much larger than the Y component. This fits with the FLR criteria. On the contrary, the X-component of the 3-mHz pulsations (05:40–06:05 UT) was of the same order or less than the Y component, which increased with increasing latitude.
One of the main properties of FLR, observed on the ground, is a rapid phase variation across the latitude,
corresponding to a resonant L-shell (maximum of the X-component amplitude) and a reversal of the sense of polar-ization. But this was not observed in the discussed event. At all IMAGE stations from OUJ to SOR, where strong Pc5 pul-sations were observed, the polarization of the waves both at
∼2 mHz and at ∼3 mHz, was counterclockwise.
Radar (Walker et al., 1992) and satellite (e.g. Mitchell et al., 1990) observations have shown that equatorial resonance
width of FLR can be as small as 0.5 RE. Glassmeier and
Stellmacher (2000) estimated that the radial resonant width
is between 0.1 RE and 0.28 RE in the equatorial plane of
the magnetosphere or on the order of 50–150 km at the
ionospheric level. The wave transmission through the
ionosphere and atmosphere to the ground provides some modifications of the FLR structure. The main effect consists
2630 N. G. Kleimenova et al.: Pc5 geomagnetic pulsations
Fig. 8. The comparison of the morning Pc5 pulsation (SOD) occurrence with the substorm activity in the evening (BRW, FCC, and BLC) and morning polar cap (HRN, GDH) magnetic data.
of a smoothing of the amplitude and phase variations through the resonant region (Poulter and Allan, 1985). The large latitudinal dimension of the respective FLR signal observed on the ground with the amplitudes above half of the maxi-mum can reach about 400 km (see Fig. 3 by Glassmeier and Stellmacher, 2000). In the considered event on 21 November 2003 the area of the equally strong amplitude of Pc5 with the same polarization was three times of that as large .
• Thus, it is difficult to explain the observed Pc5
pulsa-tions in terms of FLR.
In the morning sector we observed the strong Pc5 pulsa-tions at lower latitudes (L-values ∼4–6) than they typically occur, at L≈6–8 (e.g. Glassmeier and Stellmacher, 2000; Hudson et al., 2004). This could be a result of their occur-rence during the recovery phase of a huge magnetic storm, when the magnetosphere was considerably compressed, and the Pc5 source was located at lower L shells than under ordi-nary conditions. During this time the auroral oval might be greatly expanded, and according to Rostoker and Lam (1978) and Lam and Rostoker (1978), the source of Pc5 activity is co-located with the auroral oval.
A sudden change in the solar wind dynamic pressure may produce a mechanism for the excitation of cavity mode waves in the magnetosphere (e.g. Allan et al., 1986; Lee and Lysak, 1989). Standing Alfv´en wave frequencies (FLR) matching that of the cavity mode eigenfrequencies may be excited (Goldstein et al., 1999). A similar result was published re-cently by Hudson et al. (2004) based on CRRES magnetic field data. Our results confirm that the dynamic pressure en-hancement in solar wind may lead to Pc5 excitation in the dayside magnetosphere.
The Pc5 activity, as well as auroral radio absorption, dis-appeared at ∼07:00 UT simultaneously, with the abrupt drop in solar wind density measured by ACE at 06:17 UT. So, when the external driver stopped, the FLR oscillation in the magnetosphere also stopped immediately. However, after 07:00 UT a strong monochromatic Pc5 wave packet (Figs. 2– 4) appeared in the morning side, with the peak frequency increasing from ∼1.6 mHz to ∼1.9 mHz and with the same counter-clockwise polarization. The Pc5 burst was accom-panied by a decrease in particle precipitation, as observed by riometers. The source of these Pc5 pulsations is still un-known.
We confirm the previous studies (Afanasyeva, 1978; Ros-toker et al., 1984), which showed that the morning Pc5
magnetic pulsation activity increases with a substorm on-set in the night sector. We found that each Pc5 wave packet started simultaneously with an onset of a substorm activation in the evening sector. We suppose that a substorm onset and the arising morning Pc5 magnetic pulsations are caused by a common source – a sharp increase in the solar wind dynamic pressure.
According to Lee and Lyons (2004), enhancements in the solar wind dynamic pressure, which occur under northward IMF, generally lead to magnetic compression on the dayside and a depression near local midnight. If it occurred under southward IMF, they still observed magnetic field compres-sion on the dayside, but on the nightside they found a typical magnetic dipolization signature of a substorm.
In the discussed event the morning Pc5 activity suddenly started at ∼03:00 UT in association with a strong impulsive enhancement in solar wind density at ∼02:10 UT under
pos-itive IMF Bz(Fig. 1). No substorm activity was observed on
the ground.
After southward turning IMF a strong substorm started at ∼05:40 UT (simultaneously with sharp morning Pc5 en-hancement) and ACE observed several peaks in solar wind density near 05:05 UT. We suppose that the substorm onset and the morning Pc5 pulsation amplification were caused by a common source – an enhancement of solar wind dynamic pressure under southward IMF. The main pulsation activity in the evening and morning sectors began practically simul-taneously but with different spectra. Some similarity in the spectra of the evening/night side magnetic pulsations and so-lar wind density variations suggests that the magnetic waves in the nightside associated with a substorm are remarkably sensitive to variations in the solar wind density.
Several authors (e.g. Kepko et al., 2002; Stephenson and Walker, 2002; Kessel et al., 2004) have found that ground Pc5 magnetic pulsations can be directly driven by pressure variations of solar wind. However, this was not the case in the discussed magnetic storm. In the studied case the morning Pc5 pulsation spectra clearly do not agree in frequency with the solar wind pressure variations (Fig. 9).
• Certainly, the excitation of morning Pc5 pulsations
was associated with abrupt enhancements of the solar wind dynamic pressure, but the waves were not directly driven by density oscillations.
A number of observational and theoretical studies have been made on the modulation of particle flux by Pc5 pul-sations (e.g. Kokubun et al., 1977; Higuchi et al., 1988; Kleimenova et al., 1997; Nos´e et al., 1998). The riometer data on 21 November 2003 showed that only the Pc5 pulsa-tions in the interval of 06:00–07:00 UT were accompanied by pulsating electron precipitation. Coroniti and Kennel (1970) have explained the generation mechanism of pulsations in the energetic electron precipitation through a modulation of the precipitation rate with a wave-particle interaction, which is modulated by compressional ULF waves. This interaction takes place in the equatorial plane of the magnetosphere. In
Fig. 9 Fig. 9. The comparison of the Fourier spectra of ACE (upper
pan-els) data for 05:45–06:45 UT: Bx(blue) and By(red) of IMF data
and solar wind density (black), with the spectra of the ground data (bottom panels): X component of morning Pc5 pulsations at SOD (red) and OUJ (blue), and evening Pi3 pulsations at BRW (red) and CMO (blue).
this case there should be a phase delay between magnetic pul-sations and pulsating electron precipitation, due to the differ-ence in travel time of electrons and magnetic waves. Depend-ing on the plasma properties and the L-distance, one would expect this time difference to be of the order of 1 min.
Our analysis shows that the precipitation pulsations (ri-ometer measurements) are leading the magnetic ones for
∼40 s at SOD and IVA. This delay was less in OUL, where
the spectra of magnetic and precipitation pulsations were co-inciding (Fig. 4b). This fact can be interpreted to imply that the location of the source of the electron precipitation was not
far from OUL, probably near 63◦(ROV), where the strongest
radio wave absorption was measured (Figs. 3a and 4a). We compared the phase of the precipitation pulsations at the stations located at different longitudes along similar
lat-itudes ∼64–65◦: ABK (3=103.0◦), SOD (3=107.7◦) and
IVA (3=110.1◦), and found that the precipitation pulsations
filtered in the frequency band of 2.7–3.2 mHz propagated from SOD, both to the east (IVA) and to the west (ABK).
According to the theory of Coroniti and Kennel (1970), the ULF waves, which are responsible for the modulation of par-ticle precipitation, should have a strong compressional com-ponent in the equatorial plane of the magnetosphere. How-ever, in the equatorial plane of the magnetosphere the FLR waves are associated with toroidal azimuthally polarized os-cillations, which cannot strongly change the pitch angle of
2632 N. G. Kleimenova et al.: Pc5 geomagnetic pulsations -5 0 5 10 50 55 60 65 70 75 80 LATITUDE 08 08 08 17 17 17 25 25 25 34 34 34 42 42 42 51 59 16 18 20 22 00 02 04 06 08 10 12 HRN ABK BFE BLC BRW CBB CMO ESK FCC FRD GDH HLP IQA LER LOV MEA NAQ NEW NUR OTT PBQ SIT SOD STJ VIC WNG YKC NAL LYR TRO AND LEKABK LOZ SOR MAS KIL IVA MUO PEL RVK OUJ HAN DOB UPS TARBOR FAR CRK HLL YOR 05.30 - 06.00 UT 2.7 - 3.2 mHz
21.11.2003
-5 0 5 10 50 55 60 65 70 75 80 LATITUDE 08 08 08 17 17 17 25 25 25 34 34 42 42 51 51 59 68 16 18 20 22 00 02 04 06 08 10 12 HRN 20. 40. 60. ABK 20. 40. 60. BFE 20. 40. 60. BLC 20. 40. 60. BRW 20. 40. 60. CBB 20. 40. 60. CMO 20. 40. 60. ESK 20. 40. 60. FCC 20. 40. 60. FRD 20. 40. 60. GDH 20. 40. 60. HLP 20. 40. 60. IQA 20. 40. 60. LER 20. 40. 60. LOV 20. 40. 60. MEA 20. 40. 60. NAQ 20. 40. 60. NEW 20. 40. 60. NUR 20. 40. 60. OTT 20. 40. 60. PBQ 20. 40. 60. SIT 20. 40. 60. SOD 20. 40. 60. STJ 20. 40. 60. VIC 20. 40. 60. WNG 20. 40. 60. YKC 20. 40. 60. NAL 20. 40. 60. LYR 20. 40. 60. TRO 20. 40. 60. AND 20. 40. 60. LEK 20. 40. 60. ABK 20. 40. 60. LOZ 20. 40. 60. SOR 20. 40. 60. MAS 20. 40. 60. KIL 20. 40. 60. IVA 20. 40. 60. MUO 20. 40. 60. PEL 20. 40. 60. RVK 20. 40. 60. OUJ 20. 40. 60. HAN 20. 40. 60. DOB 20. 40. 60. UPS 20. 40. 60. TAR 20. 40. 60. BOR 20. 40. 60. FAR 20. 40. 60. CRK 20. 40. 60. HLL 20. 40. 60. YOR 20. 40. 60. 06.00 - 06.30 UT 1.7 - 2.3 mHz -5 0 5 10 50 55 60 65 70 75 80 LATITUDE 08 08 17 17 17 25 25 25 34 34 42 51 59 16 18 20 22 00 02 04 06 08 10 12 MLT HRN ABK BFE BLC BRW CBB CMO ESK FCC FRD GDH HLP IQA LER LOV MEA NAQ NEW NUR OTT PBQ SIT SOD STJ VIC WNG YKC NAL LYR TRO AND LEKABK LOZ SOR MAS KIL IVA MUO PEL RVK OUJ HAN DOB UPS TARBOR FAR CRK HLL YOR 07.00 - 07.30 UT 1.5 - 2.0 mHz Fig. 10Fig. 10. Distribution maps (8-MLT diagram) of Pc5 magnetic pulsations calculated for three time intervals (indicated on the top of each map) on 21 November 2003 by using the data from 64 ground stations located at the geomagnetic latitudes 8=50–80◦.
the trapped particles. In the spectra of pulsating absorption we did not see the typical features of a magnetospheric FLR frequency at 2 mHz, but there was a maximum at 3 mHz. We suppose that, in particular, the 3-mHz ULF waves, which did not show the FLR properties, had a significant compressional component in the equatorial plane of the magnetosphere. The similar results were obtained earlier by Kleimenova et
al. (1997), who found, that in the morning sector at auroral latitudes the pulsations in the magnetic field and in the pre-cipitation were correlated at f >2 mHz and non-correlated at f<2 mHz. We may split the studied morning Pc5 pulsations into two subclasses: FLRs at frequency 2 mHz and non-FLRs at frequency 3 mHz.
5 Summary
During the recovery phase of the huge magnetic storm in November 2003, very strong magnetic pulsations in the Pc5 range were observed in the morning sector.
1. Two main spectral maxima were observed: the first at f≈2 mHz, which slowly increased with decreasing lati-tude and showed some similarity to the FLR properties, and the second at f≈3 mHz, which was latitude inde-pendent and could not be attributed to FLR.
2. The observed morning Pc5 pulsations were not directly driven by solar wind pressure oscillations.
3. The beginning of the large-amplitude morning Pc5 ac-tivity was accompanied by a substorm onset in the evening/midnight sector and an impulsive enhancement of solar wind dynamic pressure. However, the spectra of simultaneously observed ULF waves in the morn-ing (Pc5) and evenmorn-ing (Pi3) sectors were different. We suppose that they have the common energy source, but different generation mechanisms.
Acknowledgements. The IMAGE magnetometer data used in this
paper were collected as part of German-Finnish-Norwegian-Polish cooperation presently headed by the Finnish Meteorological In-stitute. The authors thank the SAMNET and INTERMAGNET teams for magnetometer data. The authors thank R. Lepping and K. Ogilve at NASA/GSFC and CDAWeb for providing WIND data and D. J. McComas at SWRI and CDAWeb for provid-ing ACE data. The data, originated from the Imaging Riome-ter for Ionospheric Studies (IRIS), are operated by the Depart-ment of Communications Systems at Lancaster University (UK) in collaboration with the Sodankyl¨a Geophysical Observatory, and funded by the Particle Physics and Astronomy Research Council (PPARC). N. Kleimenova and O. Kozyreva thank Sodankyla Geo-physical Observatory for the support during their stay at the Obser-vatory.
Topical Editor T. Pulkkinen thanks M. Engebretson and K. Yumoto for their help in evaluating this paper.
References
Afanasyeva, L. T.: Space-time distribution of geomagnetic pulsa-tions and its dependence on the geomagnetic activity, Acta Geod. Geophys. Mont. Acad. Sci., Hungary, 13(1–2), 239–271, 1978. Allan, W., White, S. P., and Poulter, E. M.: Impulse-excited
hydro-magnetic cavity and field-line resonances in the magnetosphere, Planet. Space Sci., 34 (4), 371–378, 1986.
Baker, G. J., Donovan, E. F., and Jackel, B. J.: A comprehensive survey of auroral latitude Pc5 pulsation characteristics, J. Geo-phys. Res., 108, A101384, doi:10.1029/2002JA009801, 2003. Coroniti, F.V. and Kennel, C.F.: Electron precipitation pulsations, J.
Geophys. Res., 75, 1279–1289, 1970.
Detrick, D. L. and Rosenberg, T. J.: A phased-array radiowave im-ager for studies of cosmic noise absorption, Radio Sci., 25, 325– 338, 1990.
Engebretson, M. J., Glassmeier, K.-H., Stellmacher, M., Hughes W. J., and L¨uhr, H.: The dependence of high-latitude Pc5 power on
solar wind velocity and phase of high-speed solar wind streams, J. Geophys. Res., 103, 26 271–26 283, 1998.
Geomagnetism and Aeronomy: special issue, Vol. 45, No. 1, 2005. Glassmeier, K.-H. and Stellmacher, M.: Concerning the local time asymmetry of Pc-5 wave power at the ground and field line reso-nance widths, J. Geophys. Res., 105, 18 847–18 855, 2000. Goldstein, J., Hudson, M. K., and Lotko, W.: Possible evidence
of damped cavity mode oscillations stimulated by the January, 1997 magnetic cloud event, Geophys. Res. Lett., 26, 3589–3593, 1999.
Gupta, J. C.: Some characteristics of large amplitude Pc5 pulsa-tions, Austral. J. Phys., 29, 67–87, 1975.
Heacock, R. R.: Two subtypes of Pi micropulsations, J. Geophys. Res., 72, 3905–3917, 1967.
Higuchi, Y., Shibuya, S., and Sato, N.: CNA pulsations accompa-nying hydromagnetic waves at conjugate stations, Planet. Space Sci., 36, 1255–1267, 1988.
Hudson, M. K., Denton, R. E., Lessard, M. R., Miftakhova, E. G., and Anderson, R. R.: A study of Pc-5 ULF oscillations, Ann. Geophys., 22, 289–302, 2004,
SRef-ID: 1432-0576/ag/2004-22-289.
Kepko, L., Spence, H. E., and Singer, H. J.: ULF waves in the solar wind as direct drivers of magnetospherc pulsatios, Geophys. Res. Lett., 29, No. 8, doi:10.1029/2001GL014405, 2002.
Kessel, R. L., Mann, I. R., Fung, S. F., Milling, D. K., and O0Connell, N.: Correlation of Pc5 wave power inside the mag-netosphere during high speed streams, Ann. Geophys., 22, 629– 641, 2004,
SRef-ID: 1432-0576/ag/2004-22-629.
Kleimenova, N. G., Kozyreva, O. V., and Ranta, H.: Pc5 pulsations in geomagnetic field and riometers absorption in the morning sector of auroral latitudes, Geomagnetism and Aeronomy (En-glish translation), 37 (5), 552–578, 1997.
Kleimenova, N. G. and Kozyreva, O. V.: Spatial-temporal dynam-ics of Pi3 and Pc5 geomagnetic pulsations during the extreme magnetic storms in October 2003, Geomagnetism and Aeronomy (English translation), 45, 71–79, 2005.
Kokubun, S., Kivelson, M. G., McPherron, R. I., Russell, C. T., and West Jr., H. I.: Ogo 5 observations of Pc5 waves: Particle flux modulations, J. Geophys. Res., 82, 2774–2786, 1977.
Lam, H.-L. and Rostoker, G.: The relationship of Pc5 micropulsa-tion activity in the morning sector to the auroral westward elec-trojet, Planet. Space Sci., 26, 473–492, 1978.
Lee, D.-H. and Lysak, R. L.: Magnetospheric ULF wave coupling in the dipole model: The impulsive exitation, J. Geophys. Res., 94, 17 097–17 103, 1989.
Lee, D.-H. and Lyons, L. R.: Geosynchronous magnetic field re-sponse to solar wind dynamic pressure pulse, J. Geophys. Res., 109, A04201, doi:10.1029/2003JA010076, 2004.
Mann, I. R., Wright, A. N., Mills, K. J., and Nakariakov, V. M.: Ex-citation of magnetospheric waveguide modes by magnetosheath flows, J. Geophys. Res., 104, 333–353, 1999.
Mitchell, D. G., Engebretson, M. J., Williams D. J., Cattell C. A., and Lundin, R.: Pc5 pulsations in the outer dawn magnetosphere seen by ISEE 1 and 2, J. Geophys. Res., 95, 967–976, 1990. Miura, A.: Kelvin-Helmholtz instability at the magnetospheric
boundary: Dependence on the magnetosheath sonic Mach num-ber, J. Geophys. Res., 97, 10 665–10 675, 1992.
Nos´e, M., Iyemori, T., Sugiura, M., Slavin, A., Hoffman, R. A., Winningham, J. D., and Sato, N.: Electron precipitation accom-panying Pc5 pulsations observed by DE satellites and at a ground station, J. Geophys. Res., 103, No. A8, 17 587–17 604, 1998.
2634 N. G. Kleimenova et al.: Pc5 geomagnetic pulsations Oberts, P. and Raspopov, O. M.: Study of the Pc5-type geomagnetic
pulsations space characteristics, Geomagnetism and Aeronomy, 8 (3), 534–539, 1968.
Pilipenko, V. A., Kleimenova, N. G., Kozyreva, O. V., Yumoto, K., and Bitterly, J.: Longitudinal features of Pc5 pulsations in the morning and evening sectors, Geomagnetism and Aeronomy (English translation), 37 (3), 307–315, 1997.
Poulter, E. M. and Allan, W.: Transient ULF pulsation decay rates observed by ground based magnetometers: The contribution of spatial integration, Planet. Space Sci., 33, 607–616, 1985. Posch, J. L., Engebretson, M. J., Pilipenko, V. A., Hughes, W. J.,
Russell, C. T., and Lanzerotti, L. J.: Characterizing the long-period ULF response to magnetic storms, J. Geophys. Res., 108(A1), 1029, doi:10.1029/2002JA009386, 2003.
Rostoker, G. and Lam, H.-L.: A generation mechanism for Pc 5 micropulsations in the morning sector, Planet. Space Sci., 26, 493–505, 1978.
Rostoker, G., Spadinger, I., and Samson, J. C.: Local time vari-ations in the response of Pc5 pulsvari-ations in the morning sector to substorm expansive phase onsets near midnight, J. Geophys. Res., 89, 6749–6757, 1984.
Samson, J. C., Harrold, B. G, Ruohoniemi, J. M., Greenwald, R. A., and Walker, A. D. M.: Field line resonances associated with MHD waveguides in the magnetosphere, Geophys. Res. Lett., 19, 19 441–19 444, 1992.
Stephenson, J. A. E. and Walker, A. D. M.: HF radar observations of Pc5 ULF pulsations driven by the solar wind, Geophys. Res. Lett., 29, No. 9, doi:10.1029/2001GL014291, 2002.
Walker, A. D. M., Ruohoniemi, J. M., Baker, K. B., Greenwald, R. A., and Samson, J. C.: Spatial and temporal behaviour of ULF pulsations observed by the Goose Bay HF radar, J. Geo-phys. Res., 97, 12 187–12 202, 1992.
Ziesolleck, C. W. S. and McDiarmid, D. R.: Statistical survey of auroral latitude Pc5 spectral and polarization characteristics, J. Geophys. Res., 100, A10, 19 299–19 312, 1995.