The Effect of Animation on Web-based Education
By
Thomas C. Gray
B.S. Mechanical Engineering
Oregon State University, 1999
Submitted to the Department of Mechanical Engineering
in Partial Fulfillment of the Requirements for the Degree of
Master of Science in Mechanical Engineering
at the
Massachusetts Institute of Technology
June 2001
0 2001 Massachusetts Institute of Technology
All rights reserved.
Signature of Author ...
...
Depart
Engineering
Certified by ...
...
.
.
Woodie C. Flowers
Pappalardo Professor of Mechanical Engineering
Thesis Supervisor
Accepted by ... ...
Ain A. Sonin
Chairman, Department Committee on Graduate Students
MASSACHUSETTS INSTITUTE OF TECHNOLOGY
The Effect of Animation on Web-based Education
by
Thomas C. Gray
Submitted to the Department of Mechanical Engineering
On May 11, 2001 in partial fulfillment of the
Requirements for the Degree of Master of Science in
Mechanical Engineering
ABSTRACT
This study intended to show that replacing still pictures with animated pictures would improve a
learner's understanding of computer-based instructional materials. The study showed no
significant improvement. At the time of the study, most of the test subjects were involved in a
robot design project as part of a national competition. The material presented was related to
proper design of robots, which require motors and transmissions. A pretest and posttest were
used to assess the improvements in understanding of torque, angular velocity, gear ratios and
power in that context. One hundred and twenty participants used the specially designed tutorials.
Approximately one-third used materials that included static renderings of bicycles on hills/flats.
For approximately one-third, these renderings were animated. The remaining third used tutorials
that did not function properly because of an unforeseen problem with software compatibility.
Although the indicated improvement in understanding was impressive, the test data were
remarkably insensitive to the tutorial style, even including the "broken" tutorial. While it is
possible that still pictures versus animation is not an important pedagogic variable, the author
believes otherwise. Several possible explanations are presented along with guidelines for more
effective application of animations.
Thesis Supervisor: Woodie C. Flowers
Biography of Author
Thomas C. Gray was born in Forest Grove, Oregon in 1975. He attended Forest Grove High
School and graduated with honors as Valedictorian, Boy of the Year and Recipient of the
Thomas Keller Award for Leadership. He went to Oregon State University on a full-tuition
Presidential Laurels Scholarship. While at Oregon State University he was an active member
and eventually president of the school's chapter of the American Society of Mechanical
Engineers. He became a member of the engineering honor society Tau Beta Pi and the
mechanical engineering honor society Pi Tau Sigma. The mechanical engineering department
recognized him with the CH2M Hill Outstanding Senior Award. At MIT, he worked with
Pappalardo Professor of Mechanical Engineering Woodie C. Flowers to develop an online
community called SharingFIRST (http://sharingfirst.mit.edu) where members of the FIRST
Robotics Competition could teach each other about building robots. Working with FIRST,
Autodesk, The Institute for Women and Technology, Hewlett Packard and MIT, he helped high
school women learn to use animation and the Internet to teach technical concepts. This work
resulted in "Promoting Leadership in Girls in an Informal Education Environment: The FAIHM
("fame") Program" which received the Best Technical Paper Award at the 2000 Society of
Women Engineers National Conference. Outside of his required studies, he was part of the MIT
Solar Electric Vehicle Team. Upon completion of his Masters of Science in Mechanical
Engineering from Massachusetts Institute of Technology, he returned to Oregon with his wife
Janelle to work at Olympic Controls as an applications engineer.
Acknowledgements
The two years at MIT from Fall of 1999 to Spring of 2001 filled my mind with new insights. I
owe this experience to the people who encouraged and supported me, the organizations who
funded me and the authors who shared their insights with me.
The people that have provided encouragement and ideas deserve great praise, through them the
world of technology and education exposed itself to me:
Janelle Gray, my loving and forgiving wife. Janelle's influence deserves two sentences.
Timothy and Kathy Gray, my education-valuing parents. T.J. and Laura Gray, my trustworthy
big brother and creative baby sister. Bill and Pat Dugan, my newest set of loving parents.
Professor Woodie Flowers, my advisor and hero at MIT. Maggie Beucler, Woodie's diligent
assistant at MIT. Matt Page, my adventurous lab mate at MIT. John Foster, my introspective lab
mate at MIT. Greg Kimberling, the oracle semi-guru. Jim Meyer, my closest friend at MIT.
Dan and Jennifer Gee, friends who opened closed doors at General Motors and elsewhere. Seth
Berman, a friend who shared my same passions at MIT. Maria Kamvysselis, a party going
friend who showed me fun at MIT. Amanda Gruhl, my dance-crazy friend. Glenn Kaufman, my
Internet providing savior from Ratheon. Mike Fitzgibbons, my inspiring science teacher at
Forest Grove High School. Donald Boys, a professor who provided 20 students at University of
Michigan, Ann Arbor for the study. Dia Stolnitz, a problem solver at FIRST. Corrina Lathan,
the main author of our published paper. Cindy Abrams, a woman with enthusiasm for education
at FIRST. Dava Newman, an example of a successful female professor at MIT. Diane
Soderholm, an organizational genius at MIT. Laura London, champion for 3-D animation and
education at Autodesk. Kelly Stanphill, generous supporter of 3-D animation education at
Autodesk. Ted Boardman, my D Studio Max guru at Autodesk. Mark Bessette, a dedicated
3-D animation educator at MIT. Gerson Borja, Kate Murray and Amy Weeks, students from
Clinton High School who taught me how to teach with animations. Irvin, the janitor who cared
at MIT.
Many organizations provided funding and support:
The National Science Foundation, The Center for Innovation in Product Design, Massachusetts
Institute of Technology, FIRST, Hewlett Packard, Autodesk, Institute for Women and
Technology.
Authors who provided thought provoking ideas beyond animation include:
Michael Crichton, Richard Feynman, James Gleick, Phillip Greenspun, Robert Heinlein,
Seymor Pappert, Tim Berners-Lee, Max Lucado, Josh McDowell, Ron Mehl, Ayn Rand, J.R.
Tolkein, and Leo Tolstoy.
Table of Contents
Biography of Author
...
3
Acknowledgm ents
...
4
Table of Contents
...
5
Introduction
...
6
M otivation
...
6
Literature Review
...
7
The Study
...
10
Results
...
29
Discussion
...
48
A Note On Controlled Experiments
...
51
Conclusions
...
51
Appendix 11 - Tutorial Screenshots ... 55
Appendix III - Grading Rubric ... 67
Appendix IV - Test Responses ... 85
Appendix V - Test Scores ... 205
Introduction
This study intended to show a link between the media type (animations or pictures) used in an
educational web page and the amount of learning that results. The study did not return
significant results indicating an advantage of animations over pictures. One hundred and twenty
subjects volunteered to take the test. They completed the ten-question pretest, then looked
through one of three different web-based tutorials and completed the ten-question posttest in
about 30 minutes. Approximately one-third used materials that contained static renderings of
bicycles on hills/flat. For another one-third, these renderings were animated. The remaining
third used tutorials that did not function properly due to problems with software compatibility. A
standardized grading rubric controlled the bias of the grader.
The results of the study show a significant improvement in test scores independent of the media
type used to present the information. The study also showed that subjects with the lowest pretest
scores improved the most. This improvement occurred independent of the media type. Neither
the animations nor the pictures proved superior to the case when neither was present. This study
does not eliminate animation as a useful tool for online education but it challenges intuition.
This thesis includes six sections: Motivation, Literature Review, The Study, Results, Discussion
and Conclusions. The author presents several explanations for the results of this study and
guidelines for effective use of animation in the discussion section.
Motivation
The author devoted a considerable portion of the time he spent at MIT promoting the use of
computer animation as an education tool. FIRST and Autodesk provided educational licenses of
3-D Studio Max Version 3.0 (Current industry standard 3-D animation package in January,
2000) to more than 500 high school robotics teams competing in the FIRST Robotics
Competition. Autodesk challenged the teams to create animated educational web sites teaching
important robotics topics. Teams with animation, web-design and educational expertise created
the best web sites. Through the course of a year, the author learned to create educational
animations and tested various formats for the best presentation over the Internet. These activities
lead to two questions. First, do animations improve web-based education? Second, does this
improvement justify the additional effort?
Literature Review
An enormous number of studies show the effectiveness and value of web-based and
computer-based teaching. Professor David Wallace at MIT showed that web-computer-based lectures can
disseminate information effectively when compared with typical sit-in lectures (Wallace and
Mutooni, 1997). He progressed further and successfully replaced chalkboard lecture time with
in-class laboratories and used on-line lectures to further leverage on-line information (Wallace
and Weiner, 1998). According to Bettina Brown, "Reduced training costs, worldwide
accessibility and improved technological capabilities have made web-based training (WBT) a
viable alternative to classroom instruction" (Brown, 2000). Projects like Washington State
University's GenTechnique project, which teaches molecular genetics (Calza and Meade, 1998)
and MIT's TEAL project which teaches electromagnetism in a networked environment with
animations and hyperlinks (MIT CAES, 2001) show that large educational institutes have
embraced this new trend. The literature on the effectiveness of web-based instruction is
extensive. This thesis itself confirms the ability to increase understanding using on-line
materials. However, this study specifically compares the effectiveness of media types. The rest
of the authors cited narrow the focus to this specific challenge.
Animation appears to be an enticing form of communication and entertainment. Only video
game sales surpass the incredible profits of Disney's animated classics. Dr. David Walsh,
president of the National Institute on Media and the Family, announced the preliminary research
of his colleagues Dr. Douglas Gentile and Paul Lynch who showed that 86% of all teens own
video and/or computer games (Walsh, 2001). While Dr. Walsh and his colleagues studied the
link between video game violence and negative behavior, they indirectly showed the educational
power of these interactive, animated worlds. Amy Leh's research into adolescent web page
preferences shows that "the children were especially attracted to web sites with many graphics or
animations" (Leh, 1999). Melissa Dancy showed that animations used in testing could clarify
questions and lead to a more accurate assessment of students' knowledge (Dancy, 2000). Sonali
Pathak linked animations to increased learning when he found that an interactive CD-Rom
tutorial with high bandwidth animations could teach more effectively than an interactive
web-based tutorial without animations (Pathak, 1999).
Many studies caution the use of animation. A considerable amount of time and bandwidth is
needed to add interactivity and animations to a basic set of pictures and instruction. Peter Riley
warns, "careful consideration of content is necessary due to bandwidth and connection
limitations" (Riley, 1997). Animations increase existing problems with software compatibility,
download speeds and computer processing speeds. The average person on the street will tell you
that animation is more effective than text and pictures, however there are reasons to suspect
otherwise. Meghan Dunn of Yale University showed animations only show effectiveness when
the subject matter is difficult to visualize (Dunn, 2000). In mock-jury cases related to the
familiar topic of car accidents, an animated scene by one party was not enough to sway the jury's
decision. In the case of more unfamiliar plane crashes, the mock jury sided with the party
presenting the animation. This suggests that the context affects the significance of animations.
Studying animation's role in on-line sales, Yasmin Gopal at the University of Georgia showed
that sound improved ratings more than animation. His subjects rated chemical companies' web
pages on retention, attitude toward the page, attitude toward the sponsor and behavioral
intention. Gopal's subjects rated the animated page lower than the control page without
animations or sound in attitude toward the page (Gopal, 1996). Duane Jarc at The George
Washington University compared interactive, animated, java-based courseware with an earlier
non-interactive on-line courseware and produced no significant difference between the two
groups except for a general perception of greater happiness (Jarc, 1999). Barbara Sauls showed
that simple rotating animations of crystal lattice structures had equivalent educational value as
fully interactive VRML (Virtual Reality Markup Language) simulations (Sauls, 1999). Saul's
study suggests the importance of understanding the fastest, least expensive media to use in
different situations. The closest study related to the topic of animation in web-based education is
that of Wolfgan Schnotz and Harriet Grzondrziel. They studied university students interacting
with web pages containing pictures or animations and deduced that the "animated pictures may
result in a less intensive processing, because they prevent individuals from performing relevant
cognitive processes by themselves" (Schnotz and Grzondrziel, 1996).
The Study
This study used a simple experiment to add insight to the current scientific discussion on the
effectiveness of animation. The study intended to reveal differences in learning performance as
a function of media type. One hundred and twenty subjects took a ten-question pretest, viewed
one of three versions of a web page tutorial and demonstrated learning by taking a ten-question
posttest. A set rubric reduced bias when grading responses. The three tutorials included a
pictorial version, an animated version and a broken version where the test subject expected
animations but the computer could not display them.
A majority of the subjects in this study were participants in the FIRST Robotics Competition.
The material presented in the tutorials concerned proper design of robots using motors and
transmissions. The author expected the subjects would show partial familiarity with the material
since many subjects recently spent six weeks designing robots. However, the robots drive train
design did not intimately involve most of the test subjects and others were not involved in the
competition at all. Fortunately, the tutorials explained geared, electric motor systems using a
bicycle analogy to make the material more accessible.
Differences In The Three Versions
The following sections explain the unique content in each version of the tutorial. The
terminology that follows occurs frequently in this thesis to differentiate between the three tutorial
versions.
The Pictorial Version
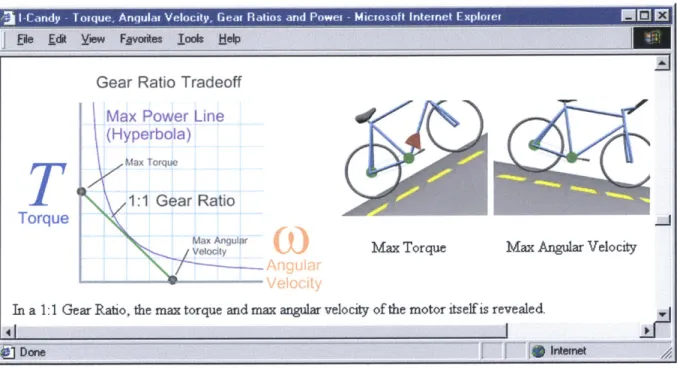
In the pictorial version, a computer animated picture of a bicycle riding up or down different
sloped hills with varying gear ratios and torque enforced the bicycle analogy. In each case the
slope of the hill changed significantly. Two green disks showed the front and rear gear sprocket
on the bicycle. The relative size of the disks varied according to the gear ratio. A red arrow on
the pedals in the picture represented the amount of force needed on the pedal in the situation.
Figure 1 shows the pictorial tutorial.
fie d Yiew Favoies TolS 1jelp
Gear Ratio Tradeoff
Max
Power Line
Max Tru
(Hyperbola)
TA
1:1 Gear Ratio
Torque
Mx Anur Max Torque Max A
v al :ity
In a 1:1 Gear Ratio, the max torque and max angular velocity of the motor itself is revealed.
41
{JDone
-i
rgular Velocity
II
j 0Irernet XFigure 1. The pictorial tutorial showed still images of bicycles riding up and down hills.
L
----------- - ---- -- r--- T-- - --- -,-- --- ' ---
The Animated Version
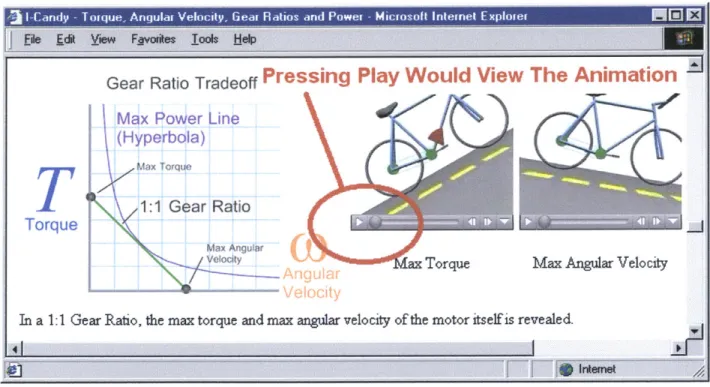
In the animated version, a computer animated scene of a bicycle riding at a set speed up or down
different sloped hills with varying gear ratios and torque enforced the bicycle analogy. The
animated version included all of the information in the pictorial version in addition to showing
the relative ground speed in different situations, the relative cadence (front crank angular
velocity), and the changing force on the pedals as they go through a complete rotation. Figure 2
shows the animated tutorial.
,,3 ICny-Tru Anua . Veocty Gea Raio an-oe irsf ntre xlrrN9
E dt yFiew Favrtes To* Hep
Gear Ratio Tradeoff Pressing Play Would View The Animation
Max Power Line
(Hyperbola)
1:1 Gear Ratio
Torque M
Max Angular
velociy ax Torque Max Angular Velocity
In a 1:1 Gear Ratio, the max torque and max angular velocity of the motor itself is revealed.
The Broken Version
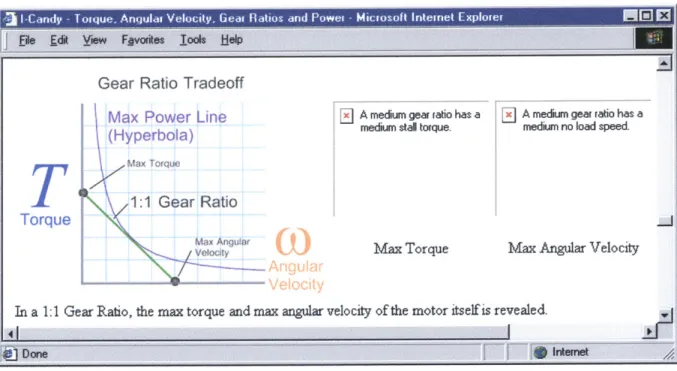
In the broken version, the Apple QuickTime plug-in on the subject's computer either did not
exist or could not to play the QuickTime movie format for some reason. (QuickTime is an
animation movie format designed by Apple.) This resulted a few variations of failure like a blank
player window or a simply a rectangular placeholder box displaying a browser error. The subject
did not receive any picture or animation of the bicycle in the entire tutorial, even though the
tutorial text referred to bicycles. Figure 3 shows the problem with the broken tutorial.
and - Toqe Anua Veoiy Gea Raio an Poe - Mirsf Inere Exle ROM
Jil
Edi j Yiew Fjvorltms lals HelpGear Ratio Tradeoff
Max Power Line
A medium gear ratio has a A medium gear ratio has a(Hyperbola) medium sta torque. medium no load speed.
"ax Torque
1:1 Gear Ratio
Torque
Max Angular Velocity
Velocity MaA Torque MarAngular
In a 1:1 Gear Ratio, the max torque and max angular velocity of the motor itself is revealed.
41 I_
Done - @ nternet
Figure 3. In the broken tutorial, no pictures or animations of bicycles were displayed.
Similarities In The Three Versions
The media types provided the only differences in the three tutorials. The tutorials each attempted
to teach the concepts of torque, angular velocity gear ratios and power using only standard text,
formatting, layout, color and graphs. If done carefully, these tools work consistently on all
browsers and are the easiest material to archive and search.
The Text
Good web authoring ensures that the page contains all of the information it intends to share in
text form in addition to pictures and animations. Nothing in any of the pictures or animations
was invaluable to learning the relationships between torque, angular velocity, gear ratios and
power. However, the pictures and animations intended to enhance and improve the
understanding of these ideas. Figure 4 shows how text, formatting, layout, color were used in
one section.
Anglar velocity is a turning speed. It is how fast
an object is spinning around. You can calculate it by
A n-dai
dividigg the velocity of any point on the object by the
radius to the center of rotation.
W= v /r. In-line skate wheels spin at a high angular
velocity (1500 revolutions per rninute.)
Figure 4. The text was kept short and clear. Formatting, layout and color also aided understanding.
The Formatting
The use of bold characters to highlight the words torque, angular velocity, gear ratios and power,
continuously refocused the tutorial on the understanding of the most important ideas. Section
headers used larger fonts. Hyperlinks used standard blue text and with underlines. The 640
pixel tutorial width kept the web site accessible to users with older computers.
The Layout
The tutorial starts with a table of contents with hyperlinks to any specific topic in the tutorial.
The tutorial included four main sections: an introduction, definitions, the relationships, and
additional information. A single page, outline format organized the information and reduced the
chance that the subject would get lost.
The Use of Color
The tutorial used color to show the structure of the tutorial text more clearly and to match
definitions, graphical and pictorial elements together. The layout of the tutorial used dark blue
blocks
to show major sections, light blue blocks
to show the
minor sections and light gray blocks (light gray block) to highlight important relationship
statements. As mentioned earlier, the tutorial displayed the words torque, angular velocity, gear
ratios in black bold text. In addition to layout, color transferred ideas between definitions,
graphs and pictures. Blue (blue text) highlighted Torque in its definition picture and on the
graphs. Green
(green
text) highlighted gear ratios in its definition picture, as a green line on the
graphs and as green gears on the bicycles. Orange
(orange text)
highlighted angular velocity and
purple (purple text) highlighted power in similar ways.
The Graphs
Each section of the tutorial, in all three versions, contained a graph, in picture format, that
showed the current operating point on a torque-angular velocity curve. The graphs used the
color-coding scheme as discussed above. Pictures or animation mapped a real life situation to
the operating points shown on the graphs and provided the subject with multiple ways to view
the material. The broken tutorial only displayed the graphs. Figure
5
shows one of the graphs.
I-Cand To - Anua Ie Veoiy .ea Raio an Poe - McotIntin - II -e
I'
Eck
View Favyordes Tools HelTorque-Angular Velocity Tradeoff
T
Torque
Max Power Line
(Hyperbola)
(Zero torque Max argular velfcty)
No Load Speed
_J
The point where there is no torque load and the motor spins as fast as it can is the no load speed. You feel it biking down a hill when you can't pedal any faster.
41
F .Dne
Figure 5. Every tutorial type provide graphs to the test subject.
The Pretest
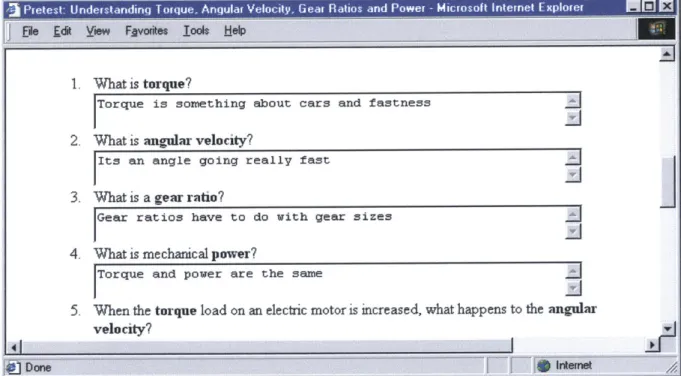
The pretest intended to test the subject's basic vocabulary, understanding of torque, angular
velocity, gear ratio and power relationships and the application of these relationships to bicycles.
The subject typed a complete response into a text box on their web browser. There were no
multiple choice or true/false questions to reduce the effect of guessing. Each of the three
question types was intended to expose different levels of understanding. Figure 6 shows a
portion of the pretest.
1.
2.
3.
4.
What is torque?
Torque is something about cars and fastness
What is angular velocity?
Its an angle going really fast
What is a gear ratio?
Gear ratios have to do with gear sizes
What is mechanical power?
j
Torque and power are the same
5. When the torque load on an electric motor is increased, what happens to the angular
velocity?
j one
77,
@
irternetFigure 6. The 10-question pretest without multiple choices often challenged the subjects.
Definition Questions
The first four questions asked the subject to define torque, angular velocity, gear ratios and
power. This section shows questions in bold and a generally accepted answers in italics.
1. What is torque? A twistingforce
3. What is a gear ratio? How many times the output gear turns if the input gear turns
once.
4. What is power? How quickly energy a machine uses energy.
The answers to these questions helped to understand the value of later questions that used these
terms.
Relationship Questions
The next three questions discussed three basic relationships between torque, angular velocity,
gear ratios and power.
5. When the torque load on an electric motor is increased, what happens to the
angular velocity? (Assume the electric motor has the torque-angular velocity curve
shown above.) The angular velocity decreases when the torque load increases for
electric motors with a linear torque angular velocity curve.
6. When the gear ratio on an electric motor is changed to a higher gear (bigger driving
gear and smaller output gear) what happens to the maximum amount of torque the
system can generate? The maximum amount of torque decreases and the maximum
angular velocity increases when the gear ratio is changes to a higher gear.
7.
At what level of torque and angular velocity does an electric motor generate the
most mechanical power? When the torque load is at half of the maximum torque and
the angular velocity is a half of the maximum angular velocity, the electric motor
generates the most mechanical power.
The answers to these questions helped to evaluate the subject's understanding of these terms
interrelationships in the context of electric motors.
Application Questions
The last three questions used the analogy of a bicyclist on a bicycle to see if the subject could
apply the ideas to a real situation.
8. When a bicyclist starts riding up a hill without shifting gears, why does he/she slow
down? The slope of the hill increases the torque on the system and thus decreases the
angular velocity.
9. When a bicyclist shifts into a lower gear (smaller driving gear and larger output
gear) what happens to the maximum speed of the bicycle can go? The maximum
speed and maximum angular velocity lower when a bicyclist shifts into a lower gear.
10. What is the main reason a bicyclist shift gears? Bicyclists shift gearsfor many
reasons such as maximizing power, maximizing efficiency or keeping a constant cadence
(angular velocity of the crank.)
In many cases, these questions tested the subjects general understanding of bicycling and not
the physics behind it.
The Web Page Tutorial
The web page tutorial refreshed the subjects' definitions of torque, angular velocity, gear ratios
and power. Then it explained the interrelationships using a bicycle as an analogy to an electric
motor.
Table of Contents
-
The Basic Layout
The tutorial starts with a hyper linked table of contents that gives an overview of the content and
provides a frame of reference for the student. The table of contents also included a brief
definition of torque, angular velocity, gear ratios and power. Figure 7 shows a screenshot of the
table of contents.
1.0 -Introduction
1. 1 -Why is this important?
1.2 -Bike Analogy 2.0 -Defnitions
2.1 -Torque -A twisting force
2.2 -Angular Velocity -A turning speed
2.3 -Gear Ratio -How many times the output gear turns if the input gear turns once
2.4 -Power -How quickly energy is used
3.0 -Relationships
3.1 -Torque and Angular Velocity
Understanding the tradeoff between torque and angular velocity.
3.2 -Gear Ratios, Max Torque and Max Angular Velocity
Understanding the effect of changing gear ratios.
3.3 -Power and Gear Ratios
Understanding how torque and angular velocity affect power.
4.0 -Additonal Information
4.1 - Links
4.2 -Acknowledgements
4.3 -Take the posttest
Definitions
The definition section refreshed the ideas of torque, angular velocity, gear ratios. It used simple
short statements, large bright pictures and friendly examples. The definitions section remained
the same in all three tutorial versions. For many subjects, the definitions section introduced
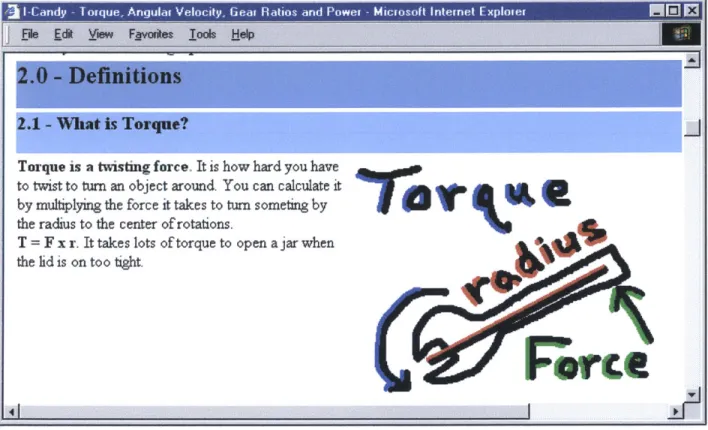
these terms for the first time. Figure 8 shows a screenshot of the part of the definitions section.
Figure 8. The definitions section was the same on all three tutorials.
Relationships and Applications
The relationship section was explained three aspects a gear reduced electric motor system using
the bicycle and cyclist analogy. It discussed torque and angular velocity, then gear ratios and
maximum torque and angular velocity and finally gear ratios and power.
I
Torque is a twvisting force. It is how hard you have
to twist to turn an object around. You can calculate it
by multiplying the force it takes to turn someting by
the radius to the center of rotations.
T = F x r. It takes lots of torque to open a jar when the lid is on too tight.
4'
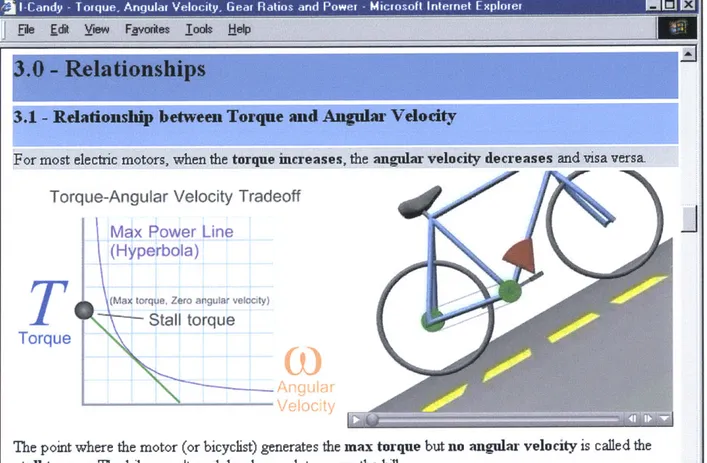
Torque and Angular Velocity
This section explained the linear relationship between toque and angular velocity. The gear ratio
stayed constant and the external torque load decreased from the stall torque, to a medium torque,
to a no load condition. The angular velocity increased as the torque decreased. Figure 9 shows a
screenshot of part of the relationships section.
/I-Cand Toqe - Anua . Veoiy Gea Raio an oeIirsf nere xlrrN IE
Fle Ek View Fjwxies
Tlcs-3.1
-
Rdationship between-Torque and Angular Velocity
For most electnc motors, when the torque increases, the angular velocity decreases and visa versa
Torque-Angular Velocity Tradeoff
Max Power Line
(Hyperbola)
(Max torque, Zero angular veliccty)
Stall torque
Torque
The point where the motor (or bicyclist) generates the max torque but no angular velocity is called the
stall torque. The biker can't push hard enough to go up the hill.
41
d
Gear Ratios, Max Torque and Max Angular Velocity
This section explained how changing gear ratios affects the maximum torque and maximum
angular velocity. A graph showed the torque-angular velocity curve and pictures or animations
of stall torque and no load speed for three different gear ratios. Figure 10 shows a screenshot.
versa The gear ratio is represented by the green line
Gear Ratio Tradeoff
Max Power Line
Max Torque
(Hyperbola)
T
1:2
Gear Ratio
Torque
Max Angufar velocity
In a 1:2 Gear Ratio, the max torque is twice that of a fast.
Max Torque Max Angular Velocity
1:1 gear ratio but the max angular velocity is half as
Gear Ratio Tradeoff
Max Power Line
(Hyperbola)
Max Torque
1:1
Gear Ratio
Torque
Max Angular
Ve OC ty Max Torque Max Angular Velocity
In a 1:1 Gear Ratio, the max torque and max angular velocity of the motor itself is revealed.
41 T _ _ _ _
77 IrAmet
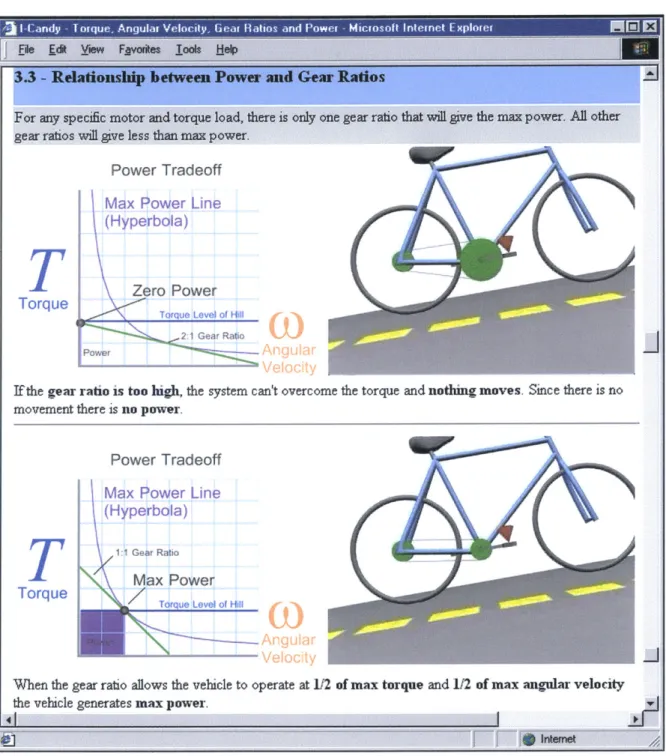
Power and Gear Ratios
A purple box on the graph under the torque-angular velocity curve represented power. It showed
that power is the product of torque and angular velocity. Torque remained constant and the gear
ratio lowered. The angular velocity and power changed. Figure 11 shows a screenshot.
give iess man max po
Power Tradeoff
Max Power Line
(Hyperbola)
T
Zero PowerTorque
Torque Level of Hil IGear Rato PowerIf the gear ratio is too high, the system can't overcome the torque and nothing moves. Since there is no
movement there is no power.
w
Power Tradeoff Max Power Line (Hyperbola)
1 1 Gear Ratio
Max Power
Torque
uTorque Lve of Hil
When the gear ratio allows the vehicle to operate at 1/2 of max torque and 1/2 of max angular velocity the vehicle generates max power.
'41
I
-J
j7.J
Figure 11. The power section tried to explain how gear ratios affect power.
The Posttest
The Posttest intended to show that the subjects' understanding of the material improved while
looking at the web-page tutorial. The subjects defined torque, angular velocity, gear ratios and
power and then answered modified versions of the original questions that tested the original
concepts. Figure 12 shows a screenshot of the posttest.
9. When a bicyclist shifts into a lower gear (smaller driving gear and larger output gear)
what happens
to the maximum speed the bicycle can go?
10.
11.
12.
The naximum speed decreases.
What is the main reason that bicyclist shift gears?
To maintain an optimum torque, angular velocity or power.
Did your tutorial contain any animations?
no, I didn't have the quicktime plug-in.
I appreciate your help, this is a chance to provide extra feedback.
jcool dude, neet demo, wish I could have seen anime
41
LtionsI
-Al
Hemet4
Figure 12. The posttest allowed students to show they had learned new ideas and provide feedback.
Definition Questions
The definition questions remained identical to the pretest. It was desirable for the test subject
memorized the definitions. The ability to define things does not necessarily show understanding.
However, knowing the definitions of a few key terms is useful for communicating ideas.
Relationship Questions
The posttest relationship questions differed slightly to reduce any effect from students who took
the pretest and searched the tutorial for the specific answer without understanding the general
concept that leads to the answer.
5. When the angular velocity of an electric motor is increased, what happens to the
amount of torque the motor can generate? (Assume the electric motor has the
torque-angular velocity curve shown above.) The torque generated decreases when
the angular velocity increases for an electric motor with a linear torque-angular velocity
curve.
6. What happens to the maximum amount of torque the system can generate when the
gear ratio on an electric motor is changed to a lower gear (smaller driving gear and
larger output gear.) The maximum amount of system torque increases when the electric
motor is changes to a lower gear.
7.
What are the two operating points on a torque-angular velocity curve where an
electric motor does not generate power? At no load speed and stall torque the system
does not generate power.
Application Questions
The posttest application questions also differed slightly to reduce chance that the subject learned
only the answer to the pretest question without understanding the principals behind it.
8. Why does a bicyclist stuck in high gear go faster on flat than on a steep hill? This
question could be answered without understanding torque and angular velocity by saying
that the body's chemical energy is all being converted to kinetic energy on flat but must
be partially converted to potential energy on the hill. However, considering the topic, the
increased torque of the hill leads to a decrease in the angular velocity of the bicycle's
rear wheel and thus the bicycle's speed.
9. When a bicyclist shifts into a lower gear (smaller driving gear and larger output
gear) what happens to the maximum speed the bicycle can go? In a lower gear, the
bicycle system has a lower maximum speed but can generate more torque.
10. What is the main reason that bicyclist shift gears? This is the same question as on the
pretest, but it showed that many subjects could think about the answer in a more
technical way. Bicyclists shift gears for many reasons such as maximizing power,
maximizing efficiency or keeping a constant cadence (angular velocity of the crank.)
Grading Rubric
The author sorted the pretest and posttest responses into categories of 100% correct answers,
67% correct answers, 33% correct answers and 0% correct answers. The entire grading rubric is
in the appendices, however it aids understanding to see an example of the rubric used to judge
one of the questions. Figure 13 shows the rubric for the definition of angular velocity.
2. What is angular velocity?
Correct Answers rotational speed
"the velocity of rotation"
"Angular velocity is the rate of rotation of a
body."
"the velocity at which a round object turns and is given in radians per second."
"uh...linear velocity
divided by radius" "the speed at which an
angle reduces or greatens"
"angular velocity is a
rotating vector
represented by lower case omega and is equal to 2 times pie divided by
the period"
67% Answers motor speed (infers rotation)
"The rate of a motor measured in radians"
"How fast a motor
can potnetially move"
"The speed in a
given direction that a
motor creates"
33% Answers
speed answers
"the angle that the object is twisting"
"the time it takes to complete one
revolution (rpm)" "The angle at which something moves (Speed)"
Incorrect Answers everything else
"a unit of measure relating to an indirect application of force. An amount of torque lost in tangential direction."
"The mechanical leverage you have on a gear depending on the angle."
"Square"
"how fast something "Velocity of a line goes at a given angle tangent to a circle in
rotation." "One of those
triangular firework thingamajigs that spins real fast..."
"As I recall... angular
velocity=velocity/circu
mference. It
describes the number of complete rotations occuring in a specific time period."
"same as torque"
"A measure of a certain
kind of speed"
Results
The experiment tested 120 subjects. This section looks at the results overall, then from the
perspectives of gender, education level and supervision environment. Finally,
with these extra
influences removed the impact of the media type on the subjects' test scores is clear. While
gender, education level and testing environment showed significant differences in test scores,
the
different tutorial types did not show significant variation.
The Overall Effect of Tutorial Type
Of the 120 subjects who participated in the study, 41 took the animated tutorial, 36 took
the
broken tutorial and 43 took the pictorial tutorial. The subjects who took the animated tutorial
started off with a lower average pretest score (5.9) compared with the average pretest score
on
the broken tutorial (6.3) or the average score on the pictorial tutorial (6.7). The average
score on
the animated tutorial increased 2.2 points (5.9 to 8.1), the average score on the broken tutorial
increased 2.6 points (6.3 to 8.9) and the average score on the pictorial tutorial increased
1.8
points (6.7 to 8.5). The large discrepancy in pretest scores make it impossible to compare
these
three cases directly. However, this relationship hints that the effect of animation in this tutorial
is not significant. The subjects who took the animated tutorial did not show the expected
superiority. Figures 14-16 show the data.
All Subjects Animated Tutorial
0.0 7.0-6.0 0 3) .0- 2.0- 3.0-0.01 10 Test TakerFigure 14. The average scores on the animated tutorial improved 2.2 points from
5.9
to 8.1.All Subjects Broken Tutorial
10.0 -9.0-- - 8.0-- 7.0- LD6.0- 5.0-- 4 .0 - 3.0- 2.0- 1.0-Test Taker
All Subjects Pictorial Tutorial
10.0 8.0- 7.0- LD6.0- S5.0- 1-4.0- 3.0- 2.0- 1.0-0.0 'Ce)~1 ' O 0) LO 0) N- CI L NI 1 C) C ) C ) CD) c Test TakerThe Effect of Gender On Test Scores
The 85 men outnumbered the 35 women who completed the experiment. Women's average
pretest scores (5.2) were lower than men's average pretest scores (6.8). The women's scores
increased 3.3 points (5.2 to 8.5) and the men's scores increased 1.7 points (6.8 to 8.5). This
trend, where the group who started with the lowest score catches up with the group with the
highest score can be seen throughout the results of this experiment. It can be understood more
fully if we look at the results of the first four questions which tested definitions. On a scale from
0 to 4, the women's average score improved 1.9 points (1.7 to 3.6) whereas the men's average
score only improved 1.0 point from 2.5 to 3.5. The ease of the test gives the lowest scoring
groups the greatest opportunity to improve. Figure 17 and Figure 18 show the data.
Men
10.00 -900 8 .00 . 500 6- .00 0 I-4.00 3.00 2.00 1.,00 0.00 Test TakerFigure 17. The average scores of men improved 1.7 points from 6.8 to 8.5.
Women
0 #0 10.00- 9.00- 8.00- 7.00- 6.00- 5.00- 4.00- 3.00-2.00 1.00 0.00-M~ )N-0~
U) r- 0) Tl ) U) 0 - 0 V-- M U VII 04 04 (N4 (~N M ) M Test TakerThe Effect of Education On Test Scores
Fifty-five high school students (or people with only high school diplomas) and 65 college
students or people with college degrees completed the experiment. High school students' pretest
scores (5.6) were lower than college students' pretest scores (6.9). The high school students'
average scores improved 2.5 points (5.6 to 8.1) and the college students' average scores
improved 1.9 points (6.9 to 8.8). In a similar way to the gender relationship, most of the
improvement came in the definitions section where the high school average score improved
almost 1.5 points (1.8 to 3.3). The college students who started with a higher average score in
the definitions section only improved 1.1 points (2.6 to 3.7). Figure 19 and Figure 20 show the
data.
High School Students and Graduates
10.00- - -9.00 8.00 3.00- 2.00-0 1.00 3.00 r- C) (0 0), (%j U CO It r - 0 (c) (0 0) ('j LO Test TakerFigure 19. The average score of high school students improved 2.5 points from 5.6 to 8.1.
F
-College Students and Graduates
10.00 9.00- 8.00- 7.00- 4.00-0.0 2.0 0) 5.000-0)(% U O
~
N 0C 0) % )C 1.00-0.00 "1J ICD 1\ 1~ (4 Cl- CD M 0 ) U U) 0( Test TakerThe Effect of Supervision and Setting On Test Scores
The supervision and setting of the testing took multiple forms but can be grouped into two main
categories. The first category includes the 43 subjects who took the test with a supervisor.
These subjects used laptops designed to display the animations or pictures accurately every time.
The second category includes the 77 subjects who responded to a word of mouth or email request
to take the test and did so on their own personal computers or in school computer labs. The
supervised subjects improved their average score 2.2 points
(5.5
to 7.7). The unsupervised
subjects also improved their score 2.2 points (6.8 to 9.0) although they started with a much
higher pretest score. Figure 21 and Figure 22 show the data.
There was a substantial difference in the testing environment in these two cases. The
supervised/unsupervised division is the only case where the group who with the lowest pretest
score made the same improvement as the group with the higher pretest score. This suggests that
the testing and learning environment had a significant impact on the final scores. The supervised
sessions occurred at the FIRST Robotics Competition in Orlando, Florida and during Mr. Mike
Fitzgibbons High School Physics classes in Forest Grove, Oregon. The FIRST Robotics
Competition appears to be a poor testing environment due to the excitement level of 15,000 other
students, ongoing competitions and background noise. The learning environment of the
unsupervised subjects was not perfect, however it is hard to imagine situations less ideal than the
blaring horns and blinking lights at the Epcot Center. The unsupervised subjects could also have
cheated and used the browser's back button to look up the answers. However, considering their
high pretest scores this unlikely.
Supervised Testing
10.00-9 .00
---
-
-
---- 8.00- 7.00-- 6.00--0 5.00- S4.00- 3.00- 2.00- 1.00-Test Taker
Figure 21. The average supervised subject improved 2.2 points from 5.5 to 7.7.
Unsupervised Testing
e 0 10.00 9.00 8.00 7.00 6.00 5.00- 4.00- 3.00- 2.00- 1.00- 0.00-Test TakerRemoving the Effects of Gender, Education Level and Supervision.
A three-dimensional cross section was of the data identifies the effects of the tutorial media type
without the imposed effects of gender, education level and supervision environment. In each
case, the tutorial types were compared with only the specific subset of the data. Many of the data
sets became extremely small in this situation but this method allowed the data to be viewed with
the least bias. Only the subset of male college students tested unsupervised presents significant
information. The remaining subsets provide insight only. Figure 23 shows the subsections.
Figure 23. The data subsets, grouped by gender, education level and supervision environment, eliminate pretest variations.
Female College Students Tested Unsupervised
The results of the female college students tested unsupervised are typical of this study. Since
anyone who studies the material thoroughly can attain the top score on the test, groups with a
lower starting average score, like the broken group in this case, make larger improvements than
groups who had higher pretest scores. Figure 24 shows the data.
Female College Students Tested Unsupervised
0 CO,
10.00
9.00
8.00
7.00
6.00
5.00
4.00
3.00
2.00
1.00
0.00
1I
3
5
7
9
11 13 15 17 19 21 23 25
Test Taker
Female College Students Tested Supervised
There were no female college students who took the supervised test, so this information is
unavailable. No data is shown in Figure
25.
Female College Students Tested Supervised
10
2 0 0 co8
6
4
2
01
'
2
3
12
3
4
5
6
Test Taker
Female High School Students Tested Unsupervised
The sample of female high school students tested unsupervised is too small to draw any
conclusions. The large gains made by most of the subjects in this group with the exception of
the subject who took the animated tutorial are interesting. Figure 26 shows the data.
Female HS Students Tested Unsupervised
0
0
CO10
9
8
7
6
5
4
3
2
1
0
1
2
3
4
5
6
7
8
9
10 11
Test Taker
Female High School Students Tested Supervised
This group of subjects is also extremely small but it shows the same general trend as most other
plots. In this case, the animated group started with a lower average score and finished with a
posttest score similar to the pictorial group. There were no broken test cases in the supervised
situations. Figure 27 shows the data.
Female HS Students Tested Supervised
10.00
7.00
0
8.00-
5.00--
4.00---
3.00--
1.00--0.00-1
1
2 3 4 5 6 7 8 9 10
11 12 13 14 15
Test Taker
=
Male College Students Tested Unsupervised
The male college students tested unsupervised is the most homogeneous of the eight subgroups.
This is the only case where the average pretest scores started within half a point of each other. In
this situation, the posttest scores ended within half a point of each other. The three different
tutorial types appear to have little effect. Figure 28 shows the data.
Male College Students Tested Unsupervised
10.00-
9.00-
87
.00-05.00-4.00
-
3.00-
2.00-1.00
0.00 1
4T I* -C) M 0') (%% (\J' C'). 4N ' 6'Test Taker
Figure 28. The three different tutorial types can be seen to have little effect on the scores.
The bootstrap method (Efron and Tibshirani, 1993) tested the data for significance. The
bootstrap method showed that on the pretest the mean animated tutorial score did not differ
significantly from the mean broken tutorial score (p=O.106) or the mean pictorial tutorial score
(p=0.233). The bootstrap method also showed that on the posttest the mean animated tutorial
score did not differ significantly from the mean broken tutorial score (p=O.171) or the mean
pictorial tutorial score (p=0.095). In all three cases the subjects made significant improvements.
The mean animated tutorial score improved 1.1 points (p<0.0005), the mean broken tutorial
score improved 1.9 points (p<0.0005) and the mean pictorial score improved 1.8 points
(p<0.0005). The bootstrapped distributions of the pretest and posttest scores for all three tutorial
types are shown in Figure 29.
Bootstrap Data of
Male College Students Tested Unsupervised
2.0
1.5-1.0
-0.5
-0.0
5.0
6.0
7.0
8.0
9.0
10.0
Test Scores
Figure 29. The bootstrap shows significant increases in test scores overall but does not show significant effects due to the media types.
Male College Students Tested Supervised
There were very few male college students tested supervised. While this data shows that the
subjects' test scores improved more when using the animated tutorial than the pictorial tutorial,
the sample is not large enough to be considered significant. No conclusions can be drawn from
this information. Figure 30 shows the data.
Male College Students Tested Supervised
0 0
10
9
8
7-6
5
4
3
2
1
0
1
2 3 4
5
6
7
8
9 10
11
12 13
Test Taker
U
*k
I'
Male High School Students Tested Unsupervised
No high school male tested unsupervised used a tutorial with working animations. The broken
and pictorial data suggests that the pictures of bicycles were not the key to learning this material.
Both groups started with similar averages and increased by similar amounts. This suggests,
along with earlier data, that the pictorial content was not important to the learning process in this
tutorial. Figure 31 shows the data.
Male HS Students Tested Unsupervised
10
9
8
6
CO, CD 5 (43
-2
0
Test Taker
Male High School Students Tested Supervised
The male high school students tested supervised had very different average pretest scores when
divided by into groups by media type. While the animated tutorial group showed significantly
higher improvement over the pictorial group, most of the improvement is due to learning the
appropriate definitions of torque, angular velocity, gear ratios and power. Nothing can be said
about the effect of animation in this situation. Figure 32 shows the data.
Male HS Students Tested Supervised
0