HAL Id: in2p3-00422343
http://hal.in2p3.fr/in2p3-00422343
Submitted on 7 Oct 2009
HAL is a multi-disciplinary open access archive for the deposit and dissemination of sci-entific research documents, whether they are pub-lished or not. The documents may come from teaching and research institutions in France or abroad, or from public or private research centers.
L’archive ouverte pluridisciplinaire HAL, est destinée au dépôt et à la diffusion de documents scientifiques de niveau recherche, publiés ou non, émanant des établissements d’enseignement et de recherche français ou étrangers, des laboratoires publics ou privés.
Pascal Lautridou
To cite this version:
Pascal Lautridou. Results of the radio-detection experiment CODALEMA. ARENA 2008 : 3rd Inter-national Workshop on the Acoustic and Radio EeV Neutrino detection Activities, Jun 2008, Rome, Italy. pp.S13-S19, �10.1016/j.nima.2009.03.164�. �in2p3-00422343�
Journal logo
Results of the radio-detection experiment CODALEMA
P. Lautridou
1*for the CODALEMA collaboration
1,21
SUBATECH, Université de Nantes/Ecole des Mines de Nantes/IN2P3-CNRS, Nantes, France
2LESIA, USN de Nançay, Observatoire de Paris-Meudon/INSU-CNRS, Meudon, France, LPSC, Université Joseph
Fourier/INPG/IN2P3-CNRS, Grenoble, France, LAL, Université Paris-Sud/IN2P3-Fourier/INPG/IN2P3-CNRS, Orsay, France, GSII, ESEO, Angers, France, LAOB, Université de
Besançon/INSU-CNRS, Besançon, France, LPCE, Université d’Orléans/INSU-CNRS, Orléans, France. Elsevier use only: Received date here; revised date here; accepted date here
Abstract
Measurements of the radio transients associated to Extensive Air Showers could provide a timely new effective method of detection of Ultra High Energy Cosmic Rays with interesting performances in term of techniques and of accessible observables. The CODALEMA experiment at the Radio Observatory of Nançay, France, explores this possibility using an array of broadband active dipole antennas triggered by an array of ground particle detectors. The implemented detection techniques, the methods of analysis developed and the principal results achieved during the 5 years of upgrading will be recalled. This cursory glance will provide an opportunity to point out some new issues and to suggest some future challenges in this domain. © 2001 Elsevier Science. All rights reserved
Keywords: Radio detection, Ultra-High-Energy Cosmic Rays PACS: 95.55.Jz; 95.85.Ry; 96.40
———
* Corresponding author. Tel.: +33 251858441; fax: +33 251858479; e-mail: Pascal.Lautridou@subatech.in2p3.fr
1. Introduction
Since many years, the origin of non-thermal cosmic radiation has become a very stimulating field of researches. Recent results [1] have maybe opened a new window in the domain of UHECR: the arrival directions of the charged cosmic particles (above 1019 eV) can be correlated with the locations of active
galactic nuclei. These objects could be the source of the radiation, but definite conclusions will be made only when more data and better performances in detection will be obtained. Similarly, Ultra High Energy Cosmic Neutrinos have not yet been discovered but, at the ground level, the detection of inclined Extensive Air Showers induced by ντ interactions in rock targets could be envisaged [2]. The produced τ could propagate in the rocks, emerges into the atmosphere and decays, giving rise
to a shower of particles. Detection of very inclined EAS could then constitute a timely objective. To meet these challenges, one of the prospects perhaps lies in the development of the radio-detection of EAS. This runway was initiated first in the late 60’ [3,4] but despite its general advantage - the radio waves propagate in the atmosphere without much attenuation - work ceased quickly in the mid 70’. Since 2003, some experiments, of relatively small scales, like LOPES [5] and CODALEMA [6] in Europe, Radio-AUGER at PAO in Argentina [7,8] revisit this topic. Several comprehensive theoretical frameworks have also been completed or initiated in the last five years [9,10,11,12].
The present article reports on the contributions of the experiment CODALEMA to this effort. It will also present some new preliminary results and it will try to point out some possible next studies in the domain.
Fig. 1: Radio waveforms of an EAS observed in the 23-130 MHz band at Nançay (scales in µs and V). Each plot corresponds to an antenna located along one of the two 600 m long arms.
2. Developments of the detection
Although CODALEMA has greatly evolved over 5 years, the main idea that has driven our efforts has
concerned the evolution of the detection method itself, by moving from a frequency analysis (as performed in the 70’s) to a study in terms of waveform (Fig. 1) of the radio signal (available in the years 2000). This small progress has led to the basic and innovative idea that the transient approach can give, in a natural way, a triggering capability to this detection method.
The gained experience has enabled to enlarge step by step our prospective and since 2006, additional questions are currently addressed taking advantage of several other sites: at PAO, the radio detection in the range of 1018 eV is studied using first prototypes of autonomous radio stations [7]; some limited measurements have been conducted at ARRAGAT (Armenia) for the detection of gammas at lower energy (< 1016 eV), but without success due to the noise induced by the particle detectors; the site of the 21CMA detector is tested as one of the most
interesting site for the detection of horizontal showers and neutrinos around 1017 eV [2].
At the beginning of the experiment, few of the 144 conic logarithmic antennas, taken away from the Nançay Decameter Array [13], were used to successfully detect radio signals [14,15] using LeCroy digital oscilloscopes (8 bits, 500 MHz frequency sampling, 10 µs recording time). In 2006,
emphasis on simplicity, size, cost and performance was used as guidelines to develop a new broadband antenna based on a short, fat active dipole concept [16]. It is made of two 0.6 m long, 0.1 m wide and 1 mm thick aluminum slats, separated by a 10 mm gap, hold horizontally by a plastic mast at 1 m above the ground (Fig. 2). The wires are loaded by a dedicated high input impedance low noise 34 dB amplifier (1 nV/√Hz) with a 3 dB bandwidth in 0.1-220 MHz. This design makes the antenna resonating around 115 MHz with a slowly varying gain over a wide band from 1 to 100 MHz. Validation of the dipole sensitivity has been obtained by observing its correlation pattern with the Decameter Array [17] during the transit of the radio source Cas.A. This new sensor collects data since the end of 2006, linked to VME waveform digitizer boards [18] (12 bits, 300 MHz analog bandwidth, 1GS/s of sampling, 2.5 µs recording time) and it is very robust.
Fig. 2: View of the new broadband antenna with its front-end amplifier box used since 2006.
At Nançay, the only downside has been the detection below 10 MHz, which is not efficient enough without specific captors (this situation is better at PAO), and the detection efficiency in the range 100-200 MHz which is fluctuating due to intermittent transmitters (this domain of frequency will be relevant in clean RF sites). Hence, at the first stage of the off line analysis, the antenna waveforms are usually numerically filtered from the recorded 1-200 MHz bandwidth to a 24-82 MHz window. Presently, the radio array consists in 21 dipole antennas, put in E-W polarization, with a spacing of
around 90 m and forming a cross with 600 meter long arms (see Fig. 3). It is completed by 3 dipole antennas setup in a N-S polarization [22].
Fig. 3 : Schematic view of the CODALEMA experimental setup on January, 2008 superimposed on an aerial view of the Nançay observatory centered on the Decameter array. Plastic scintillators are depicted as red squares. Yellow and green “T” represent dipole antenna oriented respectively in the E-W and N-S directions.
The simultaneous measurements of the characteristics of the showers of particles and of the radio signals have demanded to setting up an array of particle detectors in overlap. In 2004-06, 4 plastic scintillator stations (2.3 m2 each), located close to the corners of the Decameter Array, were only used as a trigger. They were only designed to provide information about the direction and arrival time. Since 2007, a new and more sophisticated particle detector array, made of 17 scintillator stations located on a grid of approximately 85 m of pitch has been installed [19]. It covers a 340×340 m2 area whose center roughly matches the radio array center. This upgrade enables now to extract the energy of the shower and to study the energy correlation with the radio-signal. EAS arrival direction is obtained using the time of flight between different stations. Shower size and core position are calculated from the measured particle densities in the detectors. The deduced lateral distribution is fitted with a NKG lateral distribution function via a minimization algorithm. For shower cores located inside the particle detector array (so called “internal events”), an estimation of the energy is relevant. A Constant Intensity Cut (CIC) method is used to define a
vertical equivalent shower size N0. From Aires simulations for proton primaries, the energy is related to N0 by the formula E = 2.14 1010 N00.9 , with a resolution of the order of ∆E/E ~ 30 % at E = 1017 eV.
One of the starting points of the CODALEMA experiment has been perhaps to realize that it was possible to develop a method of analysis of radio waveform analogous to those already used in particle and nuclear physics (tagging of transients, TOF method are extensively described in Ref. [14,15]). In the initial phase, the tagging of a radio transient was obtained using leading edge discrimination in a bandwidth free of emitters. Such a method has the advantage of being simple and very efficient provided the chosen bandwidth remains free from occasional emitters. In 2007, a new approach to pulse detection was implemented using a linear prediction [21,22] that helps dealing with the opposite situation. It computes an estimate for a point in a time series, as a linear combination of the preceding values of the recorded radio waveform. With this new algorithm, the number of pulse candidates increases by 30 % with respect to the results of the leading edge discrimination technique.
As mentioned earlier, another important point for the future of this detection method was to convince oneself of the possibility to build an effective online radio trigger. Preliminary tests were conducted in 2004 at Nançay using a simple narrow band filter (33-65 MHz) inserted on the antenna signal which was sent to an amplitude threshold discriminator [14]. At the time of these results, the conclusion was that the trigger rate varied between 0.02 Hz and 2 Hz depending of the weather conditions and the day-night cycle, making feasible a method of an autonomous triggering of the antennas based on the radio transient alone. As demonstrated by the tests at PAO in 2007 [20], this method has to be tuned site per site. However, to avoid misunderstandings in trigger responses, the extreme simplicity of this triggering method has been kept for the new self-contained radio stations in development.
To have confidence in the interpretation of the data, one unavoidable point has consisted also to
understand and qualify the detection performances [23]. This has been possible taking advantage of two natural phenomena. On one hand, the accuracy in the arrival direction has been extracted using a radio emission from the sun. The distribution of the residues, between the reconstructed arrival directions and the true sun locations in the sky, has provided an estimation of the standard deviation of 0.7°. On the other hand, calibration of gains and sensitivities of the antennas have been deduced from the analysis of the antenna noise. It was found that versus the time, the behavior of the noise follows the galactic signal modulation. This has enable to cross calibrate the antenna responses in electric field.
3. Results
The showers are first identified through a selection in the time distribution of coincidence between the arrival of the particle pancake and the radio front, and another one in the angular direction difference between the pancake and the radio front [15]. The energy distributions [22] measured in coincidence by the ground particle array (for internal events) and by the dipole array are superimposed on the Fig. 4.
Fig. 4: Energy distribution of “internal” events measured by the ground particle detector array (black circles) and seen in coincidence with the antenna array (blue squares).
A threshold behavior of the radio detector is clearly visible below 1017 eV but, for a similar set up, the energy threshold of the ground particle array is far
below, around 1015 eV. Both distributions converge at the highest energies. This reflects the increase of the radio-detection efficiency, which is regularly increasing starting at 3 1016 eV and reaches roughly 50 % at 2 1017 eV. This indicates the present domain of detection of this method but technical improvements, should enable to cover the knee region, and especially for inclined showers.
After tagging of the EAS, it becomes possible to extract the distribution of the radio signal at ground and to enlighten one of its most singular features: the distribution of the EAS signal follows a bell shape, when a far source exhibits a flat distribution. This distinguishes the cosmic shower from a man made or from an atmospheric radio wave and suggests that it becomes possible to use only the radio signal with a self-trigger to identify an EAS.
As for particle detector arrays, it is possible to estimate the shower core locations using the radio signals. The first way is to determine the center of the bell shaped distribution when the shower falls inside the antenna array. The alternative is to fit the lateral electric field profile, translated in the shower frame, by an exponential law. Indeed, the lateral dependence of the electric field profile seems to follow a decreasing exponential (as suggested 30 years ago by H.R. Allan [4]) E (d) = E0 exp (-d/d0) where d is the distance between the shower axis and each fired antenna and d0 is the slope parameter for the considered event (see Fig. 5).
Fig. 5: Electric field profile, footprint at ground, arrival direction and core position reconstructed by using radio detection.
Present results indicate also that lateral profiles of the electric fields, arrival directions and core locations do not depend strongly on the frequency below 200 MHz. This suggests that the most relevant median value of frequency window is not firmly established; the minimum width in frequency is not well defined (wide, narrow?). The results obtained so far indicate then that the antenna designs are not crucial except for mechanical considerations and detection capabilities of very inclined showers. From the viewpoint of detection, another striking feature is that this radio signal can be measured at more than 300 m for energies around 1017 eV.
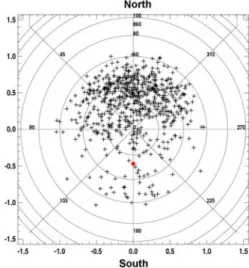
The figure 6 represents the sky maps in local coordinates (zenith, azimuth) of the radio events arrival directions seen by the East-West antennas. A striking feature is the shape of the azimuth distribution and the large asymmetry in counting rate between the North and South sectors.
Fig. 6: Sky map of the observed events in the East-West polarization. The direction of the geomagnetic field at Nançay is indicated by the dot.
This pattern has been interpreted as an effect of geomagnetic field on the electric field generation [22]. Because the Lorentz force acting on the charged particles is at the origin of the different emission mechanisms of the electric field involving the geomagnetic field [10,12], the electric field magnitude should depend on the values of the vector cross product v∧B. Near the detection threshold, the
number of detected radio events should be proportional to the absolute value of the electric field. Indeed, calculations for the recovery of the sky map of the events made under these assumptions looks very similar to the observed ones. This simulation has taken into account that, in the experiment, the signal amplitude given by the E-W dipole should be proportional to |(v∧B)EW|, which is the magnitude of the projection of the vector cross product on the East-West axis (orientation of the antennas). These results suggest that the behavior of the measured electric field can be fairly reproduced by simply considering the vector cross product v∧B of the Lorentz force, and that the radio signal induced by the geomagnetic field dominates with the current CODALEMA observation conditions.
4. New issues
To complete this review, it could be interesting to flash some other results, which are far from finding, at the moment, complete explanations but one has to point out that these analyses are still regarded as very preliminary. These issues could be part of the next challenges in the development of the radio.
Calibration in energy of the radio signal is one of the keys for the future of this new technique. Our first studies of the correlation of the radio signal with the particle energy have been initiated in 2008 and these analyses are far to be conducted at end. In the simplest picture, the maximum value of the electric field at the shower core (E0) could be considered as an energy estimator for the radio signal. This quantity can be extracted, on an event-by-event basis, from the fit of the electric field profiles assuming the exponential dependency E0 exp (-d/d0). The resulting scatter plot of E0 (in a.u.) as a function of the energy Ep deduced from the particle analysis is presented Fig. 7. It is computed using all the detected “internal events” without any other cuts. It exhibits a satisfactory correlation pattern. A linear fit of the correlation gives Log (E0 sinα cosθ) = 1.1 Log Ep – 14.3 which leads to E0 ~ Np0.99 with the assumption that N = Ep0.9. The scatter on E0 indicates that ∆ E0 / E0 = 26 % when ∆ Ep / Ep = 30 %.
Fig. 7: Scatter plot of the radio energy estimator E0 in function of
the energy Ep deduced from the particle analysis (α is the
geomagnetic angle and θ is the zenith angle).
At first glance, the radio emission seems coherent but it is found also that about 50% of internal events (especially when the Signal / Noise declines) do not exhibit clean exponential dependences at small impact parameters (see Fig. 8).
Fig. 8: Problematic profile of electric field, footprint at ground, direction of arrival and core position of a reconstructed EAS.
Although many sources might be at the origin of this behavior (such as possible superposition of several mechanisms in the electric field generation or restrictions on the use of exponential model), current analysis suggest that the near environment of the sensors would be more the main cause (disturbances of the radio signal by trees, buildings) .To pass over this difficulty, a “minimum” estimator Emean, which represents the mean of the recorded amplitude, has
been tried. Unlike the previous observable, Emean doesn’t include any explicit dependence of the distance to the shower axis. Indeed, the computed scatter plot is very similar to the previous one. A linear fit of the correlation gives Log (Emean sinα cosθ) = 0.84 Log Ep – 9.9 . At this stage of our understanding, the radio estimators E0 or Emean could be questionable (furthermore both are correlated to the detector geometry and both depend strongly from the measured electric field profiles) but they seem still very robust and the main trend already obtained by LOPES is observed [24].
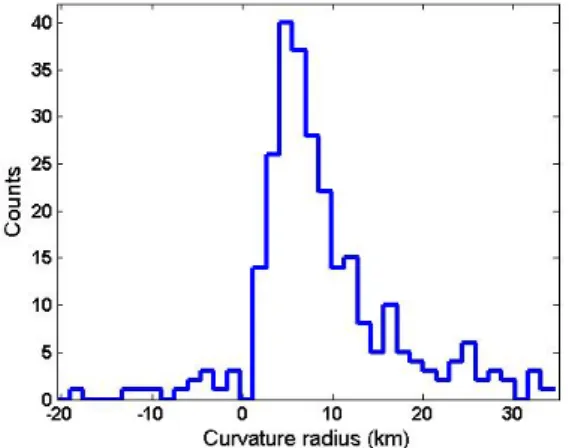
Curvature of the particle pancake is usually linked to the nature of the primary. It was tempting to look at the counterpart in radio. What is observed with CODALEMA is very promising for the interpretations of this parameter. The distribution of the curvatures deduced from the event-by-event analysis of the arrival times of the radio fronts is shown on Fig. 9. It is made using all the detected events without selection.
Fig. 9: Histogram of the number of events as a function of the curvature radius.
An interpretation of the result, in term of distance to the main emitting source, suggests that the time of the maximum amplitude of the filtered radio signal is well linked to the maximum of development of the shower (in opposition with the first observations of LOPES [24]). Such a discrepancy can hardly be attributed to the time accuracy of the detection (~8ns), which could basically acts as a limiting factor. In addition, due to the filtering, the
radio-signals are characterized by a fairly constant duration, quasi-independent in a few nanoseconds of the distance. Accordingly, the time accuracy is not expected to change greatly with the distance to the core. This situation seems also to differ in many aspects from ground particle measurements and needs further investigations (for instance, each antenna shows all the shower longitudinal development). Following recent calculations of T. Huege [25], the information contained in the lateral profile of the radio signal can be correlated to the Xmax of the shower, to the energy and to the nature of the primary. Indeed, the ratio of the field strength (E275/E725) measured at 2 distances (275 m and 725 m) from the shower core and for zenith angles around 60°, is proposed to distinguish between primary particle types. In the 32-64 MHz band, the predictions lead to the following trend: for 4 < E275/E725 < 8, the nature of the primary evolves from Fe to γ. With CODALEMA, the event-by-event estimation of the parameter d0 of the electric field profile (interpreted with the exponential formula), makes possible to compute the ratio E275/E725 without detecting at 725 m. The resulting distribution is presented Fig. 10.
Fig. 10: Event distribution versus the ratio E275/E725 deduced with
the exponential model of the electric field profile.
Part of the distribution locates in the expected range but around 20% of the events show a ratio greater than expected by the simulations. This discrepancy could come from our distribution of zenith angles,
which is centered around 35°. Again to solve this apparent puzzle, additional investigations are needed.
5. Conclusion
Various antennas (log-spiral teepee, short dipole) linked to various electronics (LNA, VME ADC or Scope, Filters) have been tested successfully in CODALEMA. It appears that the detection method is robust, the signal is firm: pretty independent of the antenna and of the electronics.
Much progress has been made in the interpretation of the radio signals. The analysis and the detection methods are in stage of stabilization (see also the results of LOPES) but this effort still demands inputs from the experiments and the theory.
For instance, a deeper understanding of the electric field profile is mandatory in order to deduce a satisfactory energy calibration. A firm confirmation of the polarization state of the electric field is essential to improve the detection and to distinguish between different theoretical approaches such as geo-synchrotron or transverse current models.
Beside the continuation of the R&D of CODALEMA and of LOPES, which are aimed at clearing the ground, a super hybrid detector covering a large area at PAO is envisaged. This new perspective has already been taken into account by the CODALEMA collaboration, which develops a self-contained radio station. It will be operational for the end of 2008.
The radio-detection has entered a phase of detailed studies of the mechanism of emission and it is not far from being ready for intensive use. The potential of this detection method can be reasonably considered but the true interest of the radio-detection might yet to be invented.
Acknowledgments
The authors acknowledge the support of the French Agence Nationale de la Recherche, under grant ANR-NT05-2_42808.
References
[1] The Pierre Auger Collaboration, Science Vol 318 (2007) 938. [2] D. Ardouin et al., this conference.
[3] G.A. Askar'yan, Soviet Phys. J.E.T.P. 14 (1962) 441. [4] H.R. Allan, in: Progress in elementary particle and cosmic ray
physics, ed. by J.G. Wilson and S.A. Wouthuysen (North Holland, 1971) 169.
[5] A. Badea et al, Proceedings of CRIS2004, Nucl. Phys. Proc. Suppl. 136 (2004) 384.
[6] O. Ravel et al, Nucl. Instrum. Meth. A 518 (2003) 313. [7] B. Revenu for the Auger Collaboration., this conference. [8] J. Coppens for the Auger Collaboration, this conference. [9] D. A. Suprun et al., Astropart. Phys., 20 (2003) 157-168. [10] T. Huege and H. Falcke, A&A 412, 19-34 (2003), T. Huege
and H. Falcke, AstroPh. 24 (2005) 116.
[11] N. Meyer-Vernet et al., Astronomy & Astrophysics, 480,15-25 (2008).
[12] O. Scholten et al., arXiv:astro-ph/0709.2872 v1, September 18, 2007.
[13] A. Boischot et al. , Icarus, Vol. 43, Issue 3, 399-407 (1980). [14] D. Ardouin et al, Nucl. Instrum. Meth. A 555 (2005) 148. [15] D. Ardouin et al, Astropart. Phys. 26 (2006) 341. [16] D. Charrier et al, Nucl. Instrum. Meth. A 572 (2007) 481. [17] D. Charrier and the CODALEMA collaboration, IEEE
Antennas and propagation Society International Symposium, Honolulu, Hawai June 10-15, 2007.
[18]D.Breton and E.Delagne, 10th Workshop on Electronics for LHC and future Experiments,Boston, 13-17 sept 2004. [19] D. Lebrun and the CODALEMA collaboration, 30th Int.
Cosmic Ray Conf. ICRC’07, Merida, Mexico (2007). [20] S. Acounis et al., Auger Internal Note, Gap-2007-130. [21] W.H. Press, S.A.J.D. Teukolsky, W.T. Vetterling and B.P.
Flannery, Numerical Recipes in C, Cambridge University Press, Cambridge (1992).
[22] D. Ardouin et al, summited to Astropart. Phys. (Sept. 2008). [23] J. Lamblin and the CODALEMA collaboration, 30th Int.
Cosmic Ray Conf. ICRC’07, Mérida, México (2007) [24] H. Falcke et al, Nature 435 (2005) 313.
[25] T. Huege et al., 30th Int. Cosmic Ray Conf. ICRC’07, Mérida,