Decision Support for Disruption Management On
High Frequency Transit Lines
by
Michel David Babany
Bachelor’s Degree in Engineering
Ecole Centrale Paris, 2012
Submitted to the Department of Civil and Environmental Engineering
in partial fulfillment of the requirements for the degree of
Master of Science in Transportation
at the
Massachusetts Institute of Technology
June 2015
c
2015 Massachusetts Institute of Technology. All rights reserved.
Author . . . .
Department of Civil and Environmental Engineering
May 21, 2015
Certified by . . . .
Nigel H.M. Wilson
Professor of Civil and Environmental Engineering Thesis Supervisor
Certified by . . . .
Haris N. Koutsopoulos
Professor of Civil and Environmental Engineering Northeastern University Thesis Supervisor
Accepted by . . . .
Heidi Nepf
Donald and Martha Harleman Professor of Civil and Environmental Engineering Chair, Graduate Program Committee
Decision Support for Disruption Management On High
Frequency Transit Lines
by
Michel David Babany
Submitted to the Department of Civil and Environmental Engineering on May 21, 2015, in partial fulfillment of the
requirements for the degree of Master of Science in Transportation
Abstract
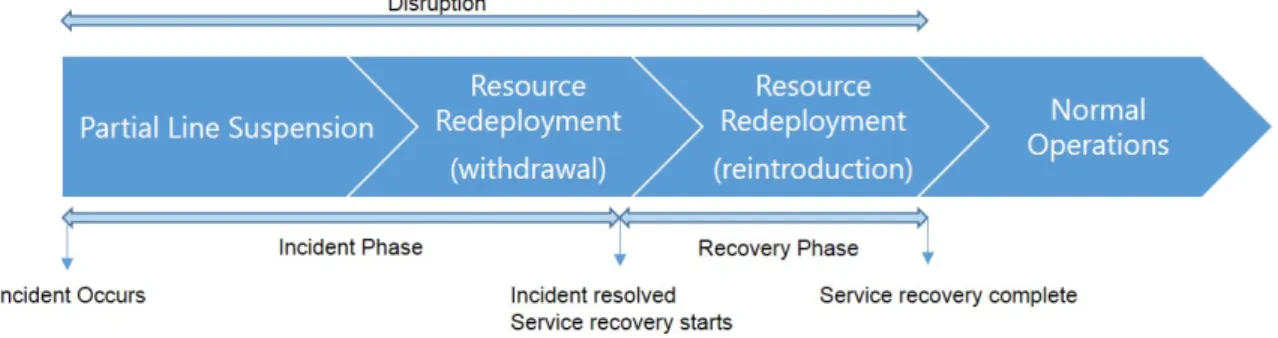
Incidents (due to equipment failures, passenger emergencies, infrastructure prob-lems, human errors, etc.) routinely occur in metro systems. Such incidents can cause significant disruptions in service (from slowdown to full closure of the line), with se-rious impacts on passengers, especially in the core of high frequency lines operating near capacity. Disruption consists of two distinct phases. The incident phase is the period from the start of the incident to the moment when its cause has been resolved. The second phase of the disruption is the recovery, which starts at the end of the in-cident and lasts until normal service is restored. Dealing efficiently with disruptions is crucial and agencies use real-time control strategies to mitigate those impacts and improve performance.
This thesis proposes an approach for supporting controllers decision-making in the recovery phase of disruption management. While the method is applied to the Piccadilly Line on the London Underground, It is applicable to other high frequency transit rail lines.
After reviewing the main challenges controllers face during incident management and the main strategies they use, the thesis formulates the recovery phase problem as an optimization problem that integrates timetable revision and crew rescheduling (train reformation problem, TRP).
The approach focuses on modeling common control strategies such as short-turning and train renumbering. It explicitly incorporates the scarcity of resources and associated constraints, especially with respect to crews. The method consists of two phases: the generation of a large number of candidate journeys; and the selection of the journeys (recovery timetable) that optimize some measure of performance, in-volving the effectiveness of the recovery and the passenger service.
The model is first applied to an incident that happened on January 2014 on the Piccadilly Line. The actual controllers response is compared with the output of the train reformation problem, and a sensitivity analysis of the model parame-ters is performed. The results suggest that using more complex reformations and less short-turns may lead to better passenger service during the recovery phase. The train reformation problem is then applied to a hypothetical incident. The results support current practices that canceling trains during the incident phase enables a shorter and more efficient recovery.
The results of the case studies also suggest that a decision support system for controllers has the potential to improve service recovery. The thesis concludes with recommendations for how a decision support system could be implemented in practice, and how the method could be extended to the incident phase of service disruptions. Thesis Supervisor: Nigel H.M. Wilson
Title: Professor of Civil and Environmental Engineering Thesis Supervisor: Haris N. Koutsopoulos
Title: Professor of Civil and Environmental Engineering Northeastern University
Acknowledgments
Before all, I would like to thank my research advisors, professors Nigel Wilson and Haris Koutsopoulos. Without your guidance, suggestions, knowledge, and even productive arguments, this thesis would have never been possible. I would also like to thank others at MIT, faculty and staff, in particular Ginny and Shannon.
I am very grateful to Transport for London who supported this research. I would like to thank especially Chris Baker, Dale Campbell, Nigel Kelt, Jemima Poole, Lau-ren Sager Weinstein, Chris Taggart, Andrew Toplis, and Sandra Wedell, for their time and advice. I would like to add special thanks to everyone in the Earl’s Court centre and in the crew depots, for having let me disturb them, and who help me discover so many fascinating facts about the Piccadilly Line.
I cannot forget to thank my friends in the Transit Lab: Steve Tuttle, Lauren Tarte and Gabriel Goulet-Langlois for the time we spent in London together; I must also mention the Transit Lab students of year ’14, who failed to sing my name correctly; every transit lab mate, who saw my progress in yoyo and juggling over the past two years; my MST classmates, for the coffee hours we spent together. Finally, thanks to all my friends I met in Boston, who have made these two years at MIT an incredible and extraordinary experience.
Contents
1 Introduction 17
1.1 Context and Motivation . . . 17
1.2 Objectives . . . 20
1.3 Research Approach . . . 21
1.4 Organization . . . 22
2 Disruption Management 25 2.1 High-Frequency Service . . . 25
2.2 Service Delivery Process . . . 26
2.3 Disruption . . . 27
2.4 Service Control . . . 28
2.4.1 Control Components . . . 29
2.4.2 Control Practices . . . 33
2.4.3 Emergency Timetable . . . 37
3 Introduction to the Piccadilly Line and Literature Review 39 3.1 Background . . . 39
3.1.1 Line Geometry . . . 40
3.1.2 Demand and Service . . . 43
3.1.3 Service Disruptions . . . 46
3.1.4 Service Control Organization . . . 48
3.2 Previous Research on Piccadilly Line . . . 51
3.3 Literature Review . . . 52 7
4 Decision Support Model: the Train Reformation Problem 57
4.1 The Train Reformation Problem . . . 58
4.2 Journey Generation . . . 62
4.2.1 Timetable Expansion . . . 62
4.2.2 Group Reformation . . . 64
4.2.3 Station Arrival and Departure Times . . . 66
4.3 Journey Selection . . . 69
4.3.1 Objective Function . . . 70
4.3.2 Constraints . . . 74
4.4 Extension to the Incident Phase . . . 77
4.4.1 Incident Phase Performance Model . . . 77
4.4.2 Uncertainty Modeling . . . 79
5 Train Reformation Problem: Implementation 85 5.1 Journey Generation . . . 86
5.1.1 Timetable Expansion Stage . . . 86
5.1.2 Reformation Stage . . . 92
5.1.3 Station Arrival and Departure Times . . . 98
5.2 Journey Selection . . . 100 5.2.1 Objective Function . . . 100 5.2.2 Constraints . . . 108 5.3 Post-processing . . . 110 5.3.1 Fine-Tuning Module . . . 110 5.3.2 TSM . . . 112 6 Application 117 6.1 01/14/14 Incident . . . 117 6.1.1 Controllers Response . . . 118
6.1.2 Results and Comparisons . . . 124
6.2 Hypothetical Incident . . . 137
6.2.1 Incident Description . . . 138 8
6.2.2 Results . . . 139 7 Conclusion 147 7.1 Research Summary . . . 147 7.2 Recommendations . . . 150 7.3 Limitations . . . 151 7.4 Future Research . . . 152 9
List of Figures
1-1 Disruption Process . . . 19
1-2 Train Reformation Problem Structure . . . 22
2-1 Disruption Process . . . 29
2-2 Control System and its application to disruption management . . . . 30
2-3 Short-turn Example . . . 34
2-4 Renumbering Example . . . 36
3-1 Piccadilly Line . . . 40
3-2 Heathrow Branch Tracks . . . 41
3-3 Uxbridge Branch Tracks . . . 42
3-4 Tracks Shared with the District Line . . . 42
3-5 East End Tracks . . . 42
3-6 Passenger Flow during 30-min Peak of the Peak, Eastbound . . . 44
3-7 Passenger Flow during 30-min Peak of the Peak, Westbound . . . 45
3-8 Incident Cause Distribution . . . 47
3-9 Delay caused by Signal Failure (Data from 2013-2014) . . . 47
3-10 Incidents by Time of Day (Data from 2013-2014) . . . 48
3-11 Number of Incidents per Location (Data from 2013-2014) . . . 50
3-12 Control Environment of the Piccadilly Line . . . 51
4-1 Train Reformation Problem Inputs and Output . . . 59
4-2 Structure of the Train Reformation Problem . . . 59
4-3 Timetable Extension: Basic Operations . . . 63 11
4-4 Reformation Example . . . 66
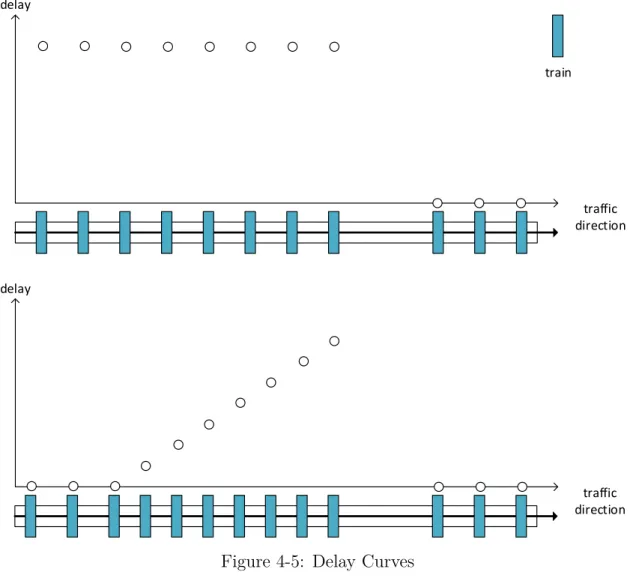
4-5 Delay Curves . . . 68
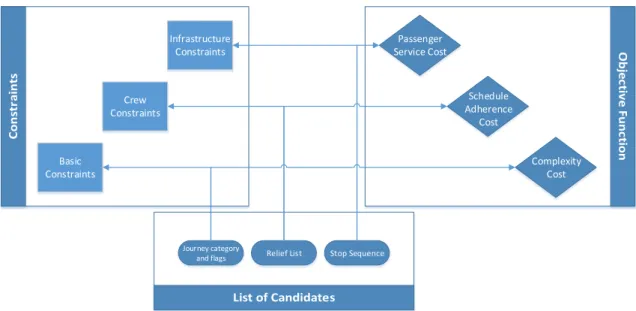
4-6 Optimization Structure . . . 70
4-7 Speed curves . . . 80
4-8 Trajectories and Speeds under the Speed Model . . . 80
4-9 Probabilistic TRP Example . . . 83
5-1 Line Geometry as Implemented . . . 86
5-2 Algorithm (1) Flowchart . . . 89
5-3 Journey Generation Tree . . . 91
5-4 Reformation Flowchart . . . 95
5-5 Stop Time Calculation Flowchart . . . 99
5-6 Full Demand Matrix ∆t . . . 101
5-7 Curves of λ for different time periods . . . . 104
5-8 fw against the Actual Waiting Time Function . . . 106
5-9 Swap Roles in the Journey Assignement . . . 107
6-1 Incident Location . . . 118
6-2 14/01/14 Incident Phase . . . 119
6-3 Actual (scheduled) Timetable Time-Space Diagram . . . 120
6-4 Controllers Response Time-Space Diagram . . . 122
6-5 Scheduled and Actual Headways . . . 123
6-6 Effect of Complexity Cost . . . 128
6-7 Scenario K Time-Space Diagram . . . 129
6-8 Time-space Diagrams, Westbound . . . 130
6-9 Time-space Diagrams, Eastbound . . . 131
6-10 Train departures at key stations . . . 132
6-11 Waiting times at various locations as a function of time of day . . . . 134
6-12 Scenario G Reformations . . . 136
6-13 Delay at the End of the Incident . . . 139
6-14 Influence of αcan. . . 142 12
6-15 Waiting times at various locations . . . 144 6-16 TRP solutions recovery plans . . . 146
List of Tables
3.1 Top 20 Incident Locations in 2013 and 2014 . . . 49
5.1 Stop sequence of journey C01 . . . 90
5.2 Group Formation . . . 96
5.3 Group (A,15:45) . . . 96
5.4 Group (B,15:45) . . . 96
5.5 Station Arrival/Departure Calculation Example . . . 100
5.6 Recovery Timetable before the Fine-tuning algorithm . . . 112
5.7 Recovery Timetable after one iteration . . . 113
6.1 Scenario parameters . . . 125
6.2 Scenario results . . . 127
6.3 Waiting Time at key stations during the Recovery Phase . . . 135
6.4 Scenario parameters . . . 140
6.5 Scenario results . . . 141
6.6 Waiting Time at key stations during the Recovery Phase . . . 143
Chapter 1
Introduction
This thesis presents an optimization model aimed at improving the disruption management process on high-frequency transit rail lines. Disruptions impact passen-gers dramatically and improving how they are handled is challenging. As part of the larger objective of building a decision support system for rail service controllers, the first part of the thesis focuses on the challenges that controllers face during service control. It then describes a method aimed at supporting real-time decision-making, especially by targeting the strategies required in the second phase of a disruption, referred to as the recovery phase, which is the period between the end of an inci-dent and the time when the service returns to the normal schedule. The model is implemented and tested for the recovery phase of incidents on the Piccadilly Line.
1.1
Context and Motivation
Operations in public transit are planned in advance. The timetable, that contains information about the trips operated, their timing, and the vehicle and crew schedule, is developed typically on a 3 months to multi-year cycle. On a daily basis, the service experienced by passengers differs from the service planned, because of unexpected events called disruptions. Transport for London defines a disruption by: ”disruption occurs where an incident causes the train service or the station service to be inter-rupted” (London, 2014a).
On high-frequency lines, the impact of disruptions on passengers and operations can be huge and this is even more true when the line operates at, or near, capacity. Because of the high-frequency, disruptions can propagate much faster than on low frequency services. It is harder to recover from a delay on a congested line, because there is less flexibility to move trains and change their routes. As a result, disrup-tions can have a dramatic impact on service reliability and become a major source of inconvenience for passengers. For instance, Transport for London estimates that during the 1-year period from April 1 2014 to March 31 2015, customers lost more than 18 million hours in the underground network due to incidents (London, 2014a).
Disruption management is the process of dealing with incidents in order to mit-igate their effects, and consists of two distinct phases, as illustrated in Figure 1-1. The incident phase is the period from the start of the incident to the time when its cause has been resolved. During this phase, the first consideration is safety, then canceling trains to prepare for the recovery. The second phase of the disruption is the recovery, that starts at the end of the incident and lasts until normal service is restored. In this phase, the priority is to return to scheduled service as fast as possible.
On high-frequency transit lines, disruptions happen almost every day, and their importance varies widely: from a localized delay which will recover naturally to a total shutdown of the system. For instance, a single signal failure was serious enough to delay passengers for more than 84000 passenger-hours in the Piccadilly Line on February 2013 (London, 2015).
If an incident disrupts the service, following the scheduled timetable without any modification becomes difficult. Service controllers are in charge of adapting the ser-vice to these new constraints. Based on how much the serser-vice has deviated from the schedule, controllers decide to change the train itineraries in order to provide
gers with good service and return to scheduled service quickly. The time horizon for control is much shorter than for scheduling: in the case of a disruption, decisions must be taken in real time. Controllers must constantly decide what service interventions (that consists of re-timing or rerouting trips) are needed in the next few minutes to safely mitigate the impact of the disruption.
Figure 1-1: Disruption Process
Despite the importance of service control, there is no systematic way to handle disruptions. Controllers usually work in small teams, their decisions are often based on experience and rules of thumb. They operate with other teams (e.g. signaling) as they collect information to make decisions. In managing disruptions, controllers must process a constant and complex flow of information. They take decisions to relieve the emergency, given the information available. It is difficult to take into account the impact of their decisions over the next few hours until the end of the disruption. Moreover, the emergency nature of incident management prevents controllers from testing new techniques. In this conservative environment, it is not possible to test two different strategies for similar incidents, due to potentially severe impacts on passen-gers. As a result, it is also difficult to identify (and document) alternative strategies for similar incidents that could be effectively compared and assessed.
Many system performance measures are based on disruptions and their impact. These measures are communicated to the public or are used as business targets (e.g. % of scheduled trips completed, hours lost by customers because of incidents). However,
these metrics are measured at an aggregate level based on the service provided, and do not account for the strategies used in the disruption. The gap between operational targets, passenger service, and controller objectives sometimes leads to decisions that are not consistent. Having a tool that balances passenger and controller objectives is an important goal of this research.
Although many models for timetable development, rolling stock scheduling, and crew scheduling exist, few address the issue of rescheduling in case of incidents on a subway line. Most often, existing rescheduling models have been applied in the context of bus routes or low frequency lines, or do not integrate vehicle and crew rescheduling. The characteristics of those environments differ from high-frequency rail lines.
1.2
Objectives
This research aims at improving the disruption management process. To do so, the research has targeted two main objectives:
To develop a framework for modeling service control in rail transit lines.
The lack of models for service control for high-frequency lines must be addressed. This framework should be general enough to be applicable accross systems. It should also focus on what controllers do. Understanding their strategies is crucial and few disruption tools are designed to be used b,y and to support, controllers.
To develop a tool to support controllers for the recovery phase, either in real time or offline. An offline tool could be used to assess alternative control
strategies. A real-time tool that would assist controllers is a longer term goal. The main objective of this thesis therefore, is to develop and evaluate the main principles on which to build such a tool. Targeting the recovery phase initially, as opposed the full problem of incident and recovery management, provides
a good starting point. It largely avoids the problem of uncertainty. At the same time, a recovery tool is a good way to test the general approach, and, if successful, could be valuable to controllers.
1.3
Research Approach
Decision Support for Disruption Management is a long term research project that
has been conducted for Transport for London (TfL). The research project is com-posed of three main phases. The first phase aims at advancing the understanding of disruptions and their management. The second phase focuses on designing a more robust crew schedule. This work is part of the third phase of the project, the devel-opment of real-time control strategies. More specifically, this study aims at providing controllers with real-time control strategy guidelines.
To do so, an optimization framework is developed in order to model the service and its control during recovery from service disruptions. The main element of the framework is the solution to what is called in this thesis, the Train Reformation Problem (TRP). The framework models service in a way that remains fairly close to what controllers experience every day. It puts an emphasis on the main strategies they apply, using similar information that controllers would have: the recovery is based on the schedule and is constrained by drivers and infrastructure. The value of information is crucial, as the complexity of the control decisions depends on the accuracy of the information available. The train reformation problem uses the same stream of information that controllers have, or could have, but over a longer period of time. When controllers can process the impact of their decision for the next hour based on the current situation, the TRP includes the impacts of interventions on the full recovery.
The structure of the problem is illustrated by Figure 1-2. It focuses on the two main recovery strategies (short-turns and reformations) and consists of two phases.
In the first phase of the TRP, the journey generation phase, journeys that represent a large number of possible short-turns and reformationss are generated. In the second phase, the journey assignment, a recovery plan accounting for the operational con-straints (e.g. infrastructure and driver related concon-straints) and targets (e.g. providing a good passenger service and coming back to schedule) is obtained. The problem in this phase is formulated as an integer linear program and incorporates the above con-siderations, both in the objective function and the constraints. The solution to the TRP provides a recovery plan given the situation of the end of the incident phase. The impact of the decisions are evaluated for the full recovery period. The approach is implemented and tested on the Piccadilly Line in London.
Journey Generation Input Candidate Journeys Journey Selection Optimal Solution Constraints
Figure 1-2: Train Reformation Problem Structure
1.4
Organization
Chapter 2 introduces disruption management. It highlights the challenges spe-cific to high-frequency transit lines, and describes the classic service delivery cycle. It then focuses on disruptions, their causes and impacts, and explains the different components and factors involved in real-time service control. Finally, it discusses the different control practices and strategies.
Chapter 3 briefly describes the Piccadilly line, its main characteristics, its ge-ometry, and the operation of the line. It then conducts a literature review about scheduling and disruption rescheduling approaches.
Chapter 4 describes the general approach of the Train Reformation Problem. It explains how the components of service control are modeled and describes the two phases of the problem. It also suggests ways to deal with the uncertainty of an inci-dent in terms of its duration.
Chapter 5 explores the model implementation in the context of the Piccadilly Line. It details additional assumptions required in order to apply the general framework accounting for the characteristics of the Piccadilly Line. It presents the constraints that are in place, and how the Train Reformation Problem has been adapted to the recovery phase.
Chapter 6 applies the method in two cases: an actual incident and a hypothetical one. The first case study deals with an incident that occurred in January 2014 and examines the application of the methodology to the recovery phase. The second case study is a hypothetical incident to examine the interconnections between decisions in the incident phase and the recovery phase. It reports and analyses the results, and compares, where applicable, these results with how controllers actually managed the incident.
Chapter 7 summarizes the approach of the Train Reformation Problem and high-lights its strengths and weaknesses. It also makes recommendations about how this research can be used in London and in other systems. Finally, itsuggests ways for researchers to build upon the model and to improve disruption management.
Chapter 2
Disruption Management
This chapter describes the general framework for disruption management. Section 2.1 explains the specificity of high-frequency rail lines. Section 2.2 describes the process that leads to service delivery. Section 2.3 shows how disruptions impact the service, and section 2.4 details the process of managing the service in case of disruptions.
2.1
High-Frequency Service
Service frequency is a very important attribute of a line, because it impacts both the operations side (service constraints) and the passenger side (passenger behavior). This research focuses on high-frequency lines, which come with specific challenges. In low-frequency services, the timetable is very important, as passengers coordinate their arrival with the trip departure time. As a result, the key metric for low-frequency services is on-time performance.
In high-frequency services, customer behavior is different, with passengers arriv-ing at the stations more or less randomly. They only know the frequency and the timetable is often not even communicated. The important performance metric in this case is waiting time, which is a function of headway and service reliability.
Another attribute of high-frequency lines is that they serve more passengers. They operate closer to capacity to accommodate the demand: higher frequency means more trains, which implies more congestion on the line, which in turn limits the possibilities of delaying trains, and rerouting trains. Canceling a train in high-frequency services is only a minor inconvenience. Though it impacts the crowding and reduces the capac-ity, it does not prevent passengers from completing their trips, more or less as planned.
Therefore, the operating environment of rail high-frequency transit lines is dif-ferent from lower frequency services. This difference has a direct impact on the disruption management.
2.2
Service Delivery Process
To understand how the service is managed in case of disruptions, it is important to understand how the service is planned. The first step of service planning is to estimate the demand to decide the span and the frequency of the service. The frequency of the line, expressed in trains per hour, depends on the passenger demand and historical data but is also constrained by the capacity of the infrastructure, and the resources (drivers and trains) available. Establishing a timetable that determines the route and the timing of trips which achieve the service targets is an important next step. The recovery time, i.e. the amount of time between two consecutive trips used to recover operational delays, the capacity of the depots, and the numbers of trains available are accounted for in the timetable development phase. The next step is rolling stock scheduling, which determines what trains will cover the trips of the timetable. During this phase, the number and locations of spare trains are also decided. The last step of the scheduling process is the crew scheduling. Shifts that cover the trips of the timetable are created, and operators are assigned to these shifts. Drivers may drive several trains during their shift. Each of these driving periods is called a driving task. The crew shifts must account for the labor rules, the number of drivers available,
and the crew facilities. These steps are conducted essentially sequentially, and the scheduling process takes several months and is typically repeated two to three times a year.
The operations are managed daily, based on the service plan. Even if the timetable is not communicated to the public, it remains crucial from an operational point of view, as it specifies what the drivers and trains must do. The actual service delivered, which is experienced by passengers, is different from the service plan, because the operations are by nature uncertain (because of passengers, drivers, potential failures, etc.). The role of service controllers is to adapt the service in case of unexpected events on the line.
2.3
Disruption
A high-frequency transit line is a complex system, and deviations from normal service cannot be avoided. The line is subject to natural variability and perturba-tions that prevent the exact deployment of the timetable on any given day. Small perturbations are called disturbances. Disturbances are expected and caused when normal events (such as driving time between two stations, or dwell time at stations) last longer than expected. Disturbances impact the general reliability of the line and may degrade the operational performance. However, the service can recover from disturbances, due to the slack time between consecutive trips.
On the other hand, disruptions are unexpected events that lead to larger pertur-bations. In case of disruptions, the timetable is not able to absorb the delays. It is necessary to adapt the operating plan to recover from the delay and return to normal service. In general, disruptions can lead to large delays, poor service and cancellations.
As willed be discussed in chapter 3, causes of incidents vary. Incidents may be 27
caused by passengers (passenger sick on train, suicide) or supply related events (driver not available, signal failure, train failure, etc.). However, the impact of the incident on the operating side can manifest itself in only a few different ways. A number of incident types result in a blockage of a section of the tracks. As high-frequency lines generally have only a single track in each direction, the local blockage propagates and leads to a blockage of the line. A disruption can also lead to reduced capacity of the line: in some cases, disruptions prevent trains from moving at full speed, which reduces the capacity. For instance, a train failure or a signal passed at danger does not necessarily block the line, but it reduces the speed of the train. Disruptions can also impact a station. For instance, a terrorist alert at a station can lead to a sta-tion closure, without blocking the line. Disrupsta-tions can also impact a single train, without affecting the rest of the line. This may happen, for example, if the driver is late and fails to start their shift on time, or when a problem disables a train in depot.
A disruption can be divided into two phases, as illustrated in Figure 2-1. The incident phase is the period from the start of the incident to the time when its cause has been resolved. The environment during the incident phase is very uncertain, especially at the start of the incident. Before the cause of the incident is identified, since controllers have no information about the cause, they are also unsure about its severity and likely duration. Later in the incident phase, the duration of the incident can sometimes be estimated, but the uncertainty still remains. The primary delay caused by the incident is propagated to other trains on the line (known as the knock-on effect). The secknock-ond phase of the disruptiknock-on is the recovery, that starts at the end of the incident and lasts until normal service is restored.
2.4
Service Control
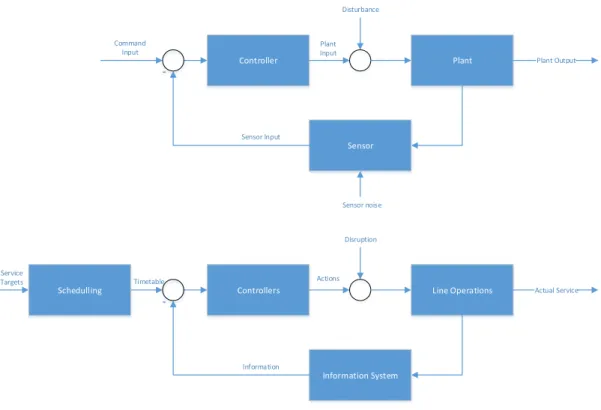
In control theory, a controller is a system component that receives a command output and a feedback signal, and uses them to provide the input to the ”plant” (see Figure 2-2), which is the component that provides the final output. Figure 2-2
Figure 2-1: Disruption Process
illustrates the similarity in the structure of transit service control and a theoretical control system. The first diagram (adapted from the book Feedback control theory Doyle et al., 1992), illustrates the general structure of a control-based system. In control theory, a disturbance signal is added to the command inputs, which makes the plant output different than expected from just the command. Adding a feedback loop and a controller addresses the error issue: a controller acts on both the command input and a measure of the output in order to provide a corrected input to the plant. Disruption management in public transit uses the same principles, where the timetable is the command input. Controllers’ role is to make sure that the service follows the timetable, even if the conditions change continuously due to unexpected events.
2.4.1
Control Components
The difference in the environment of the incident phase and the recovery phase leads to two different control behaviors. During the incident phase, the uncertainty and the congestion on the line lead controllers to reduce the service: they cancel trains, which give them more flexibility to recover in case the incident is longer than expected. The recovery phase is less uncertain. The controllers reintroduce trains and try to recover from the delay. During this process controllers make decisions guided by several objectives and constraints. The first priority of disruption management is to ensure the safety of passengers and staff. This sometimes requires canceling or holding trains, to avoid putting passengers and staff at risk. Even if this safety protocol often exacerbates the delay caused by the incident, safety must remain the
Controller Plant Sensor Plant Input Plant Output Command Input Disturbance Sensor Input Sensor noise
-Controllers Line Operations
Information System Actions Actual Service Timetable Disruption Information -Schedulling Service Targets
Figure 2-2: Control System and its application to disruption management
first priority at all times.
After safety, controllers aim at ensuring good passenger service in spite of the disruption. For this reason, controllers adapt the service in order to:
Carry as many passengers as possible: High-frequency subway lines often
oper-ate close to capacity. The delays and other constraints resulting from disrup-tions lead to a reduction in the number of passengers carried. Hence, providing enough capacity so that passengers can reach their destinations is a priority.
Reduce the travel time: Blockages and delays lead to longer travel times.
Man-aging disruptions requires reducing both waiting times and in vehicle travel time.
Reduce crowding: Disruptions lead to longer headways. Longer headways mean
that more passengers are waiting on the platform for the next train, which 30
leads to crowding on the platforms, denied boardings, and in-vehicle crowding. Crowding is very uncomfortable and is a major source of inconvenience.
When the line operates near capacity, the delay caused by the incident leads to a gap in service downstream. Trains are concentrated upstream from the incident location, which challenges the capacity even more. The throughput is affected by the following parameters:
Signaling capacity: The signal system is one of the main bottlenecks of a train
system. To prevent collisions, the signal control system prevents train from entering a track section if the next section is not free. Signal spacing is the main determinant of the minimum headway between two trains. Therefore, controllers must ensure that the number of trains in a section can be accommo-dated.
Track capacity: Most sections of high-frequency lines are single track. That means
that the service must be suspended if a train blocks the track. Location of sections with more than one track, or with reversing capacity is important, since many control interventions happen there.
Location of the trains: Controllers need to consider where the trains are, and
which ones are available for service. They may also have the possibility to use spare trains to replace a disabled train, or to support sections of the line operating with reduced traffic.
Location of the train depots: When not in service, trains must be in sidings or
in depots. Moreover, the number of trains at each depot at the end of day, the stock balance, must respect the timetable.
In addition to capacity, controllers have to deal with driver-related constraints. If the timetable becomes infeasible during disruptions, controllers can change it. The crew timetable does not have such flexibility. It restricts control actions during re-covery, because it is subject to more constraints. The crew timetable is composed of driver shifts, that are each composed of several tasks, which consist of driving a
train for part of the day. The shifts must respect driver work rules. For example, the work time over a day, a half day, and even for each task is limited. Unlike trains, drivers are not available before the beginning of their shift. After the scheduled end of their shift, even if their last task is not completed, on some systems, drivers cannot be required to work overtime. Similarly to the trains, train operators must start and finish their shift at their home depots, but unlike trains, actual shifts must happen within the scheduled period. Controllers must also be aware that spare drivers may be available to be used on short notice.
Accounting for all these constraints and objectives is very challenging. There is too much information to digest in real time. In some cases, such as the Piccadilly Line, the tasks of managing the crew and the schedule during a disruption are not handled by the same person. To be able to manage the service efficiently, it is important to set manageable, intermediate goals. For instance, maintaining even headways at key stations is a simple intermediate goal that helps to provide good passenger service. Balancing the sequence of the trip destinations, especially for lines with branches, is also a simple way to ensure that passengers will not wait too long before a train arrives that serves their destinations.
But the most important intermediate goal for controllers is to bring the service back to schedule as soon as possible after an incident. Controllers know that the schedule operates an even headway, under which passenger travel times are low. Con-trollers also know that the drivers work rules are satisfied by the schedule. Therefore, it is very attractive to try to return to schedule. The problem lies in the transition from the disrupted state to the normal schedule. To be able to recover quickly, it is easier to cancel more trains, that will be later reintroduced . Therefore, there is a trade-off between ”cut deep” and recovering quickly, and maintaining a good service during a (longer) recovery.
2.4.2
Control Practices
Controllers use a number of strategies to modify the schedule to recover from delays.
Running Time changes: Slowing down a train can be used to make headways more
even, or to change the train order at junctions.
Holding: Holding a train is the action of stopping a train and delaying its
depar-ture. Most holding takes place at stations. Holding is required in the case of a blockage during the incident phase. Holding can also be used to make headways more even and avoid trains bunching, to reorder trains at junctions, or to wait for a late driver. Holding increases in-vehicle time.
Early dispatching: Is the opposite of holding. It consists of the train departing
early. It can be used to even headways, or to deal with expected longer dwell times during the trip.
Withdrawal: A train is withdrawn when it is prematurely diverted to a siding or to
a depot, before it completes its trip. Passengers must vacate the train before its withdrawal. Withdrawal relieves the train congestion on the line, and enables more flexibility in the recovery, by having one more driver and train available later on.
Short-turn: A train is short-turned if it is reversed before reaching its scheduled
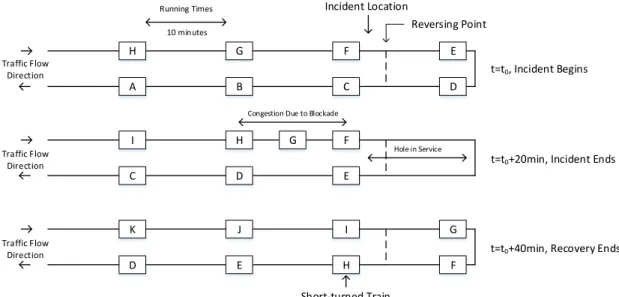
destination. Short-turning facilitates recovering delay, and filling a gap in ser-vice in the other direction. Figure 2-3 illustrates an example of serser-vice recovery using a short-turn. A 20 minute incident happens in front of Train F, which causes a gap in service and congestion on the line. Short-turning Train H allows filling the service gap and returning to a normal schedule. Short-turning a train is inconvenient for passengers going to the end of the line, and for passengers originating at the end of the line, because the service is going to be less frequent.
Traffic Flow Direction A B C D E F G H F G H C D E D E H G I K J I F Running Times 10 minutes t=t0, Incident Begins
t=t0+20min, Incident Ends
t=t0+40min, Recovery Ends
Incident Location
Reversing Point
Congestion Due to Blockade
Hole in Service Short-turned Train Traffic Flow Direction Traffic Flow Direction
Figure 2-3: Short-turn Example
Extension: Opposite of short-turn. The train goes past its scheduled destination.
This allows serving more passengers, bringing back to schedule an early train, or filling a gap in the other direction.
Diversion: Consists of rerouting the train to a destination on another branch of
the line. It is used to avoid the incident location, and to add service to a branch impacted by the disruption. If the running time on the other branch is different, it is also a way to recover the delay or the earliness of the train. It can be inconvenient to passengers who must alight the train, if the diversion is decided after the beginning of their trip.
Expressing: Consists of skipping scheduled stops. Can be used to shorten the
dura-tion of the trip, but is mainly used to avoid an incident or for security reasons.
Cancellation: Consists of canceling an entire trip, as opposed to withdrawal where
the train is pulled out of service in the middle a trip. A withdrawal is often followed by the cancellation of the next scheduled trip. Like withdrawals, can-celing trains is used to relieve congestion on the line, make resources available later, and facilitate the reintroduction of the trains on time.
Adding an out-of-service trip: When a train must be moved from one depot or
siding to another, this intervention consists of moving the train without passen-gers. It can be used to re-balance the stock, or make a train available where it is needed.
Adding Service: Extra trips that were not scheduled on the timetable. It can be
used for the same reason as an out-of-service trip, but the train will stop at the stations between the two depots. It can also be a spare train used to provide passengers with more service, by filling a gap.
Adding a shuttle service: When the traffic is severely disrupted, short-turns can
be used heavily to recover delay. In this case, the section at the end of the line will suffer from low-frequency service. Adding a shuttle service at the end of the line allows serving passengers by bringing them to the stations where more trains are stopping. As the route served by the shuttle is usually short, a single shuttle train can often serve a section with a decent frequency, while other trains recover delay with short-turns.
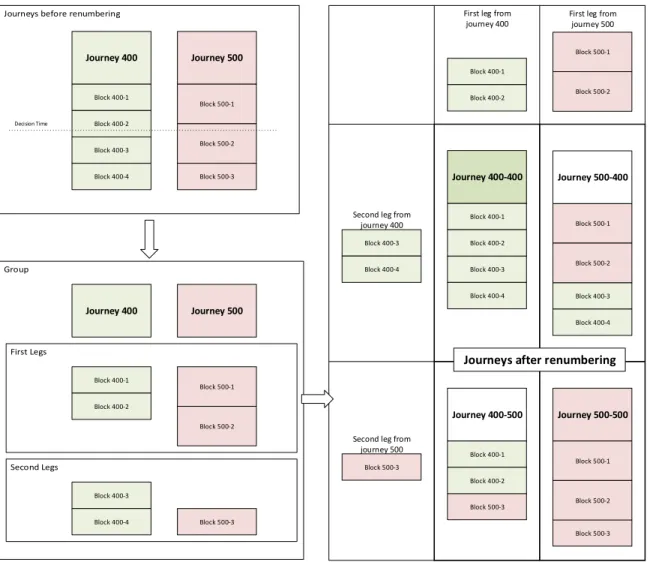
Renumbering: Renumbering (also called reforming) consists of changing the
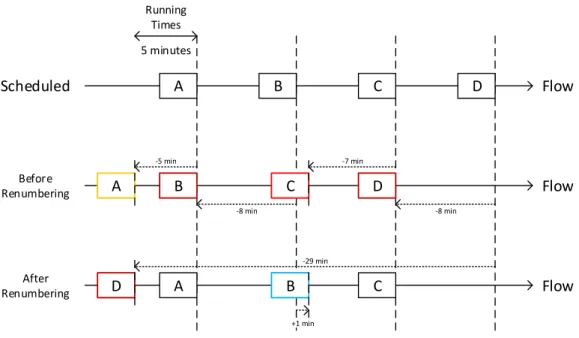
num-ber of a train unit. When the numnum-ber changes, the train must operate a new set of trips from the timetable. It is often used in conjunction with short-turns, extensions, and diversions. Figure 2-4 illustrates the utility of renumbering trains. The first line shows where trains A to D should be located, according to the service timetable. However, Train A is 5 minutes late, trains B and D 8 minutes, and train C 7 minutes. By changing the train numbers (A becomes D, B becomes A, C becomes B and D becomes C), the total delay is transferred to the new train D, which is now 29 minutes late, while the three other trains are now on time. A single short-turn of train D, combined with the renumbering, allows the recovery of 4 trains. Moreover, passengers of the renumbered trains are not impacted if the destinations are unchanged.
Stock Renumbering: Stock renumbering consists of renumbering one train in
ser-vice with one spare train. If Train A is running late at the end of its first trip, 35
A B C D A B C D D A B C Flow Flow Flow Running Times 5 minutes Scheduled Before Renumbering After Renumbering -8 min -29 min +1 min -8 min -5 min -7 min
Figure 2-4: Renumbering Example
it is possible to dispatch a spare train on time for the second trip. The spare train assumes the train number A. The original train A will finish its trip late, then replace the spare train in the depot.
Spare Driver Substitution: If a driver is not available for a trip, it is possible to
replace them with a spare driver.
Spare Driver Early Relief: If, because of the disruption, a driver cannot complete
their task without violating a work rule or being late for their next task, it is possible to use a spare driver to drive the train to complete the task. The relieved driver will be able to finish their task on time, or early enough to begin their next task on time.
Spare drivers are a scare resource, since they are mainly designed to replace drivers absent because of sickness. Furthermore, it is more difficult for a controller to keep track of drivers than monitoring trains. For both reasons, the management of the crew is often decentralized in the depots. In this organization structure, controllers do not have perfect information about crew availability. Their interventions are taken
based on where the drivers would be, assuming that the crew timetable was followed, and with the hope that the service interventions will be compatible with the crew availability.
The combination of short-turn/renumbering is one of the most common strategies. It has the advantage of reducing the delay of several trains with a minimum number of train reroutings. However, renumbering does not reduce the driver delay. For this reason, renumbering is particularly attractive just before reliefs. If a train is renumbered well in advance their relief, its driver will have to drive trips that are likely not compatible with their own constraints: the relief time and location of the new train number might not be consistent. However, if the relief happens close to the end of the driver task, a new driver will soon take over the renumbered train. For the new driver, it does not matter that the train has been previously renumbered. Because they are both common and effective, this thesis focuses the short-turn and renumbering strategies.
2.4.3
Emergency Timetable
When a disruption is extremely severe, it may be difficult to recover enough delay to return to the timetable. In such cases, controllers may introduce an emergency timetable. An emergency timetable consists of operating a limited service until the end of the day. The emergency timetable is not strictly a timetable: the timing of the trips is not known exactly. The emergency timetable is based on the fact that if headways are increased, the available resources (trains and drivers) will be sufficient to operate without requiring a detailed working timetable. If a driver must finish their duty, due to limited service, it is very likely that another driver will be available to run the next trip. Emergency timetables are not included in this research.
Chapter 3
Introduction to the Piccadilly Line
and Literature Review
The Piccadilly Line of the London Underground system is the subject of detailed analysis in this thesis. This chapter presents relevant information about the Piccadilly Line, focusing on the infrastructure, service characteristics, and demand. It also provides some background about the characteristics of the disruptions that take place as well as the structure and organization of the control system to deal with them. This chapter closes with a review of the relevant literature about disruption management and rescheduling.
3.1
Background
The Piccadilly Line is one of 11 lines of the London Underground (LU), the oldest subway system in the world. The ancestor of what would later become the London Underground started in 1863, when the Metropolitan Railway opened. Several other subway lines operated by different private companies were opened and all merged in 1933 into the ancestor of the London Underground, the London Passenger Transport Board. The central part of the Piccadilly Line was opened in 1906. The line was ex-tended in 1932 and 1933 and then did not have further major changes until Heathrow was added to the line in 1977. The line was extended to terminals 4 and 5 in 1994
and 2008 respectively.
3.1.1
Line Geometry
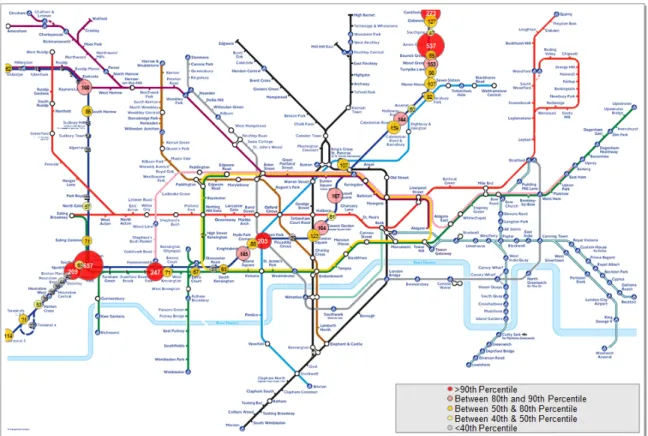
The Piccadilly Line is a very important part of the London transportation system (see Figure 3-1). It has three branches. The trunk starts at Acton Town and goes North-East to Cockfosters, passing through Central London. The stations from South Kensington to King’s Cross are major touristic destinations. The King’s Cross - St. Pancras station is a major hub with its transfers to 5 other underground lines, buses, regional and international trains.
Acton Town Ealing Common South Ealing Turnham Green Alperton Park Royal Sudbury Town Arnos Grove Bounds Green Southgate Arsenal Holloway Road Manor House Barons Court Earl's Court Hammersmith
Boston ManorNorthfields Osterley Wood Green Caledonian Road King's Cross St. Pancras Cockfosters Oakwood Covent Garden Holborn Leicester Square North Ealing Gloucester Road Eastcote RaynersLane
Ruislip Manor
South Kensington
Knightsbridge Picadilly Circus Green Park Hyde Park Corner
Hatton Cross Heathrow Terminals1, 2 & 3 Heathrow Terminal 4 Hounslow West Hillingdon Ickenham Uxbridge Russell Square HounslowCentral Hounslow East Ruislip Turnpike Lane South Harrow Sudbury Hill Finsbury Park Heathrow Terminal 5 Page 1 of 1 3/25/2015 file:///D:/Users/mich/Dropbox%20(MIT)/Lab/reports/Piccadilly_Line.svg
Figure 3-1: Piccadilly Line
On the West side, the Piccadilly Line is the only underground line to serve Heathrow, offering a less expensive and more accessible alternative compared to other trains, such as the Heathrow Express and Heathrow Connect. Figure 3-2 shows the layout of the tracks on the Heathrow branch. Acton Town is a very important station,
as it is the last station before the line splits into two branches. It is also a crew depot, and a main reversing facility, with sidings to the east and west of the station. North-fields is the major train depot on the west part of the line, and is also a smaller crew depot. There are other reversing points, at South Ealing, Boston Manor, Hounslow Central and Hatton Cross, but they are used very rarely.
R i v e r T h a m e s HOLBORN COVENT GARDEN LEICESTER SQUARE RUSSELL SQUARE PICCADILLY CIRCUS KING’S CROSS GREEN PARK SOUTH KENSINGTON GLOUCESTER ROAD EARL’S COURT
HYDE PARK CORNER Down Street KNIGHTSBRIDGE Brompton Road COCKFOSTERS SOUTHGATE BOSTON MANOR RUISLIP UXBRIDGE EASTCOTE RAYNERS LANE
RUISLIP MANOR FINSBURY PARK
York Road CALEDONIAN ROAD HOLLOWAY ROAD ARSENAL MANOR HOUSE TURNPIKE LANE WOOD GREEN BOUNDS GREEN ARNOS GROVE OAKWOOD NORTH GREENWICH CANARY WHARF CLAPHAM COMMON SOUTH WIMBLEDON COLLIERS WOOD TOOTING BROADWAY TOOTING BEC BALHAM CLAPHAM SOUTH MORDEN HAMMERSMITH BARONS ACTON TOWN CHISWICK PARK TURNHAM GREEN STAMFORD BROOK RAVENSCOURT PARK EALING COMMON SOUTH EALING NORTHFIELDS OSTERLEY Osterley & Spring Grove
HOUNSLOW WEST HOUNSLOW EAST HOUNSLOW CENTRAL HATTON CROSS HEATHROW TERMINALS 1, 2, 3 HEATHROW TERMINAL 4 PARK ROYAL NORTH EALING SOUTH HARROW SUDBURY HILL SUDBURY TOWN ALPERTON ICKENHAM HILLINGDON HEATHROW TERMINAL 5 Cockfosters Depot Ealing Common Depot Arnos Grove Stabling Sidings Uxbridge Stabling Sidings South Harrow Stabling Sidings Acton Engineering Works London Transport Museum Northfields Depot Morden Depot Ruislip Siding PicEx Junction Hanger Lane Junction Rayners Lane Junction King’s Cross Loop Barons Court Siding Royal Victoria West Silvertown Southall Brentford Goods FINCHLEY CENTRAL EAST FINCHLEY ARCHWAY COLINDALE GOLDERS GREEN HAMPSTEAD MORNINGTON CRESCENT CHARING CROSS EUSTON MOORGATE KENNINGTON STOCKWELL TOOTING BROADWAY N-S and S-N N-S and S-N N-S only N-S only N-S and S-N N-S and S-N N-S and S-N N-S and S-N N-S and S-N N-S and S-N S-N only N-S and S-N S-N only
Bank branch only
NORTHERN LINE CANONS PARK WEMBLEY PARK NEASDEN WILLESDEN GREEN WEST HAMPSTEAD FINCHLEY ROAD GREEN PARK WATERLOO LONDON BRIDGE CANARY WHARF NORTH GREENWICH WEST HAM N-S only N-S and S-N N-S and S-N N-S and S-N N-S and S-N N-S and S-N S-N only W-E and E-W W-E and E-W W-E and E-W W-E and E-W E-W only
Via Stanmore sidings N-S via depot Via siding Via siding Via Charing Cross
Via Stratford Market depot and by main line shunt
JUBILEE LINE OAKWOOD ARNOS GROVE WOOD GREEN KING’S CROSS GREEN PARK HYDE PARK CORNER BARONS COURT HAMMERSMITH ACTON TOWN EALING COMMON NORTHFIELDS OSTERLEY HOUNSLOW CENTRAL HATTON CROSS HEATHROW T1, 2, 3 SOUTH HARROW RAYNERS LANE RUISLIP ICKENHAM HILLINGDON E-W only W-E and E-W E-W only W-E and E-W W-E only W-E and E-W W-E only W-E and E-W W-E and E-W W-E and E-W W-E and E-W E-W only W-E only W-E only
W-E only W-E and E-W W-E and E-W W-E only E-W only W-E only
W-E via depot with pilot Not normally used E-W which involves shunt via siding Reversing via Northfields depot
Trains can be signalled to Heathrow T1, 2, 3 either via T4 or directly
E-W via sidings Via Ruislip siding crossover Via Uxbridge sidings
PICCADILLY LINE The colours indicate the predominant line usage.
Some trains operate on track of other lines.
Tunnel station with single ‘island’ platform
Tunnel station with separate connecting platforms
Tunnel station with individual platforms
Disused station
Surface station with single ‘island’ platform
Surface station with individual platforms
Disused station
National Rail platforms
National Rail platforms not in scheduled use
TUNNEL SE CTION SURF A CE SE CTION Bakerloo line Central line District line
Hammersmith & City line Jubilee line
Metropolitan line Northern line Piccadilly line Victoria line Waterloo & City line Docklands Light Railway
Network Rail tracks (and LU tracks not used by LU trains); mostly simplified, but a single line indicates single track and double lines indicate twin or multiple tracks
Depot or Siding in line colour
(track layout is simplified within the tinted area)
Engineering or other facilities not belonging to an individual line (track layout is simplified within the tinted area)
(Kilburn High Road to Harrow & Wealdstone is owned and signalled by Network Rail)
(Gunnersbury to Richmond is owned and signalled by Network Rail; Putney Bridge to Wimbledon is signalled by Network Rail)
The colours of the platforms correspond to the relevant line management and do not indicate management responsibility of the station.
DEBDEN HANGER LANE WANSTEAD HOLBORN REDBRIDGE British Museum UPMINSTER HORNCHURCH Hainault Depot Osterley & Spring Grove
Operations Track Overview
Jubilee, Northern & Piccadilly lines
January 2013 © Transport for London
TUNNELS and PLATFORMS
TRACK
REVERSING LOCATIONS
Key to Colours and Symbols
This Diagram is Not to Scale
Acton Works
OTO-JNP v1.4 16.1.2013 Figure 3-2: Heathrow Branch Tracks
The Uxbridge branch is the North-West part of the line. There are no reversing points and facilities between Acton Town and South Arrow. Figure 3-3 shows the track layout between Subdury Town and Uxbridge. South Arrow is a small depot where some trains are stored overnight. From Rayners Lane to Uxbridge, the line is also served by the Metropolitan Line. The Uxbridge Stabling and Ruislip sidings are used by the Metropolitan and Central Line, but not the Piccadilly Line.
Between Acton Town and Baron’s Court, the Piccadilly Line and the District Line (shown in green) share the same infrastructure, as shown in Figure 3-4. The Piccadilly trains use the two central tracks and do not stop between Hammersmith and Acton Town (except for Turnham Green in the early morning). Brompton Road and Down Street are disused stations that were closed before World War II. This part of the line has reversing facilities at Acton Town, between Hammersmith and Barons Court, at Hyde Park Corner, and Down Street.
R i v e r T h a m e s HOLBORN COVENT GARDEN LEICESTER SQUARE RUSSELL SQUARE PICCADILLY CIRCUS KING’S CROSS GREEN PARK SOUTH KENSINGTON GLOUCESTER ROAD EARL’S COURT
HYDE PARK CORNER
Down Street KNIGHTSBRIDGE Brompton Road COCKFOSTERS SOUTHGATE BOSTON MANOR RUISLIP UXBRIDGE EASTCOTE RAYNERS LANE RUISLIP MANOR FINSBURY PARK York Road CALEDONIAN ROAD HOLLOWAY ROAD ARSENAL MANOR HOUSE TURNPIKE LANE WOOD GREEN BOUNDS GREEN ARNOS GROVE OAKWOOD NORTH GREENWICH CANARY WHARF CLAPHAM COMMON SOUTH WIMBLEDON COLLIERS WOOD TOOTING BROADWAY TOOTING BEC BALHAM CLAPHAM SOUTH MORDEN HAMMERSMITH BARONS ACTON TOWN CHISWICK PARK TURNHAM GREEN STAMFORD BROOK RAVENSCOURT PARK EALING COMMON SOUTH EALING NORTHFIELDS OSTERLEY Osterley & Spring Grove
HOUNSLOW WEST HOUNSLOW EAST HOUNSLOW CENTRAL HATTON CROSS HEATHROW TERMINALS 1, 2, 3 HEATHROW TERMINAL 4 PARK ROYAL NORTH EALING SOUTH HARROW SUDBURY HILL SUDBURY TOWN ALPERTON ICKENHAM HILLINGDON HEATHROW TERMINAL 5 Cockfosters Depot Ealing Common Depot Arnos Grove Stabling Sidings Uxbridge Stabling Sidings South Harrow Stabling Sidings Acton Engineering Works London Transport Museum Northfields Depot Morden Depot Ruislip Siding PicEx Junction Hanger Lane Junction Rayners Lane Junction King’s Cross Loop Barons Court Siding Royal Victoria West Silvertown Southall Brentford Goods FINCHLEY CENTRAL EAST FINCHLEY ARCHWAY COLINDALE GOLDERS GREEN HAMPSTEAD MORNINGTON CRESCENT CHARING CROSS EUSTON MOORGATE KENNINGTON STOCKWELL TOOTING BROADWAY N-S and S-N N-S and S-N N-S only N-S only N-S and S-N N-S and S-N N-S and S-N N-S and S-N N-S and S-N N-S and S-N S-N only N-S and S-N S-N only
Bank branch only
NORTHERN LINE CANONS PARK WEMBLEY PARK NEASDEN WILLESDEN GREEN WEST HAMPSTEAD FINCHLEY ROAD GREEN PARK WATERLOO LONDON BRIDGE CANARY WHARF NORTH GREENWICH WEST HAM N-S only N-S and S-N N-S and S-N N-S and S-N N-S and S-N N-S and S-N S-N only W-E and E-W W-E and E-W W-E and E-W W-E and E-W E-W only
Via Stanmore sidings
N-S via depot Via siding Via siding
Via Charing Cross
Via Stratford Market depot and by main line shunt
JUBILEE LINE OAKWOOD ARNOS GROVE WOOD GREEN KING’S CROSS GREEN PARK HYDE PARK CORNER BARONS COURT HAMMERSMITH ACTON TOWN EALING COMMON NORTHFIELDS OSTERLEY HOUNSLOW CENTRAL HATTON CROSS HEATHROW T1, 2, 3 SOUTH HARROW RAYNERS LANE RUISLIP ICKENHAM HILLINGDON E-W only W-E and E-W E-W only W-E and E-W W-E only W-E and E-W W-E only W-E and E-W W-E and E-W W-E and E-W W-E and E-W
E-W only W-E only W-E only
W-E only W-E and E-W W-E and E-W W-E only E-W only W-E only
W-E via depot with pilot Not normally used E-W which involves shunt via siding Reversing via Northfields depot
Trains can be signalled to Heathrow T1, 2, 3 either via T4 or directly
E-W via sidings
Via Ruislip siding crossover Via Uxbridge sidings
PICCADILLY LINE
The colours indicate the predominant line usage. Some trains operate on track of other lines.
Tunnel station with single ‘island’ platform
Tunnel station with separate connecting platforms
Tunnel station with individual platforms
Disused station
Surface station with single ‘island’ platform
Surface station with individual platforms
Disused station
National Rail platforms
National Rail platforms not in scheduled use
TUNNEL SE CTION SURF A CE SE CTION Bakerloo line Central line District line
Hammersmith & City line
Jubilee line
Metropolitan line
Northern line
Piccadilly line
Victoria line
Waterloo & City line
Docklands Light Railway
Network Rail tracks (and LU tracks not used by LU trains); mostly simplified, but a single line indicates single track and double lines indicate twin or multiple tracks
Depot or Siding in line colour
(track layout is simplified within the tinted area)
Engineering or other facilities not belonging to an individual line (track layout is simplified within the tinted area)
(Kilburn High Road to Harrow & Wealdstone is owned and signalled by Network Rail)
(Gunnersbury to Richmond is owned and signalled by Network Rail; Putney Bridge to Wimbledon is signalled by Network Rail)
The colours of the platforms correspond to the relevant line management and do not indicate management responsibility of the station.
DEBDEN HANGER LANE WANSTEAD HOLBORN REDBRIDGE British Museum UPMINSTER HORNCHURCH Hainault Depot Osterley & Spring Grove
Operations Track Overview
Jubilee, Northern & Piccadilly lines
January 2013 © Transport for London
TUNNELS and PLATFORMS
TRACK
REVERSING LOCATIONS
Key to Colours and Symbols
This Diagram is Not to Scale
Acton Works
OTO-JNP v1.4 16.1.2013
Figure 3-3: Uxbridge Branch Tracks
R i v e r T h a m e s HOLBORN COVENT GARDEN LEICESTER SQUARE RUSSELL SQUARE PICCADILLY CIRCUS KING’S CROSS GREEN PARK SOUTH KENSINGTON GLOUCESTER ROAD EARL’S COURT
HYDE PARK CORNER Down Street KNIGHTSBRIDGE Brompton Road COCKFOSTERS SOUTHGATE BOSTON MANOR RUISLIP UXBRIDGE EASTCOTE RAYNERS LANE RUISLIP MANOR FINSBURY PARK York Road CALEDONIAN ROAD HOLLOWAY ROAD ARSENAL MANOR HOUSE TURNPIKE LANE WOOD GREEN BOUNDS GREEN ARNOS GROVE OAKWOOD NORTH GREENWICH CANARY WHARF CLAPHAM COMMON SOUTH WIMBLEDON COLLIERS WOOD TOOTING BROADWAY TOOTING BEC BALHAM CLAPHAM SOUTH MORDEN HAMMERSMITH BARONS ACTON TOWN CHISWICK PARK TURNHAM GREEN STAMFORD BROOK RAVENSCOURT PARK EALING COMMON SOUTH EALING NORTHFIELDS OSTERLEY Osterley & Spring Grove
HOUNSLOW WEST HOUNSLOW EAST HOUNSLOW CENTRAL HATTON CROSS HEATHROW TERMINALS 1, 2, 3 HEATHROW TERMINAL 4 PARK ROYAL NORTH EALING SOUTH HARROW SUDBURY HILL SUDBURY TOWN ALPERTON ICKENHAM HILLINGDON HEATHROW TERMINAL 5 Cockfosters Depot Ealing Common Depot Arnos Grove Stabling Sidings Uxbridge Stabling Sidings South Harrow Stabling Sidings Acton Engineering Works London Transport Museum Northfields Depot Morden Depot Ruislip Siding PicEx Junction Hanger Lane Junction Rayners Lane Junction King’s Cross Loop Barons Court Siding Royal Victoria West Silvertown Southall Brentford Goods FINCHLEY CENTRAL EAST FINCHLEY ARCHWAY COLINDALE GOLDERS GREEN HAMPSTEAD MORNINGTON CRESCENT CHARING CROSS EUSTON MOORGATE KENNINGTON STOCKWELL TOOTING BROADWAY N-S and S-N N-S and S-N N-S only N-S only N-S and S-N N-S and S-N N-S and S-N N-S and S-N N-S and S-N N-S and S-N S-N only N-S and S-N S-N only
Bank branch only NORTHERN LINE CANONS PARK WEMBLEY PARK NEASDEN WILLESDEN GREEN WEST HAMPSTEAD FINCHLEY ROAD GREEN PARK WATERLOO LONDON BRIDGE CANARY WHARF NORTH GREENWICH WEST HAM N-S only N-S and S-N N-S and S-N N-S and S-N N-S and S-N N-S and S-N S-N only W-E and E-W W-E and E-W W-E and E-W W-E and E-W E-W only
Via Stanmore sidings
N-S via depot Via siding Via siding
Via Charing Cross
Via Stratford Market depot and by main line shunt JUBILEE LINE OAKWOOD ARNOS GROVE WOOD GREEN KING’S CROSS GREEN PARK HYDE PARK CORNER BARONS COURT HAMMERSMITH ACTON TOWN EALING COMMON NORTHFIELDS OSTERLEY HOUNSLOW CENTRAL HATTON CROSS HEATHROW T1, 2, 3 SOUTH HARROW RAYNERS LANE RUISLIP ICKENHAM HILLINGDON E-W only W-E and E-W E-W only W-E and E-W W-E only W-E and E-W W-E only W-E and E-W W-E and E-W W-E and E-W W-E and E-W E-W only W-E only W-E only
W-E only W-E and E-W W-E and E-W W-E only E-W only W-E only
W-E via depot with pilot Not normally used E-W which involves shunt via siding Reversing via Northfields depot
Trains can be signalled to Heathrow T1, 2, 3 either via T4 or directly
E-W via sidings
Via Ruislip siding crossover Via Uxbridge sidings PICCADILLY LINE
The colours indicate the predominant line usage. Some trains operate on track of other lines.
Tunnel station with single ‘island’ platform
Tunnel station with separate connecting platforms
Tunnel station with individual platforms
Disused station
Surface station with single ‘island’ platform
Surface station with individual platforms
Disused station
National Rail platforms
National Rail platforms not in scheduled use
TUNNEL SE CTION SURF A CE SE CTION Bakerloo line Central line District line
Hammersmith & City line Jubilee line
Metropolitan line Northern line Piccadilly line Victoria line Waterloo & City line Docklands Light Railway
Network Rail tracks (and LU tracks not used by LU trains); mostly simplified, but a single line indicates single track and double lines indicate twin or multiple tracks
Depot or Siding in line colour
(track layout is simplified within the tinted area)
Engineering or other facilities not belonging to an individual line (track layout is simplified within the tinted area)
(Kilburn High Road to Harrow & Wealdstone is owned and signalled by Network Rail)
(Gunnersbury to Richmond is owned and signalled by Network Rail; Putney Bridge to Wimbledon is signalled by Network Rail)
The colours of the platforms correspond to the relevant line management and do not indicate management responsibility of the station.
DEBDEN HANGER LANE WANSTEAD HOLBORN REDBRIDGE British Museum UPMINSTER HORNCHURCH Hainault Depot Osterley & Spring Grove
Operations Track Overview
Jubilee, Northern & Piccadilly lines
January 2013
© Transport for London
TUNNELS and PLATFORMS
TRACK
REVERSING LOCATIONS
Key to Colours and Symbols
This Diagram is Not to Scale
Acton Works
OTO-JNP v1.4 16.1.2013
Figure 3-4: Tracks Shared with the District Line
R i v e r T h a m e s HOLBORN COVENT GARDEN LEICESTER SQUARE RUSSELL SQUARE PICCADILLY CIRCUS KING’S CROSS GREEN PARK SOUTH KENSINGTON GLOUCESTER ROAD EARL’S COURT
HYDE PARK CORNER
Down Street KNIGHTSBRIDGE Brompton Road COCKFOSTERS SOUTHGATE BOSTON MANOR RUISLIP UXBRIDGE EASTCOTE RAYNERS LANE RUISLIP MANOR FINSBURY PARK York Road CALEDONIAN ROAD HOLLOWAY ROAD ARSENAL MANOR HOUSE TURNPIKE LANE WOOD GREEN BOUNDS GREEN ARNOS GROVE OAKWOOD NORTH GREENWICH CANARY WHARF CLAPHAM COMMON SOUTH WIMBLEDON COLLIERS WOOD TOOTING BROADWAY TOOTING BEC BALHAM CLAPHAM SOUTH MORDEN HAMMERSMITH BARONS ACTON TOWN CHISWICK PARK TURNHAM GREEN STAMFORD BROOK RAVENSCOURT PARK EALING COMMON SOUTH EALING NORTHFIELDS OSTERLEY Osterley & Spring Grove
HOUNSLOW WEST HOUNSLOW EAST HOUNSLOW CENTRAL HATTON CROSS HEATHROW TERMINALS 1, 2, 3 HEATHROW TERMINAL 4 PARK ROYAL NORTH EALING SOUTH HARROW SUDBURY HILL SUDBURY TOWN ALPERTON ICKENHAM HILLINGDON HEATHROW TERMINAL 5 Cockfosters Depot Ealing Common Depot Arnos Grove Stabling Sidings Uxbridge Stabling Sidings South Harrow Stabling Sidings Acton Engineering Works London Transport Museum Northfields Depot Morden Depot Ruislip Siding PicEx Junction Hanger Lane Junction Rayners Lane Junction King’s Cross Loop Barons Court Siding Royal Victoria West Silvertown Southall Brentford Goods FINCHLEY CENTRAL EAST FINCHLEY ARCHWAY COLINDALE GOLDERS GREEN HAMPSTEAD MORNINGTON CRESCENT CHARING CROSS EUSTON MOORGATE KENNINGTON STOCKWELL TOOTING BROADWAY N-S and S-N N-S and S-N N-S only N-S only N-S and S-N N-S and S-N N-S and S-N N-S and S-N N-S and S-N N-S and S-N S-N only N-S and S-N S-N only
Bank branch only
NORTHERN LINE CANONS PARK WEMBLEY PARK NEASDEN WILLESDEN GREEN WEST HAMPSTEAD FINCHLEY ROAD GREEN PARK WATERLOO LONDON BRIDGE CANARY WHARF NORTH GREENWICH WEST HAM N-S only N-S and S-N N-S and S-N N-S and S-N N-S and S-N N-S and S-N S-N only W-E and E-W W-E and E-W W-E and E-W W-E and E-W E-W only
Via Stanmore sidings
N-S via depot Via siding Via siding
Via Charing Cross
Via Stratford Market depot and by main line shunt
JUBILEE LINE OAKWOOD ARNOS GROVE WOOD GREEN KING’S CROSS GREEN PARK HYDE PARK CORNER BARONS COURT HAMMERSMITH ACTON TOWN EALING COMMON NORTHFIELDS OSTERLEY HOUNSLOW CENTRAL HATTON CROSS HEATHROW T1, 2, 3 SOUTH HARROW RAYNERS LANE RUISLIP ICKENHAM HILLINGDON E-W only W-E and E-W E-W only W-E and E-W W-E only W-E and E-W W-E only W-E and E-W W-E and E-W W-E and E-W W-E and E-W E-W only W-E only W-E only
W-E only W-E and E-W W-E and E-W W-E only E-W only W-E only
W-E via depot with pilot Not normally used E-W which involves shunt via siding Reversing via Northfields depot
Trains can be signalled to Heathrow T1, 2, 3 either via T4 or directly
E-W via sidings
Via Ruislip siding crossover Via Uxbridge sidings
PICCADILLY LINE
The colours indicate the predominant line usage. Some trains operate on track of other lines.
Tunnel station with single ‘island’ platform
Tunnel station with separate connecting platforms
Tunnel station with individual platforms
Disused station
Surface station with single ‘island’ platform
Surface station with individual platforms
Disused station
National Rail platforms
National Rail platforms not in scheduled use
TUNNEL SE CTION SURF A CE SE CTION Bakerloo line Central line District line
Hammersmith & City line
Jubilee line
Metropolitan line
Northern line
Piccadilly line
Victoria line
Waterloo & City line
Docklands Light Railway
Network Rail tracks (and LU tracks not used by LU trains); mostly simplified, but a single line indicates single track and double lines indicate twin or multiple tracks
Depot or Siding in line colour
(track layout is simplified within the tinted area)
Engineering or other facilities not belonging to an individual line (track layout is simplified within the tinted area)
(Kilburn High Road to Harrow & Wealdstone is owned and signalled by Network Rail)
(Gunnersbury to Richmond is owned and signalled by Network Rail; Putney Bridge to Wimbledon is signalled by Network Rail)
The colours of the platforms correspond to the relevant line management and do not indicate management responsibility of the station.
DEBDEN HANGER LANE WANSTEAD HOLBORN REDBRIDGE British Museum UPMINSTER HORNCHURCH Hainault Depot Osterley & Spring Grove
Operations Track Overview
Jubilee, Northern & Piccadilly lines
January 2013 © Transport for London
TUNNELS and PLATFORMS
TRACK
REVERSING LOCATIONS
Key to Colours and Symbols
This Diagram is Not to Scale
Acton Works
OTO-JNP v1.4 16.1.2013
Figure 3-5: East End Tracks With the exception of one reversing point
at King’s Cross, the trunk of the line is sim-ple. On the East end, shown in Figure 3-5, trains are able to reverse at Wood Green, Arnos Grove and Cockfosters. Arnos Grove is the crew depot in the east part of the line. Trains reverse there using the central tracks and the stabling sidings are used overnight and to store backup trains. A train de-pot with maintenance facilities is located be-tween Oakwood and Cockfosters.