HAL Id: halshs-00562630
https://halshs.archives-ouvertes.fr/halshs-00562630
Preprint submitted on 3 Feb 2011
HAL is a multi-disciplinary open access
archive for the deposit and dissemination of sci-entific research documents, whether they are pub-lished or not. The documents may come from teaching and research institutions in France or abroad, or from public or private research centers.
L’archive ouverte pluridisciplinaire HAL, est destinée au dépôt et à la diffusion de documents scientifiques de niveau recherche, publiés ou non, émanant des établissements d’enseignement et de recherche français ou étrangers, des laboratoires publics ou privés.
Productivity Growth: Evidence from China
Sylviane Guillaumont Jeanneney, Ping Hua, Zhicheng Liang
To cite this version:
Sylviane Guillaumont Jeanneney, Ping Hua, Zhicheng Liang. Financial Development, Economic Effi-ciency and Productivity Growth: Evidence from China. 2011. �halshs-00562630�
Document de travail de la série
Etudes et Documents Ec 2006.25
Financial Development, Economic Efficiency and Productivity Growth: Evidence from China
Sylviane GUILLAUMONT JEANNENEY, Ping HUA & Zhicheng LIANG *
Centre d’Etudes et de Recherches sur le Développement International (CERDI), University of Auvergne, Clermont-Ferrand, France
*
: Corresponding author: Zhicheng LIANG. Corresponding address: CERDI, 65, boulevard François Mitterrand, 63000 Clermont-Ferrand, France. Email: [email protected]
Financial Development, Economic Efficiency and Productivity
Growth: Evidence from China
Abstract:
Financial development may lead to productivity improvement in developing countries. In this paper, based on the Data Envelopment Analysis (DEA) approach, we use the Malmquist index to measure China’s total factor productivity change and its two components (i.e., efficiency change and technical progress). We find that China has recorded an increase in total factor productivity from 1993 to 2001, and that productivity growth was mostly attributed to technical progress, rather than to improvement in efficiency. Moreover, using panel data set covering 29 Chinese provinces over the period of 1993-2001 and applying the Generalized-Method-of-Moment system estimation, we investigate the impact of financial development on productivity growth in China. Empirical results show that, during this period, financial development has significantly contributed to China’s productivity growth, mainly through its favourable effect on efficiency.JEL Classification: O16; O47; R11
1. Introduction
Since the initiative of economic reforms in 1978, the Chinese economy has sustained a continuously high annual growth rate, and China has been among the countries with the fastest economic growth in the world. China’s remarkable growth performance over the past two decades has received considerable attention. In particular, a number of empirical studies suggest that productivity improvement has accounted for a significant proportion in China’s spectacular growth (e.g., World Bank, 1997; Maddison, 1998; Wang and Yao, 2003). However, have the gains from economic reforms been evenly shared across Chinese regions? More importantly, is China’s economic growth sustainable? These issues have become the focus of recent debate (e.g., Sachs and Woo, 1997; Young, 2000, 2003).
To better understand the nature of China’s growth performance, great efforts have been made to investigate the source of growth in total factor productivity (TFP), and to compare the growth patterns across Chinese regions (e.g., Mao and Koo, 1997; Zheng et al., 1998; Wu, 2000; Guillaumont Jeanneney and Hua, 2003). In addition, by employing data either at the aggregate level, at the enterprise level, by sectors, or by industries, several studies investigate the determinants of TFP growth in China (e.g., Grove et al., 1994; Zheng et al., 1998, 2003; Jin et al., 2002; Cortèse and Hua, 2002). However, the role of financial development in promoting Chinese productivity has been highly neglected in the literature. To our knowledge, due to the lack of systemic data, no attempt has been made to investigate the relationship between financial development and TFP growth for the case of China. This paper attempts to
fill this void by using recently released financial data and measuring TFP growth based on the Data Envelopment Analysis (DEA) approach, and thus contributes to the ongoing debate on the nature of China’s growth performance.
Meanwhile, a number of recent studies have shown that China’s financial market is fragmented, both across regions and sectors (e.g., World Bank, 2003; Zhang and Tan, 2004; Boyreau-Debray and Wei, 2004). Given this fragmentation, the investment activities and lending-borrowing behaviours of local banks can significantly affect the pattern of China’s provincial productivity growth.
According to the literature, both theoretical and empirical studies suggest a positive relationship between financial development and productivity growth, and that the development of financial markets and institutions is a critical and inextricable part of the growth process (Levine 1997). However, a bi-directional causality between finance and productivity, in which they are both endogenously determined, has also been proposed in recent empirical works. Given the endogenous nature of these variables, instrumental approaches or more advanced econometric techniques (e.g., the instrumental-variable estimator, and the Generalized Method of Moment (GMM) approach) are employed in the empirical literature to control for endogeneity arising either from reverse causation or from dynamic specification. In this paper, we use the Generalized Method of Moment (GMM) system estimators to control for endogeneity in our econometric model.
The rest of this paper is organised as follows. The next section provides a brief literature review on the relationship between financial development and productivity
change. Section 3 highlights recent trend of financial development and TFP growth in China, in which the DEA approach is employed to decompose Chinese TFP growth into efficiency change and technical change. Then using panel data for 29 Chinese provinces over the period of 1993-2001 and applying the GMM techniques, we investigate the impact of financial development on productivity growth in China. Econometric model and method for estimation are described in section 4. Empirical results are presented in section 5. We find that financial development exerts a positive and significant impact on efficiency both through credit expansion to the private sector and through competition enhancement in the financial sector, which will in turn strongly promote China’s productivity growth. Finally, this paper concludes with section 6.
2. Financial Development, Productivity and Growth: Literature Review
The important roles of financial development in raising productivity and promoting economic growth have been well documented and widely discussed in the literature (e.g., Goldsmith, 1969; McKinnon, 1973; Shaw, 1973; Greenwood & Jovanovic, 1990; Bencivenga & Smith, 1991).
In the traditional growth theory, factor accumulations are considered as the main driving forces behind economic growth. Financial development can contribute to the growth of total factor productivity by either raising the marginal productivity of capital (Goldsmith, 1969), or improving the efficiency of capital allocation so as to increase the aggregate saving rate and investment level (McKinnon, 1973; Shaw,
1973). However, in the traditional framework, the capital stock suffers from diminishing returns to scale, which greatly limits the impacts of financial development on growth.
The emergence of endogenous growth literature pioneered by Romer (1986) provides important insights and new theoretical underpinning to the analysis of the relationship between financial development, productivity and growth, in which endogenous technological progress through R&D, along with their positive externalities on aggregate productivity, may result in non-diminishing returns to capital.
Consequently, the role of financial intermediation in raising productivity has been reinforced in recent endogenous growth literature. Greenwood and Jovanovic (1990) develop an endogenous model, in which they highlight two essential functions of financial intermediaries in enhancing productivity and promoting growth, i.e. collecting and analysing information of investment projects, and increasing investment efficiency through allocating the funds to the projects with the highest expected returns. Similarly, in the endogenous model of Bencivenga and Smith (1991), they focus on another key function of financial intermediations for the development process. They argue that by enhancing liquidity and mitigating idiosyncratic risk through risk diversification, the development of financial intermediaries improves the allocation efficiency of funds, and thus highly contributes to productivity growth. In addition, the importance of portfolio diversification and risk sharing via stock markets in inducing sustained growth is also explored in a number of studies (e.g., Levine,
1991; Saint-Paul, 1992). In sum, all these works suggest that financial development can affect long run growth through different channels and various aspects of innovation or productive activities.
These theoretical implications seem to be well consistent with empirical evidence. The positive relationship between finance and growth has received considerable support from empirical studies (e.g. King and Levine, 1993; Beck et al., 2000; Levine et al., 2000). In a recent paper, Benhabib and Spiegel (2000) examine whether financial development affects growth solely through its contribution to factor accumulations via the “primitive” channels suggested in the traditional growth theory, or whether it also enhances economic growth via the channels of productivity improvement that are mainly attributed to knowledge creation and technological progress, as predicted by the endogenous growth literature. Their results suggest that financial development is positively correlated with growth in both total factor productivity and capital accumulation. Recently, modern economic theories have shown that productivity is the sole viable engine for sustainable long-term economic growth. In this sense, the contribution of financial development to productivity enhancement should be more important than that to factor accumulations.
Using panel data covering 42 countries and 36 industries, Rajan and Zingales (1998) find that industries that are naturally heavy users of external finance grow relatively faster in economies with higher levels of financial development. Because these industries are usually R&D-intensive in which more advanced technologies are employed or new technologies are created, therefore financial development may
contribute to productivity growth through providing necessary financial support to the development and expansion of these industries. More recently, Beck and Levine (2002) use a cross-industry and cross-country panel to examine the relationship between financial structure, industry growth and new establishment formation. They find that financial development, along with effective contract enforcement mechanisms and efficient legal system, can foster new establishment formation, and enhance aggregate productivity growth.
Consequently, as summarized by Levine (1997), both theoretical and empirical works provide strong evidence to show that more efficient and better functioning financial systems, by increasing diversification and reducing risk, mobilizing savings and allocating resources to its best uses, monitoring managers and exerting corporate control, reducing monitoring cost and facilitating exchange of goods and services, may lead to faster capital accumulation and higher productivity growth.
3. Recent Trend of Financial Development and Total Factor Productivity
Growth in China
3.1 Development of Financial Markets and Financial Intermediation in China
The abandon of mono-banking system in the early 1980s marked the beginning of China’s financial reforms.1 Four state-owned specialised banks2, which are authorised with specialised functions concerning different scopes of economic activities, were
1
: During the pre-reform period, in consistent with the centrally planned economy, a mono-banking system was established in China, where the People’s Bank of China (PBC) acted as an all-inclusive financial institution to Chinese economy.
2
: These four state-owned specialised banks are: the Agricultural Bank of China (ABC), the Construction Bank of China (CBC), the Bank of China (BOC), and the Industrial and Commercial Bank of China (ICBC).
established and separated from the traditional mono-banking system during the first wave of financial reforms in the early 1980s, and the People’s Bank of China (PBC) was reorganised as the central bank of China. Since then, various forms of financial institutions have been successively set up. China’s financial system has been gradually transformed from a mono-banking system into a diversified financial institutional system.
The promulgation of the Central Bank Law and the Commercial Bank Law in 1995 further deepened China’s financial reforms. The Central Bank Law legally confirms the independent status of PBC. According to this law, the PBC is “free from intervention by governments, public organisations, individuals or other administrative organs at all levels”. Similarly, the Commercial Bank Law ensures and protects the independent operations of commercial banks, and explicitly separates the commercial banking from the securities business and investment banking. Therefore, both the Commercial Bank Law and the Central Bank Law lay the basis for building a modern banking system in China.
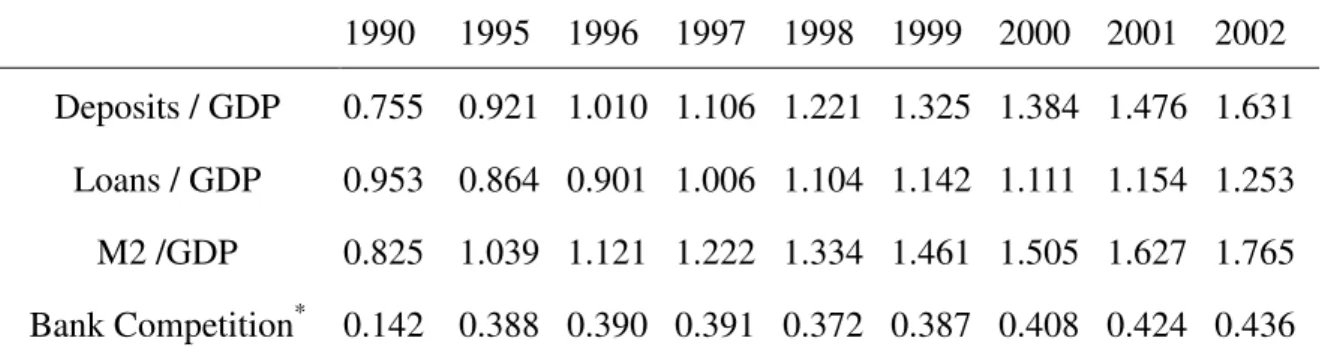
Table 1 presents some useful financial indicators that characterise the development of financial intermediation in China. Consider now the first three conventional financial indicators, i.e., the ratio of deposits in China’s financial institutions to GDP, the ratio of loans in China’s financial institutions to GDP, and that of Money and Quasi-Money (M2) to GDP. We find that the scale of deposits and loans in China’s financial institutions grew rapidly over the last decade. The deposits-to-GDP ratio increased from 0.76 in 1990 to 1.63 in 2002; the loans-to-GDP
ratio also rose from 0.95 to 1.25 during the same period. Meanwhile, the M2-to-GDP ratio experienced a remarkable increase and amounted to 1.77 in 2002, more than doubled the number in 1990.
[Table 1 here]
However, large scales of non-performing loans (NPLs) in China’s banking sector impede the further development of financial intermediaries. Heavy burden of “policy lending”, poor banking operation and management, soft budget constraints due to insider control and government intervention, and the lack of efficient regulation and surveillance system have long been recognised as the main causes to the accumulation of NPLs in China. To solve these problems, four Asset Management Corporations (AMCs) were established in 1999 to relieve the four major state banks of heavy burden by taking over a large fraction of NPLs and bad debts from them. With China’s accession into the WTO, further penetration of the foreign banks and increasing competition are predicted. In order to improve the efficiency of Chinese banks, to enhance their competitiveness and increase their capabilities in profitability, more measures have to be forwarded to strengthen China’s financial system, among which further enhancing and intensifying competition in China’s banking sector can be an effective policy measure that will lead to improvement in efficiency. To reflect the evolving pattern of competition in China’s banking sector, we present in Table 1 the financial indicator of Bank Competition, calculated as the share of credit issued by financial intermediaries other than the four major state-owned banks. We find that this ratio rose from 0.14 in 1990 to 0.44 in 2002, indicating a steady increase in the
level of China’s banking competition over this period.
Meanwhile, the past ten years have witnessed significant development in China’s emerging capital market. Since the opening of Shanghai Stock Exchange and the Shenzhen Stock Exchange in the early 1990s, China’s stock market has rapidly expanded. The enactment and implementation of the Securities Law in 1999 provided detailed rules and legal basis to regulate the investors and the listed companies. Since then, China’s stock market has played an increasingly important role in Chinese economy, by facilitating capital raising, promoting domestic investment, and improving efficiency of financial resource allocation.
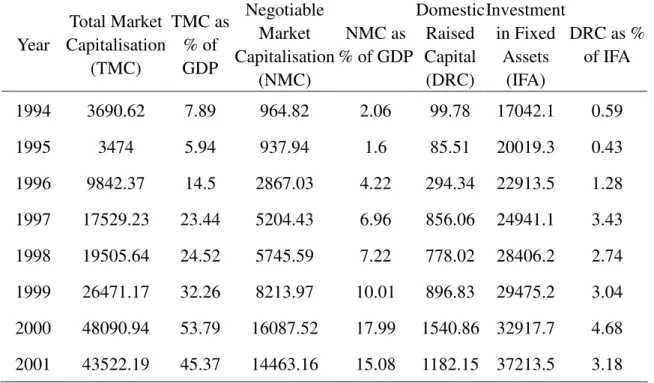
Table 2 reports the ratio of China’s total stock market capitalisation (TMC) and
negotiable stock market capitalisation (NMC) to GDP.3 The TMC-to-GDP ratio rose
from 8% in 1994 to more than 45% in 2001; NMC-to-GDP ratio also expanded impressively from 2% to 15% in the same period. In addition, Table 2 also presents the ratio of domestic raised capital in stock market to total fixed assets investment, which marked an increase from 0.59% in 1994 to 3.18% in 2001. Furthermore, rapid developments have also occurred in China’s bonds market, money market, foreign exchange market and other aspects of financial sector, which greatly contributed to China’s economic growth.
[Table 2 here]
3
: In China’s stock market, the listed companies’ shares can be divided into the negotiable shares and the nonnegotiable shares: the former refers to the listed companies’ shares that have been traded in China’s Automatic Quotation System of Stock Exchange; the latter refers to the listed companies’ shares that have not been traded in this system. Consequently, the total market capitalisation (TMC) represents the aggregate taken at a given time of the market price the total listed volume for each security in the market, i.e. ∑(Market Price × Issue Volume); while the negotiable market capitalisation (NMC) represents the aggregate taken at a given time of the market price the negotiable volume for each security in the market, i.e. ∑(Market Price × Negotiable Volume).
However, with profit rates and returns to capital differing widely across regions, China’s financial markets seem to be, to some extent, fragmented. First, there is striking evidence that the annual and long-run rates of inflation differ greatly among Chinese provinces, and thus real interest rates are also significantly different from one province to another because most of the variability in the real interest rate must come from variations in the inflation rate (Zhang and Wan, 2002; Guillaumont Jeanneney and Hua, 2002). Second, there is also evidence that the marginal product of capital becomes increasingly divergent during the 1990s, suggesting greater fragmentation of capital markets in China (Zhang and Tan, 2004).4
Moreover, based on standard tests of investment-saving correlation and consumption smoothing, Boyreau-Debray and Wei (2004) evaluate the extent of financial integration within China. They first use the test of Feldstein and Horioka (1980) to investigate the correlation between investments and savings across the Chinese provinces.5 Then with the help of Chinese consumption data and the framework proposed by Obstfeld (1994) that allows for testing the degree of risk sharing and consumption smoothing by assuming either a complete or an incomplete asset market, they measure the integrated level of domestic capital market in China.6
4
: To assess the degree of capital market fragmentation, Zhang and Tan (2004) first use provincial time series data over the period of 1978-2001 to estimate production functions for different sectors, and then the estimated parameters from the regression equations are applied to quantify the regional variation in the marginal products of capital by sector. Their results show that China’s capital markets have become more fragmented.
5
: A number of intra-national studies have shown that, within countries with internally integrated capital market such as Japan and the United States, the correlations between investment and saving rates are either insignificantly different from zero or even negative (e.g., Sinn, 1992; Bayoumi and Rose, 1993; Iwamoto and Van Wincoop, 2000). However, for the case of China, it is found that the investment and saving correlation in the Chinese provinces is positive and significant between 1978 and 2000 even after controlling for the national and regional factors, which suggests that there are still significant barriers to intra-national capital mobility within China (Boyreau-Debray and Wei, 2004).
6
: Empirical literature suggests that internally integrated capital market allows sufficient risk-sharing in consumption across different regions (e.g., Van Wincoop, 1995; Asdrubali et al., 1996; Crucini, 1999). However, Boyreau-Debray and Wei (2004) find that the degree of risk sharing across the Chinese regions is low, and that there was a noticeable decline in the degree of regional risk sharing from the 1980s to the 1990s.
Their test results suggest that the level of capital mobility within China is low, and that China’s financial markets are quite fragmented across regions.
Fragmentation of China’s financial markets may arise mainly from direct and indirect government control over interest rates and resource allocation (World Bank, 2003). Because of this fragmentation, the development level of local financial intermediaries has been an important factor in determining local economic performance (Boyreau-Debray, 2003). Further deepening financial reforms are required to improve domestic financial market integration and flexibility in China.
In the theoretical literature, it has long been recognized that financial sector can play an active role and act as an important instrument in raising productivity through allocating investment funds to projects with higher returns, and enhancing technical progress through proving important financial resources for R&D activities. In the following discussion, with the help of the data envelopment analysis (DEA) methodology, we first measure China’s productivity change and its two components based on the computation of the Malmquist index, then empirical estimations will be conducted to examine the role of financial development in determining China’s total factor productivity.
3.2 Recent Change in Total Factor Productivity and its Two Components in China
Since 1978, China began its transition to market-oriented economy. After more than two decades of reforms, the rapid developments of Chinese economy, especially its great achievements in stimulating productivity growth, have been widely acknowledged and well documented. Various approaches are forwarded to measure
productivity growth in China. Traditional methods of growth accounting and production function estimation based on the neo-classical growth theory are popular in Chinese productivity analyses (e.g., McMillan et al., 1989; Lin, 1992; Chow, 1993; Wang and Yao, 2003). More recently, modern approaches of non-parametric models or frontier analysis based upon the Malmquist index calculation, including the data envelopment analysis (DEA), stochastic and deterministic frontier production function estimation, have also been employed in empirical studies (e.g., Färe et al., 1996; Mao and Koo, 1997; Wu, 2000; Guillaumont Jeanneney and Hua, 2003, 2005).
In the present paper, we attempt to estimate the total factor productivity growth of Chinese provinces based on the Malmquist index and the DEA approach, with which we construct a best practice frontier (i.e. the highest productivity observed in all the provinces with the technology embodied), and compare each province with this frontier. This approach enables us to further decompose the change in total factor productivity into technical change and efficiency change, and facilitates the multilateral comparison to identify the source of overall productivity growth that may stem either from efficiency improvement by catching up to the production frontier, or from the shifts of the frontier through technological progress and innovation.
3.2.1 Malmquist Productivity Index
The Malmquist productivity index, first initiated by Caves et al. (1982) and further developed by Färe (1988), Färe et al. (1994), and others (e.g., Färe et al., 1996; Ray and Desli, 1997; Färe et al., 1997), has been widely employed in the literature of productivity analyses. The Malmquist index can be defined using distance function,
which is an important measure of production pattern, and is of advantages in describing multi-input and multi-output production technology. In this study, we use the output-oriented distance function to measure the productivity change of Chinese provinces.
Following Shephard (1970) and Färe (1988), the output-oriented distance function (denoted by subscript o) for each time period t=1,...,T can be defined as:
{
}
1 ] ) , ( : [ sup ] ) , ( : [ inf ) , ( − ∈ = ∈ = t t t t t t t t t o S y x S y x y x Dθ
θ
θ
θ
(1)where xt is the inputs vector at time period t, yt is the outputs vector, the superscript t denotes the time period of reference technology, and St is the technology set with St =
{
(xt,yt):xtcan produce yt}
that models thetransformation of inputs ( t N
x ∈ℜ+ ) into outputs ( t M
y ∈ℜ+ ). The output-oriented distance function t( t, t)
o x y
D , being closed, bounded, convex, and satisfying strong
disposability properties, is used to measure the reciprocal of the maximal proportional expansion of the output vector yt given an input vector xt, and to reflect the distance of individual economy to the production frontier in relation to the reference or benchmark technology.
Consequently, based on different benchmark technology and time periods, four distance functions can be defined, i.e. Dot(xt,yt), Dot+1(xt+1,yt+1), Dot(xt+1,yt+1) and Dot+1(xt,yt), among which the first two functions are the same-period distance functions where production points are compared to frontier technologies at the same time period, whereas the last two functions are the mixed-period distance functions with production points and frontier technologies from different time periods. As in
Cave et al. (1982), the Malmquist index is defined as the ratio of two distance functions relative to the same benchmark technology, and can be written as follows:
) 3 ( ) , ( ) , ( ) 2 ( ) , ( ) , ( 1 1 1 1 1 1 1 t t t o t t t o t o t t t o t t t o t o y x D y x D M y x D y x D M + + + + + + + = =
These two indices measure the productivity changes from time period t to time period t+1 under the same reference technology, i.e. technology at time period t for equation (2), and at time period t+1 for equation (3). To avoid choosing an arbitrary benchmark technology, we follow Färe et al. (1994) to compute the Malmquist productivity index as the geometric mean of these two indices, and then we have:
) 4 ( ) , ( ) , ( ) , ( ) , ( ] [ ) , , , ( 2 1 1 1 1 1 1 1 2 1 1 1 1 , 1 = = + + + + + + + + + + t t t o t t t o t t t o t t t o t o t o t t t t t t o y x D y x D y x D y x D M M y x y x M
The Malmquist productivity index defined in equation (4) can be further decomposed into two components, i.e. efficiency change and technical change:
) 5 ( ) , ( ) , ( ) , ( ) , ( ) , ( ) , ( ) , , , ( 2 1 1 1 1 1 1 1 1 1 1 1 1 , 1 = + + + + + + + + + + + + t t t o t t t o t t t o t t t o t t t o t t t o t t t t t t o y x D y x D y x D y x D y x D y x D y x y x M
where the first term outside the square bracket measures the efficiency change between time period t and t+1, and captures the degree of catching up to the best-practice frontier; while the remaining part denotes the component of technical change, calculated by the square root of the geometric mean of two indices, and captures the shift in the frontier between these two periods. Note that a value of Malmquist productivity index greater than one signifies an improvement in productivity; a value equal to one indicates the stagnation condition; while a value less than one is associated with a decline in productivity. Similarly, for its two
components, values superior to one imply improvement in the relevant performance, while values inferior to one are corresponding to deterioration in performance.
The decomposition of the Malmquist productivity index allows us to identify the contributions from efficiency change and technical change to the overall TFP growth, and facilitates the comparison of growth patterns across different regions.
3.2.2 Linear Programming and DEA Approach
The linear-programming approach introduced by Färe et al. (1994) provides new impetus to popularise the non-parametric method in empirical analyses. In this paper, we employ non-parametric programming techniques to calculate the Malmquist productivity index. Assume that at each time period t =1,...,T, there are k =1,...,K
provinces that use n=1,...,N inputs xnk,t to produce m=1,...,M outputs ymk,t. The reference technology at time period t with constant returns to scale can be described as:
{
}
K k z N n x x z M m y z y y x S t k K k t n t k n t k K k t k m t k t m t t t ,..., 1 0 ; ,..., 1 ; ,..., 1 : ) , ( , 1 , , 1 , , = ≥ = ≤ = ≤ =∑
∑
= = (6)where zk,t is the weight on province k at time period t. To construct the Malmquist productivity index relative to the constant-returns-to-scale technology for province k between time period t and t+1, four distance functions should be calculated, i.e.
) , ( k,t k,t t o x y D , Dot+1(xk,t+1,yk,t+1) , Dot(xk,t+1,yk,t+1) and Dot+1(xk,t,yk,t) . Consequently, the following linear-programming problems are to be solved:
[
t i kt j kt j]
ko x y
subject to K k z N n x x z M m y z y i t k j t k n K k i t k n i t k K k i t k m i t k j t k m k ,..., 1 0 ; ,..., 1 , ; ,..., 1 , , , 1 , , 1 , , , = ≥ = ≤ = ≤ + + = + + = + + +
∑
∑
λ
(7) ). , ( ) 1 , 1 ( ) , ( ); , ( ) 0 , 1 ( ) , ( ); , ( ) 1 , 0 ( ) , ( ); , ( ) 0 , 0 ( ) , ( 1 , 1 , 1 , , 1 1 , 1 , , , + + + + + + = = = = t k t k t o t k t k t o t k t k t o t k t k t o y x D for solving when j i and y x D for solving when j i y x D for solving when j i y x D for solving when j i whereIn contrast to traditional parametric approaches of productivity calculation, the DEA non-parametric method directly concerns the best-practice frontier within the data, and compares individual performance with the frontier. Being free of any behavioural or economic relationship assumptions involved in traditional methods, the DEA approach does not require any specified form of production function or any assumed distribution form of the residuals, and is better in dealing with multi-input and multi-output technologies. This is of great importance and particular advantage in policy analysis, especially for developing countries and transition economies such as China.
3.2.3 Trend in Productivity Growth and its Two Components
In the present section, we compare the pattern of productivity growth and its components for 29 Chinese provinces over the period of 1993-2001.7 For the
7
: The 29 provinces included in our sample are: Beijing, Tianjin, Hebei, Shanxi, Inter Mongolia, Liaoning, Jilin, Heilongjiang, Shanghai, Jiangsu, Zhejiang, Anhui, Fujian, Jiangxi, Shandong, Henan, Hubei, Hunan, Guangdong, Guangxi, Hainan, Sichuan, Guizhou, Yunnan, Shaanxi, Gansu, Qinghai, Ningxia, Xinjiang. Tibet has been excluded from our sample because of serious problems of omitted data and missing value for this region. Chongqing municipality area, established quite recently and separated from Sichuan province in the year 1997, will still be included in the calculation of Sichuan province, because data before 1997 do not allow us to distinguish between Sichuan and Chongqing.
calculation of the Malmquist index, the DEAP program software (version 2.1) developed by Ceolli (1996) has been applied, and a single-output, two-input model has been employed for productivity estimation, where labour and capital are the two productive factors or inputs, and the real gross domestic product (GDP), defined as nominal GDP divided by its deflator, is used as the output measure.8
In the estimation of the TFP growth, the total number of employed persons is used to measure the labour input. However, provincial data on capital stock are not available in China. In this study, two steps are conducted to evaluate China’s capital stock. First, we use the gross formation of fixed capital deflated by its price indices to evaluate the capital stock in the initial period (i.e. year 1992 in our study), where the capital stock in 1992 is supposed to be the sum of all past twenty years’ investments in constant price with an annual capital depreciation rate of 5%. Second, for the period of 1993-2001, given that data on the fixed assets investment and its price indices are available for Chinese provinces throughout this period, the capital stock can be evaluated by Kt =It +Kt−1 −Dt, where Kt and Kt−1 denote the capital
stocks at time period t and t-1 respectively, It is the real investments in fixed assets in time period t, and Dt denotes the capital depreciation.9 10
Following the conventional geographical classification, the twenty-nine Chinese provinces in our sample are divided into three groups, namely the coastal, central and
8
: The calculation is issued from a previous work, i.e., Guillaumont Jeanneney and Hua (2003). 9
: The GDP statistics and labour statistics are from China Statistical Yearbook (various issues). Data on gross formation of fixed capital are from China Statistical Yearbook, Accounting Data and Materials on Gross Domestic
Product in China (Zhongguo Guonei Shengchang Zongzhi Hesuan Lishi Ziliao): 1952-1995, and Comprehensive
Statistical Data and Materials on 50 Years of New China. Data on investment in fixed assets and its price indices for Chinese provinces are from China Statistical Yearbook.
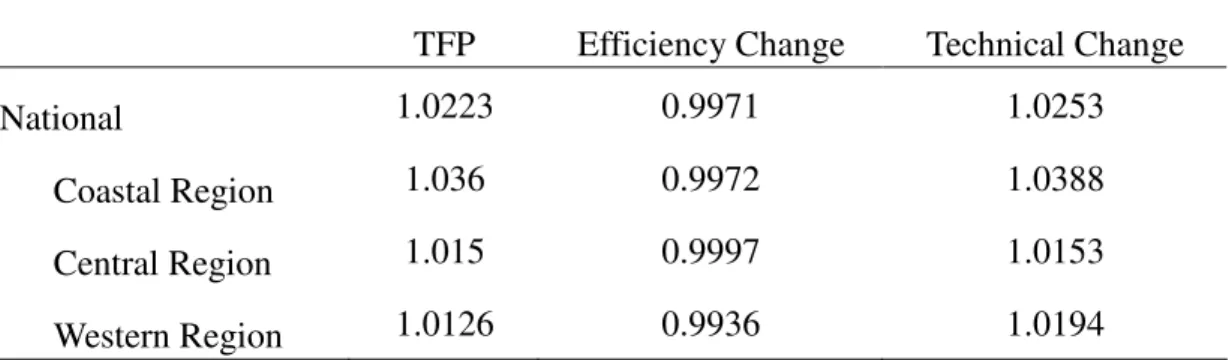
western regions.11 Table 3 reports the summary of average performance of Chinese regions over the period of 1993-2001 in terms of total factor productivity and its two components. We find that China experienced an increase in total factor productivity from 1993 to 2001, and on average TFP grew at an annual rate of 2.2% during the sample period. Meanwhile, all three Chinese regions experienced productivity growth over the same period, among which the coastal regions recorded the highest productivity growth (at an average annual growth rate of 3.6%), more than doubled the number of the other two regions (i.e., 1.5% for the central regions and 1.3% for the western regions).
[Table 3 here]
Figure 1 presents the annual change in TFP growth for the overall China and its three regions over the period of 1993-2001. A decreasing trend in the annual growth rate of total factor productivity was observed at the national level, where the growth rate declined from 5% in 1993 to 1% in 1998, and then TFP grew at this low speed until 2001. Similar trend also appeared in central and western regions. The only exception is the coastal region: its growth rate bounced back to a high level of 5.2% in 1999 after experiencing a decline from 6.6% in 1993 to 2.6% in 1998, but then decreased to 2.4% in 2001; however, it still outperformed the other two regions in most of the years.
[Figure 1 here]
11
: The coastal region is composed of eleven provinces that are situated along the coast of China, including Beijing, Tianjin, Hebei, Liaoning, Shanghai, Jiangsu, Zhejiang, Fujian, Shandong, Guangdong and Hainan. The central region includes ten provinces, namely, Shanxi, Inner Mongolia, Jilin, Heilongjiang, Anhui, Jiangxi, Henan, Hunan, Hubei and Guangxi. The remaining provinces are grouped as the western region, i.e. Sichuan, Guizhou, Yunnan, Shannxi, Gansu, Qinghai, Ningxia and Xinjiang.
To identify the source of productivity growth in China, we decompose the overall change in total factor productivity into efficiency change and technical change. Table 3 shows that China experienced technical progress from 1993 to 2001, and on average, the index of technical change grew at an annual rate of 2.5%; however, a slight slow down in efficiency (at an annual average rate of -0.3%) was also observed during this period. Similar trends can be found in three Chinese regions. Once again the coastal region enjoyed the greatest gain in technical progress that grew on average at an annual rate of 3.9%, followed by the western region (at 1.9%) and then the central region (at 1.5%). As for the change in efficiency, both the coastal and western regions recorded a slight efficiency loss, while the central region experienced no clear change during this period. These results suggest that productivity growth in China over the period of 1993-2001 was mostly attributed to technical progress, rather than to the improvement in efficiency.
Figures 2 and 3 present the annual technical change and efficiency change for the overall China and its three regions from 1993 to 2001. As shown in Figure 2, we find that the changing patterns of technical progress, both at the national and the regional levels, are greatly in consistent with that of TFP in Figure 1. However, insignificant or even negative changes are observed in term of efficiency for the overall China and its three regions (Figure 3). This confirms the findings that technical progress was the main source of productivity gain for China over the period of 1993-2001.
[Figure 2 here] [Figure 3 here]
In the next Section, we attempt to empirically investigate the impact of financial development on productivity growth for the case of China. Meanwhile, due to the divergence in the evolving patterns of efficiency change and technical progress, it is of great interest to assess, after controlling for other potential productivity determinants, whether financial development contributes to productivity growth through boosting technical progress or through mitigating the decline in efficiency.
4. Model and Methodology of Estimation
4.1 Econometric Model
Using panel data covering 29 Chinese provinces over the period of 1993-2001, we investigate the relationship between financial development and productivity growth in China. In our econometric estimations, the growth rates of total factor
productivity (
•
TFP ) and its two components, i.e. the growth rate of technical efficiency (
•
TE) and that of technical progress (
•
TP), are successively employed as the dependent variables. Among the explanatory variables, in addition to the financial development indicators, many other important factors that are conventionally considered as sources of productivity growth (i.e., foreign direct investment, trade and education) are also included into the estimations. Moreover, as China has experienced rapid development and change during this period of market-oriented transition, a variable of time trend is also introduced to capture this transitional characteristic. In general, three econometric models relative to the growth rates of TFP and its two components will be successively estimated in the present study. The estimations for
the growth rate of total factor productivity (
•
TFP) enable us to assess the aggregate impacts of financial development on productivity; while the estimations for the growth rate of technical efficiency (
•
TE) and that of technical progress (
•
TP) allow us to better identify the channels through which financial development contributes to China’s productivity growth. More specifically, for econometric estimations, the regression models can be described as follows:
For the growth of TFP: TFP•i,t =
α
0 +α
1Fi,t +α
2Xi,t +α
3Tt +µ
i +ε
i,t (8)For the growth of technical efficiency: TEi,t = 0 + 1Fi,t + 2Xi,t + 3Tt + i +ei,t
•
η
β
β
β
β
(9)For the growth of technical progress: TPi,t =
γ
0 +γ
1Fi,t +γ
2Xi,t +γ
3Tt +vi +ζ
i,t•
(10)
where F is a vector of financial variables; X is a vector of control variables; T is the time trend;
µ
i,η
i andν
i denote the unobservable province-level specific effects;ε
it, eit andξ
it are the error terms.In order to measure the level of financial development in China, three financial indicators are included in the econometric models, i.e. Private Credit (PRIVATE), Bank Competition (COMP), and Public Credit (PUBLIC). Following Levine et al. (2000) and Beck et al. (2000), Private Credit (PRIVATE) is measured by the value of credit by financial intermediaries to private sector as a share of GDP. Meanwhile, we introduce the indicator of Bank Competition (COMP), measured by the share of credit issued by banks and financial institutions other than the four major state-owned banks, to reflect the competition level in the financial sector. For better comparison, we also include the indicator of Public Credit (PUBLIC), calculated as the value of credit by financial intermediaries to public sector as a share of GDP, to examine whether there
exist differences in the lending efficiency between credits allocated to the public sector and that to the private sector.12
As for the control variables, we include first in our estimated models the variable of foreign trade development (TRADE), calculated as the growth rate of China’s total value of exports and imports in real terms13, to examine the impact of China’s foreign trade development on productivity. In consistent with the comparative advantage of China, the foreign trade sector can provide external economies to the whole economy through the improvement of management skill and labour training, and thus contribute to China’s productivity growth (Guillaumont Jeanneney and Hua, 2003).
The huge inflow of foreign direct investment has been another important driving force behind China’s TFP growth. Since 1993, China has become the largest recipient of foreign direct investment among developing countries. A number of recent studies have shown that foreign direct investment strongly promoted China’s economic development and productivity growth, both through providing important financial resources for investment, and through the transfers and diffusion of more advanced technologies, know how, and better management and organizational skill (e.g., Sun, 1998; Dayal-Gulati and Husian, 2002). In our estimations, we introduce the variable of FDI, calculated as the growth rate of China’s foreign direct investment in real terms,
12
: It is worth mentioning here that the central bank lending to the provinces, the intra-bank and inter-bank loans are three main channels of cross-regional lending within China’s banking sector, and they are also considered in the literature as important indicators to measure the development level of China’s financial markets. Unfortunately, due to unavailability of data on these lending activities at the provincial level, we cannot empirically examine these effects in the present paper, but they are certainly interesting areas for expansion in future research.
13
: The export value in constant prices is calculated as the export value in current prices (in USD) divided by the unit value price index of export, while import value in constant prices is calculated as import value in current prices (in USD) divided by the unit value price index of import. Data for export and import are from China
to assess the growth impact of foreign direct investment on productivity.14
Moreover, the variable of education level (EDU), measured by the share of population with educational attainment of college and higher level, is also included in our model. Education has long been considered as the major driving force that can lead to efficiency improvement and sustainable growth (Romer, 1986, 1990; Lucas, 1988). As a fundamental element in human capital formation, education contributes to productivity growth by improving the quality of labor force, stimulating technological progress, and increasing the capacity of a nation in technical adoption and innovation (Benhabib and Spiegel, 1994; Mankiw, 1995).
4.2 Methodology of GMM Estimators for Panel Models
The methodology of Generalized Method of Moments (GMM) for panel data analyses, proposed by Arellano and Bond (1991) and then further developed by Blundell and Bond (1998), is employed here to control for endogeneity in our estimations.15 Consider the following model:
T t N i EW EX yi,t =γ1 i,t +γ2 i,t +µi +εi,t, =1,..., ; =1,..., (11)
where EX is a vector of strictly exogenous covariates; EW denotes a vector of predetermined covariates and endogenous covariates (predetermined variables are assumed to be correlated with past errors, while endogenous ones are assumed to be
14
: Foreign direct investment in constant prices is calculated as foreign direct investment in current prices (expressed in RMB) divided by the price indices of investment in fixed assets. Data for foreign direct investment and the price indices of investment in fixed assets are from China Statistical Yearbook.
15
: The literature on the GMM estimator is enormous and continually expanding. Useful recent summary of GMM estimation and some further discussion can be found in e.g., Green (2000, Chapter 11) and Wooldridge (2002, Chapter 8 and Chapter 14).
correlated with past and present errors); µi is the unobserved group-level effect, and
it
ε is the error term, with the assumption that µi and εit are independent for each i over all t, and that there is no autocorrelation in the εit.
First, in order to eliminate the unobservable group-specific effects, we difference equation (11) and then it can be rewritten as:
) 12 ( ) ( ) ( ) ( , , 1 2 , , 1 , , 1 1 1 , ,t − it− = it − it− + it − it− + it − it− i y EX EX EW EW y γ γ ε ε
Second, instrumental-variable approaches are applied to deal with the endogeneity of explanatory variables in equation (12), where the predetermined and endogenous variables in first differences are instrumented with appropriate lags of the specified variables in levels, while strictly exogenous regressors are first-differenced for use as instruments in the first-differenced equation.
However, the efficiency of this instrumental approach may be relatively weak, given the fact that lagged levels are often poor instruments for first differences. Therefore, Blundell and Bond (1998) propose the System-GMM approach, in which the first-differenced estimator (i.e., equation (12)) is combined with the estimator in levels (i.e., equation (11)) to form a more efficient “system estimator”: for the first-differenced equation, the instruments are the same as that discussed above; for the levels equation, predetermined and endogenous variables in levels are instrumented with appropriate lags of their own first differences, while the strictly exogenous regressors can directly enter the instrument matrix for use in the levels equation.
particularly in the studies of macroeconomics and finance. This method has a number of advantages. For instance, Beck et al. (2000) argue that the GMM panel estimator is good in exploiting the time-series variation in the data, accounting for unobserved individual specific effects, allowing for the inclusion of lagged dependent variables as regressors, and therefore providing better control for endogeneity of all the explanatory variables. Following Beck et al. (2000), we use the GMM estimator to investigate the finance-productivity nexus in China.
4.3 Data
Our empirical work is based on a panel data set covering 29 Chinese provinces over the period from 1993 to 2001. Data used in our empirical test are from China
Statistical Yearbook (various issues), Almanac of China’s Finance and Banking (various issues), China Population Statistics Yearbook (various issues),
Comprehensive Statistical Data and Materials on 50 Years of China, individual Provincial Statistical Yearbooks, and China’s National Bureau of Statistics.
5. Empirical Results
Empirical results based on the GMM system estimation are reported in Table 4. For each regression, we test our specification with the Hansen test for instrument validity, and then with the serial correlation test for the second order serial correlation. The results of tests suggest that our instruments are valid, and there exists no evidence of second serial correlation in our regressions.
Estimation results show that financial development significantly contributes to China’s TFP growth. Consider first the results in regressions (1) to (3) of Table 4. We find that the coefficients of PRIVATE are positive and highly significant at 1% level in all these regressions, which suggests that an increase in credits allocated to private sector as a share of GDP will enhance TFP growth in China. Meanwhile, the indicator of bank competition (COMP) is positively correlated with TFP growth. The coefficients of COMP are positive and statistically significant at the 5% level for regression (1), and at the 1% level for regressions (2) and (3). It indicates that enhancing competition in banking sector tends to stimulate productivity growth in China.
Moreover, we find that trade expansion and growth in foreign direct investment also significantly enhance productivity in China. The coefficients of the variables of TRADE and FDI are both positive and significant in all regressions, which indicates that China has great potentials in promoting productivity growth through economic openness.
Meanwhile, a positive and significant impact of education (EDU) on TFP growth is reported in our estimations. This result confirms the findings in Guillaumont Jeanneney and Hua (2003) that progress in higher education can strongly contribute to China’s productivity growth. Empirical results also show that the inclusion of the variable EDU lowers the impact of PRIVATE on productivity growth.
In addition, there is evidence that the variable of time trend is negatively and significantly correlated with productivity growth, which indicates that as China’s
reform goes on, China has largely exhausted the easy economic gains from the catching-up mechanism. After two decades of market-oriented transition, China is entering into the new reform era with several hardcore economic problems, and the increase in productivity may require a fundamental reorientation of economic development strategy, and the introduction of new mechanism, institutions and policy (Woo et al., 2004).
Another interesting result comes from the regressions (4) to (6). In order to compare the lending efficiency between the credits allocated to the private sector and that to the public sector, we introduce into our estimations the variable PUBLIC (i.e., credit allocated to the public sector as a share of GDP). Estimated results are presented in regressions (4) to (6) of Table 4. We find that PUBLIC is statistically insignificant in all regressions; moreover, the coefficients of PUBLIC are much smaller than that of PRIVATE. Therefore, empirical results suggest that, for the case of China, there exists a great difference in the lending efficiency between credits to the private sector and that to the public sector: In China, the credits allocated to the private sector contribute both more importantly and more significantly to productivity growth. Meanwhile, in the regressions (4)-(6), all the other explanatory variables remain statistically significant, which strongly confirms our findings in the previous estimations of regressions (1)-(3).
Furthermore, to better identify the channels through which financial development, compared to various other conventional factors, contributes to China’s productivity
growth, we estimate the models for the growth of technical efficiency (
•
technical progress (
•
TP), respectively. Results are reported in regressions (7) and (8) of Table 4. We find a great difference between these two regressions. As shown in the growth equation of technical efficiency (i.e., regression (7)), the coefficients of PRIVATE and COMP are positive and statistically significant, indicating that financial development contributes to China’s productivity growth through promoting technical efficiency. Moreover, there is also evidence that trade development (TRADE) has a positive impact on technical efficiency, but not on technical progress. Meanwhile, empirical results in the growth equation of technical progress (i.e., regression (8)) suggest that many other explanatory variables (i.e., foreign direct investment, education and time trend) tend to affect China’s productivity mainly through influencing technical progress.
6. Conclusion
Theoretical literature on finance, productivity and growth suggests that financial development can enhance productivity growth in many ways, by raising capital allocation efficiency, and stimulating technological progress through providing financial support to R&D and innovation behaviours.
In this paper, we attempt to apply these theoretical insights to the case of China. Motivated by recent debate on the nature of China’s growth performance, we first employ the DEA non-parametric method to measure productivity change in China, and then we decompose the overall productivity change into efficiency change and technical change, and compare the growth pattern across Chinese regions. The results
show that China recorded an increase in total factor productivity from 1993 to 2001. However, productivity growth in China was mostly attributed to technical progress, rather than to the improvement in efficiency.
Moreover, to examine the relationship between finance and productivity, we use a panel dataset covering 29 Chinese provinces over the period of 1993-2001 to investigate the impact of financial development on productivity growth of China. We find that financial development significantly contributes to China’s TFP growth.
Furthermore, to better identify the channels through which financial development influences productivity, we also conduct the estimations for the growth rates of the two components of TFP (i.e., technical efficiency and technical progress). Empirical evidence suggests that financial development enhances China’s productivity mainly through raising efficiency. These findings have important policy implications to China’s future development, given the striking facts that the efficiency in China has decreased during the last decade, and that economic growth in China during this period was achieved at the expense of efficiency. As shown in the present study, financial sector can play an important role in raising efficiency. Therefore, in order to better improve China’s efficiency, further policy measures need to be forwarded in the future to stimulate the development of private-sector-oriented financial intermediation, and to provide greater market access to both private and foreign financial intermediaries.
References:
Arellano, Manuel, and Stephen R. Bond. 1991. “Some Tests of Specification for Panel Data: Monte Carlo Evidence and an Application to Employment Equations.”
Review of Economic Studies 58: 277-297.
Asdrubali, Pierfederico; Bent E. Sorensen; and Oved Yosha. 1996. “Channels of Interstate Risk Sharing: United States 1963–1990.” Quarterly Journal of
Economics 111, no. 4: 1081–110.
Bayoumi, Tamim A., and Andrew K. Rose. 1993. “Domestic Savings and Intra-national Capital Flows.” European Economic Review 37: 1197-1202. Beck, Thorsten, and Ross Levine. 2002. “Industry Growth and Capital Allocation:
Does Having a Market- or Bank-based System Matter?” Journal of Financial
Economics 64: 147-180.
Beck, Thorsten; Ross Levine; and Norman Loayza. 2000. “Finance and The Sources of Growth.” Journal of Financial Economics 58: 261-310.
Bencivenga, Valerie R., and Bruce D. Smith. 1991. “Financial Intermediation and Endogenous Growth.” Review of Economic Studies 58(2): 195-209.
Benhabib, Jess, and Mark M. Spiegel. 1994. “The Role of Human Capital in Economic Development: Evidence from Aggregate Cross-Country Data,”
Journal of Monetary Economics 34, no.2: 143-74.
Benhabib, Jess, and Mark M. Spiegel. 2000. “The Role of Financial Development in Growth and Investment.” Journal of Economic Growth 5(4): 341-360.
Blundell, Richard and Stephen Bond. 1998. “Initial Conditions and Moment Restrictions in Dynamic Panel Data Models.” Journal of Econometrics 87(1): 115-43.
Boyreau-Debray, Genevieve. 2003. “Financial Intermediation and Growth: Chinese Style.” Policy Research Working Paper 3027. Washington, D.C.: World Bank. Boyreau-Debray, Genevieve, and Shang-Jin Wei. 2004. “Can China Grow Faster? A
Diagnosis of the Fragmentation of Its Domestic Capital Market.” IMF Working
Paper, 04/76. Washington D.C.: International Monetary Fund.
Caves, Douglas W.; Laurits R. Christensen; and W. Erwin Diewert. 1982. “Multilateral Comparisons of Output, Input, and Productivity Using Superlative Index Numbers.” Economic Journal 92: 73-86.
Chow, Gregory C.. 1993. “Capital Formation and Economic Growth in China.”
Quarterly Journal of Economic 108(3): 809– 842.
Coelli, Tim J.. 1996. “A Guide to DEAP Version 2.1: A Data Envelopment Analysis (Computer) Program.” CEPA Working Papers, 8/96. University of New England, Australia.
Cortèse, Laurent, and Ping Hua. 2002. “The Effect of the Real Exchange Rate on Technological Progress: An Application to the Textile Industry in China.”
CERDI Working Paper, 2002/7. University of Auvergne, France.
Crucini, Mario J.. 1999. “On International and National Dimensions of Risk Sharing.”
Review of Economics and Statistics 81, no. 1: 73–84.
Economic Take-off”, IMF Working Paper, WP/00/86. Washington D.C.: International Monetary Fund.
Färe, Rolf. 1988. Fundamentals of Production Theory - Lecture Notes in Economics
and Mathematical Systems. Heidelberg: Springer-Verlag.
Färe, Rolf; Shawna Grosskopf; Mary Norris; and Zhongyang Zhang. 1994. “Productivity Growth, Technical Progress, and Efficiency Change in Industrialized Countries.” American Economic Review 84 (1): 66–83.
Färe, Rolf; Shawna Grosskopf; Yijan He; and Julius Horvath. 1996. “Industrial productivity growth in China: 1980–1984 vs. 1984–1985.” In Intertemporal
Production Frontiers: With Dynamic DEA, ed. Rolf Färe and Shawna Grosskopf. Boston: Kluwer Academic, Boston.
Färe, Rolf; Shawna Grosskopf; and R. Robert Russell. 1997. Index Numbers: Essays
in Honour of Sten Malmquist. Boston: Kluwer Academic Publishers.
Feldstein, Martin, and Charles Horioka. 1980. “Domestic Saving and International Capital Flows.” The Economic Journal 90: 314-329.
Goldsmith, Raymond W.. 1969. Financial Structure and Development. New Haven, CT: Yale University Press.
Green, William H.. 2000. Econometric Analysis. New Jersey: Prentice-Hall Inc. Greenwood, Jeremy, and Boyan Jovanovic. 1990. “Financial Development, Growth,
and the Distribution of Income.” Journal of Political Economy 98 (5): 1076-1107.
Groves, Theodore; Yongmiao Hong; John Mcmillan; and Barry Naughton. 1994. “Autonomy and incentives in Chinese state enterprises.” Quarterly Journal of
Economics 109 (1): 183–209.
Guillaumont Jeanneney, Sylviane, and Ping Hua. 2002. “The Balassa–Samuelson Effect and Inflation in the Chinese Provinces.” China Economic Review 13: 134-160.
Guillaumont Jeanneney, Sylviane, and Ping Hua. 2003. “Real Exchange Rate and Productivity in China?” 4th International Conference on the Chinese Economy:
The Efficiency of China’s Economic Policy, 23-24 October, Clermont-Ferrand, France. Also available as CERDI Working Paper 2003/28. University of Auvergne, France.
Guillaumont Jeanneney, Sylviane, and Ping Hua. 2005. “Appreciation of Real Exchange Rate and Productivity—Evidence from the Chinese Provinces.”
Nanjing Business Review 5: 39-62.
Iwamoto, Yasushi, and Eric Van Wincoop. 2000. “Do Border Matter? Evidence from Japanese Regional Net Capital Inflows.” International Economic Review 41, no. 1: 241-269.
Jin, Songqing; Jikun Huang; Ruifa Hu; and Scott Rozelle. 2002. “The Creation and Spread of Technology and Total Factor Productivity in China’s Agriculture.”
American Journal of Agricultural Economics 84(4): 916-930.
King, Robert G., and Ross Levine. 1993. “Finance and Growth: Schumpeter Might Be Right.” Quarterly Journal of Economics 108: 717-737.
Finance 46(4): 1445-1465.
Levine, Ross. 1997. “Financial Development and Economic Growth: View and Agenda.” Journal of Economic Literature 35: 688-726.
Levine, Ross; Norman Loayza; and Thorsten Beck. 2000. “Financial Intermediation and Growth: Causality and Causes.” Journal of Monetary Economics 46(1): 31-77.
Lin, Justin Y.. 1992. “Rural reforms and agricultural growth in China.” American
Economic Review 82: 34-51.
Lucas, Robert E.. 1988. “On the Mechanics of Economic Development.” Journal of
Monetary Economics 22, no.1: 3-42.
Maddison, Angus. 1998. The Chinese Economy: A Historical Perspective. Paris: OECD.
Mankiw, N. Gregory. 1995. “The Growth of Nations,” Brookings Papers on
Economic Activity, no 1: 275-310. Washington: Brookings Institution.
Mao, Weining, and Woo W. Koo. 1997. “Productivity Growth, Technological Progress, and Efficiency Change in Chinese Agriculture after Rural Economic Reforms: A DEA Approach.” China Economic Review 8(2): 157-74.
McKinnon, Ronald L.. 1973. Money and Capital in Economic Development. Washington: Brookings Institution.
McMillan, John; John Whalley; and Lijing Zhu. 1989. “The impact of China's reforms on agricultural productivity growth.” Journal of Political Economy 97: 781-808. Obstfeld, Maurice. 1994. “Are Industrial-Country Consumption Risks Globally Diversified?” In Capital Mobility: the Impact on Consumption, Investment, and
Growth, ed. Leonardo Leiderman and Assaf Razin. Cambridge University Press, Cambridge.
Rajan, Raghuram G., and Luigi Zingales. 1998. “Financial Dependence and Growth.”
American Economic Review 88(3): 559-586.
Ray, Subhash C., and Evangelia Desli. 1997. “Productivity Growth, Technical Progress, and Efficiency Change in Industrialised Countries: Comment.”
American Economic Review 87(5): 1033-1039.
Romer, Paul M.. 1986. “Increasing Returns and Long-Run Growth.” Journal of
Political Economy 94: 1002-1037.
Romer, Paul M.. 1990. “Endogenous Technological Change.” Journal of Political
Economy 98, no. 5: S71-S102.
Sachs, Jefferey D., and Wing T. Woo. 1997. “Understanding China’s Economic Performance.” NBER Working Paper no. 5935. Cambridge MA: National Bureau of Economic Research.
Saint-Paul, Gilles. 1992. “Technological Choice, Financial Markets and Economic Development.” European Economic Review 36(4): 763-781.
Shaw, Edwards S.. 1973. Financial Deepening in Economic Development. New York: Oxford University Press.
Shephard, Ronald W.. 1970. Theory of Cost and Production Functions. Princeton, N.J.: Princeton University Press,.