HAL Id: hal-01308228
https://hal.sorbonne-universite.fr/hal-01308228
Submitted on 27 Apr 2016
HAL is a multi-disciplinary open access archive for the deposit and dissemination of sci-entific research documents, whether they are pub-lished or not. The documents may come from teaching and research institutions in France or abroad, or from public or private research centers.
L’archive ouverte pluridisciplinaire HAL, est destinée au dépôt et à la diffusion de documents scientifiques de niveau recherche, publiés ou non, émanant des établissements d’enseignement et de recherche français ou étrangers, des laboratoires publics ou privés.
Distributed under a Creative Commons Attribution - NonCommercial| 4.0 International License
Costs of early spondyloarthritis: estimates from the first
3 years of the DESIR cohort
Stephanie Harvard, Daphne Guh, Nick Bansback, Pascal Richette, Maxime
Dougados, Aslam Anis, Bruno Fautrel
To cite this version:
Stephanie Harvard, Daphne Guh, Nick Bansback, Pascal Richette, Maxime Dougados, et al.. Costs of early spondyloarthritis: estimates from the first 3 years of the DESIR cohort. RMD Open : Rheumatic & Musculoskeletal Diseases, EULAR ; BMJ, 2016, 2, pp.e000230. �10.1136/rmdopen-2015-000230�. �hal-01308228�
ORIGINAL ARTICLE
Costs of early spondyloarthritis:
estimates from the first 3 years
of the DESIR cohort
Stephanie Harvard,1,2,3 Daphne Guh,2Nick Bansback,2,3Pascal Richette,4,5 Maxime Dougados,6,7,8,9Aslam Anis,1,2 Bruno Fautrel3,10
To cite: Harvard S, Guh D, Bansback N,et al. Costs of early spondyloarthritis: estimates from the first 3 years of the DESIR cohort. RMD Open 2016;2:e000230. doi:10.1136/rmdopen-2015-000230
▸ Prepublication history and additional material is available. To view please visit the journal (http://dx.doi.org/ 10.1136/rmdopen-2015-000230).
Received 17 December 2015 Revised 11 March 2016 Accepted 13 March 2016
For numbered affiliations see end of article.
Correspondence to
Dr Stephanie Harvard; harvards@mail.ubc.ca
ABSTRACT
Objectives:To value health resource utilisation and productivity losses in DESIR, a longitudinal French cohort of 708 patients with early spondyloarthritis (SpA) enrolled between 2007 and 2010, and identify factors associated with costs in the first 3 years of follow-up.
Methods:Self-reported clinical data from DESIR and French public data were used to value health resource utilisation and productivity losses in 2013 Euros. Factors associated with costs, including and excluding biological drugs, were identified in generalised linear models using the generalised estimating equations algorithm to account for repeated observations over participants.
Results:The mean (±SD) annual cost per patient was €5004±6870 in year 1, decreasing to €4961±7457 in year 3. Patients who never received a biologic had mean 3-year total costs of€4789±6022 compared to €38 206±19 829 among those who received a biologic. Factors associated with increased total costs were peripheral arthritis (rate ratio (RR) 1.19; 95% CI 1.04 to 1.37; p<0.0001), time on biologics (RR 1.23 per month; 1.21, 1.24; p<0.0001), and average BASFI score (RR 1.18/10 point increase; 1.15, 1.25; p<0.0001). Factors associated with increased costs excluding biologics were baseline age (RR 1.10 per 5 year increase; 1.05, 1.16; p<0.0001), peripheral arthritis (RR 1.20; 1.02, 1.40; p<0.0133), time on biologics (RR 1.04 per month; 1.02, 1.05; p<0.0001), and average BASDAI score (RR 1.21 per 10 point increase; 1.16, 1.25; p<0.0001).
Conclusions:In addition to biologics, factors like age, peripheral arthritis and disease activity independently increase SpA-related costs. This study may serve as a benchmark for cost of illness among patients with early SpA in the biologic era.
INTRODUCTION
Spondyloarthritis (SpA) is a family of chronic rheumatic diseases that includes ankylosing spondylitis (AS), psoriatic spondyloarthritis (PsA), reactive SpA, SpA with inflammatory
bowel disease and undifferentiated SpA.1 In its early phases, SpA is often undifferenti-ated, and corresponds to the concept of inflammatory back pain (IBP), the key feature of the disease.2 To date, most eco-nomic studies of SpA have examined out-comes among patients with AS or PsA specifically, and have not included patients with other SpA subtypes or with early SpA symptoms that are still evolving. A severe form of SpA, AS has been shown to cause sig-nificant pain, functional disability and loss of mobility3 In turn, these physical outcomes are associated with substantial health resource utilisation and work productivity loss among patients with AS.4 5
Key messages
What is already known about this subject?
▸ Spondyloarthritis leads to healthcare costs as well as productivity loss, the latter having been shown to be the most significant cost driver. However, there is a lack of cost-of-illness studies among patients with early SpA in the biologics era.
What does this study add?
▸ In the biologic era, medication is the greatest cost driver among patients with SpA, exceeding productivity loss. Other factors like age, periph-eral arthritis and functional ability are independ-ently associated with total costs. In a cohort of patients with early SpA using biologics for less than 3 years, biologic use was associated with increased costs outside of biologics.
How might this impact on clinical practice?
▸ This study identifies factors associated with SpA-related costs in the biologic era, potentially pointing towards priority areas for biologics use and providing a new benchmark for cost of illness among patients with early SpA.
In 2012, a systematic review identified 15 economic studies of SpA conducted worldwide since 2002, nine of which evaluated health resource utilisation and work productivity loss. The median cost of health resource utilisation in 2012 US dollars was $3764 per patient per year, compared to a median cost of productivity loss of $4999.6 More recently, biological TNF blockers have been made available for the treatment of moderate to severe SpA, increasing the cost of illness compared to previous years in which non-steroidal anti-inflammatory drugs (NSAIDs) were the only available drug therapy.7
The objective of this study was to value health resource utilisation and productivity losses among patients in the DESIR cohort,8a longitudinal, multicentre study of early SpA in France. We further aimed to determine factors associated with total costs and with costs excluding biolo-gics (‘non-biologic costs’) among DESIR patients.
METHODS Participants
The DESIR cohort9 includes 708 patients aged 18–50 with early IBP lasting more than 3 months but less than 3 years, and suggestive of SpA according to the rheuma-tologists’ assessment (score ≥5 on a 0–10 Numerical Rating Scale where 0=not suggestive and 10=very suggest-ive). Patients were required to fulfil the Calin10 or Berlin11 IBP criteria. Patients with a definitive diagnosis of non-SpA back pain, a history of previous biological TNF-blocker use, or conditions that could affect informed consent and/or compliance (eg, alcoholism, psychiatric disorders) were excluded. All patients attended their baseline study visit between October 2007 and May 2010. Follow-up visits collecting self-report questionnaire data occurred every 6 months in the first 2 years and every year thereafter, and covered the health resource use since the previous visit. Our analyses included the first 3 years of follow-up, that is, baseline plus follow-up visits at months 6, 12, 18, 24, 36. Data up to month 12 were from the DESIR database locked in February 2014, and data from months 18 to 36 from that locked in April 2015.
Costing methods
Our analysis estimated the total cost from the societal perspective (all payers combined) of all-cause health resource utilisation, specifically health practitioner visits, hospitalisations (including emergency room visits and surgeries), medical workups, and medications), and work productivity losses. Although we aimed to include as many societal costs as possible, other patient out-of-pocket costs (eg, transportation, devices, caregiver expenses and other costs sometimes termed ‘non-medical’) were not included.
Valuing health resource use
Detailed costing methods are described in online supplementary tables S1–S4. Unit costs for health
practitioner visits were estimated by adding base tariffs from the French National Health Insurance12 to the average cost of extra billings based on data from the IRDES (Institut de Recherche et de Documentation en Economie de la Santé)13 Eco-Santé database.14 Data on medical workups included laboratory analyses on blood and urine and functional/diagnostic tests. On the basis of clinical expertise, the cost of blood tests was estimated assuming the following standard laboratory analyses among patients with SpA: erythrocyte sedimentation rate (ESR); C-reactive protein (CRP); haemogram including platelets; thrombocytes; transaminases; creatinine; and creatinine clearance. Blood collection was valued at 15 min of nurse care; the unit cost of blood tests was the cost of analysis plus the cost of collection as per the French public insurance fee schedule. Urine tests were assumed to include urine protein only and no collection fee was applied. The following tests were attributed a single standard cost: mammography, MRI, bone densi-tometry, scintigraphy, respirometry, colonoscopy and fibroscopy. For X-rays, ultrasounds, scans and ‘other exams’, free-text data were reviewed individually and assigned specific examination codes which were linked to unit costs.
Data on medications included NSAIDs, DMARDs (conventional synthetic—csDMARDs—or biologic— bDMARD), corticosteroids (oral, intramuscular, intra-articular and intravenous) and analgesics. For aba-tacept, infliximab and certolizumab, prices per milli-gram were derived from list prices in France using the Vidal dictionary.15For all other drugs, cost data from the French public drug program16 were used to derive a price per milligram for each drug. Drugs were valued by multiplying price per milligram by number of milligrams per day by number of days of use (except injectable cor-ticoids, which were valued by multiplying price per milli-gram by number of millimilli-grams in the reported number of injections). Where dose data were missing, standard dosages were imputed taking into account the patient’s weight where applicable. For infliximab only, a standard cost for administration in day hospital was applied every 6 weeks for the duration of the therapy.
Data on hospitalisations were assigned a diagnosis or act code and linked to Diagnosis-Related Group (DRG) codes using 2012 data from the French national agency for hospital information (ATIH, ‘Agence Technique de l’Information sur l’Hospitalisation’).17 Selected DRG were then linked to costs using 2012 ATIH data.18 The base-case analysis used the 6-digit DRG selected as the best fit; sensitivity analyses were performed using DRG sharing the same first five digits as the best-fit DRG (see online supplementary table S3). All unit costs were adjusted to 2013 Euros based on the Consumer Price Index19and multiplied by frequency of use.
Valuing work productivity loss
Data on patients’ profession were collected in eight cat-egories (table 1). Average daily wage data were obtained
2 Harvard S,et al. RMD Open 2016;2:e000230. doi:10.1136/rmdopen-2015-000230
RMD Open
group.bmj.com
on April 27, 2016 - Published by
http://rmdopen.bmj.com/
from the French Ministry of Agriculture20 and from the French National Institute of Statistics and Economic Studies (‘INSEE’).20 Productivity loss was valued by multiplying the number of self-reported workdays lost per period by the average daily wage by professional cat-egory over the entire population of French workers as estimated by these public data sources. The age and sex distribution of the DESIR cohort was compared to that of the population of French workers from which average daily wages were obtained and wages were not further adjusted for age and sex.
Handling missing clinical and cost data
Missing cost and clinical data were imputed using the Monte Carlo Markov Chain (MCMC) multiple imput-ation procedure, the last observimput-ation carried forward
(LOCF) method, probabilistic imputation, or with nega-tive values based on clinical expertise. Specifically, for clinical variables in which fluctuations are normal and commonly observed clinically (ie, ASDAS-CRP, BASDAI, BASFI and HAQ), missing data were handled with MCMC imputation, which was considered the best strat-egy for representing this variability. For clinical variables observed to have greater stability, either the LOCF method or probabilistic imputation was used in lieu of MCMC imputation, as these methods provide better control over the variability of values imputed; LOCF was used if all patients had baseline data, while probabilistic imputation was used if baseline data were missing. The imputation model is described in detail in the online supplementary appendix.
Statistical analyses
Patient characteristics were described by the mean±SD or number (%) at baseline. For descriptive purposes, patients were divided into four subsets based on imaging status: X-ray damage only; MRI inflammation only; X-Ray damage and MRI inflammation; neither. Costs of health resource utilisation and productivity losses were expressed as yearly costs. For health resource utilisation, year 1 costs were the sum of costs reported at months 6 and 12; year 2 costs were the sum of costs reported at months 18 and 24; year 3 costs were those reported at month 36. For productivity losses, yearly costs were those reported at the 12-month, 24-month and 36-month visits. Yearly costs were described by the median and mean±SD.
To describe factors associated with annual total costs and non-biologic costs over the 3 years, we used general-ised linear models with aγ distribution of log link and a generalised estimating equations algorithm to account for repeated measures within participants. The inde-pendent variables year, baseline age and sex were chosen to be included in all models throughout develop-ment. Other independent variables of interest included baseline education; profession; presence of peripheral arthritis at baseline; DESIR study centre; number of months on biologics; baseline imaging status; baseline BASDAI and BASFI values; and mean BASDAI and BASFI values (where year 1 mean=mean of months 0, 6, 12; year 2 mean=mean of months 12, 18, 24; and year 3 mean=mean of months 24, 36). At the outset, baseline and mean BASDAI and BASFI values were tested for col-linearity and examined alone and together in models. Goodness of fit assessed by the quasi-likelihood statistic (QIC) was used to compare the model fit among models with various BASDAI and BASFI values (base-line, mean, or baseline and mean together).21–23 The model with the bestfit was chosen for inclusion in subse-quent models. All other independent variables of inter-est were examined separately in models adjusting for year, age and sex, and variables associated with the outcome at p<0.20 were selected for inclusion in subse-quent models. Model selection was then done in a
Table 1 Baseline characteristics of the DESIR cohort All (n=708) Count
Per cent Age, sex, ethnicity
Age group <25 133 18.8
Age group≥25 and <55 572 80.1
Age group≥50 3 0.4
Male 327 46.2
Caucasian 634 89.6
Highest level of education
High school or less 286 40.4 Post-secondary school 418 59 Profession*
Agriculturer 6 0.9
Artisan, retailer or small business owner 35 4.9 Executive or academic 151 21.3 Intermediate professional 54 7.7 Employee 299 42.6 Tradesperson 64 9
Without professional occupation 93 13.3 Clinical characteristics
Early onset (<17 years) 13 1.8 Late onset (>44 years) 72 10.2 Presence of extra-articular manifestations 188 26.6 Uveitis 60 8.5 Psoriasis 112 15.8 Crohn’s disease 18 2.5 HLA B27 positive 410 57.9
ASAS criteria (total): positive 486 68.6 ASAS clinical criteria: positive 404 57.1 ASAS imaging criteria: positive 286 40.4
Clinical values Mean SD
Disease duration in years 1.5 0.9 Physician’s assessment of disease
activity (0–10)
4.3 2.2 BASDAI score (0–100) 44.7 20 BASFI score (0–100) 30.4 22.8
*Per cent values do not total 100 due to missing baseline data. ASAS, the Assessment of SpondyloArthritis international Society.
backward stepwise manner, beginning with all variables and removing those that were not associated with the outcome at p<0.05 to increase goodness offit based on the QIC. All analyses were performed using SAS 9.4.
RESULTS
Patient characteristics
At baseline, the mean age of patients was 33.7±8.6 years and mean disease duration was 1.5±0.8 years. Just under half of the patients were male (46.2%) and the majority were Caucasian (89.6%) (table 1). Most patients were HLA-B27-positive (57.9%). The mean BASDAI score (on 100) at baseline was 44.7±20.0 and the mean BASFI score was 30.5±22.8. The most common extrarheumato-logical manifestations were psoriasis (15.8%) and uveitis (8.5%). At baseline, 286 patients satisfied the Assessment of SpondyloArthritis international Society (ASAS imaging criteria (40.4%) and 404 the ASAS clin-ical criteria (57.1%); 486 patients satisfied one or the other (68.6%). Table 1 shows the characteristics of patients by imaging status, that is, X-ray damage alone (7.2%), MRI inflammation (13.8%); X-ray damage and MRI inflammation (18.6%), neither (56.9%); a total of 24 patients had no data available to describe imaging status. Attendance at follow-up visits declined over time: of the 708 patients enrolled at baseline, 704 attended the 6-month visit, 698 the 12-month visit, 691 the 18-month visit, 692 the 24-month visit, and 631 the 36-month visit.
Costs
Health resource utilisation
Table 2shows the estimated costs of health resource util-isation and productivity losses among all DESIR patients over 3 years. Medication was the largest cost component in all years, representing over 50% of all costs in all years. The absolute mean cost of medication increased from €2680.2±5339.6 in year 1 to €3339.2±6224.1 in year 2 to €3396.3±6476.5 in year 3. The proportion of patients incurring costs from biologics was approxi-mately a quarter each year. The cost of biologics accounted for approximately 95% of medication costs each year.
Health practitioner visits, the second largest cost com-ponent of health resource utilisation in all years, declined from€733.2±788.9 in year 1 to €615.0±783.4 in year 2 and €481.0±676.2 in year 3. Hospitalisation costs were incurred by a quarter to a fifth of patients, repre-senting under 10% of costs in each year. The mean hos-pitalisation cost per patient was €498.4±1318.9 in year 1, €526.2±1325.7 in year 2 and €423.3±1100.8 in year 3. Medical workups were consistently the smallest com-ponent of health resource utilisation, never exceeding 5% of yearly costs.
Productivity losses
Approximately a third of patients (30.1%) incurred productivity losses in year 1; this decreased to a quarter of patients in year 2 (23.4%) and year 3 (24.4%). The mean cost of productivity losses was €843.4±2899.1 in
Table 2 Cost components as proportion of total costs by year of follow-up and biologics use
Patient group Cost component Year 1 (%) Year 2 (%) Year 3 (%) Three-year total (%)
All patients (n=708) Health practitioners 15 11 10 12
Medical workups 5 4 3 4
Hospitalisations 10 10 9 9
Biologics 50 59 66 58
All drugs 54 61 68 61
Productivity loss 17 14 10 14
All costs excluding biologics
50 41 34 42
Ever received a biologic (n=225) Health practitioners 8 7 5 7
Medical acts 4 2 2 3
Hospitalisations 6 5 3 5
Biologics 67 74 81 74
All drugs 69 75 82 76
Productivity loss 13 10 7 10
All costs excluding biologics
33 26 19 26
Never received a biologic (n=483) Health practitioners 33 29 29 31 Medical acts 9 8 9 9 Hospitalisations 22 26 32 26 Biologics 0 0 0 0 All drugs 8 7 8 7 Productivity loss 28 29 22 27
All costs excluding biologics
100 100 100 100
4 Harvard S,et al. RMD Open 2016;2:e000230. doi:10.1136/rmdopen-2015-000230
RMD Open
group.bmj.com
on April 27, 2016 - Published by
http://rmdopen.bmj.com/
year 1, €768.9±3368.0 and €497.0±1951.0 in year 3. In year 1, productivity losses represented 16.8% of total costs, compared to 14.1% of total costs in year 2 and 10.0% of total costs in year 3.
Total costs
The mean annual total cost per patient was €5004.1 ±6870.2 in year 1,€5444.1±7936.9 in year 2 and €4960.6 ±7457.4 in year 3. Mean annual total costs rose with bio-logic use: patients who did not receive a biobio-logic had mean total costs of €1867.9±3056.6 in year 1, €1628.2 ±3090.3 in year 2 and €1292.9±2059.6 in year 3, com-pared to€11 736.4±7882.6 in year 1, €13 635.4±8915.1 in year 2 and €12 833.9±8667.4 in year 3 among patients who received a biologic. In all years, biologics repre-sented over 50% of total costs, up to 66.3% in year 3. Overall, the mean 3-year total cost among patients was €15 408.7±19 793.5. Patients who never received a bio-logic had mean 3-year total costs of €4789.04±6021.8 compared to €38 205.74±19 829.3 among those who received a biologic. The estimated total costs in the cohort over 3 years amounted to€10 909 399.9±19 574.0. Of this, patients who received a biologic accounted for an estimated€8 596 291.6±4860.9 or 78.8% of all costs in the cohort. Figure 1 compares the trends in costs over the study period overall and for patients who received and did not receive a biologic.
Factors associated with costs Total costs
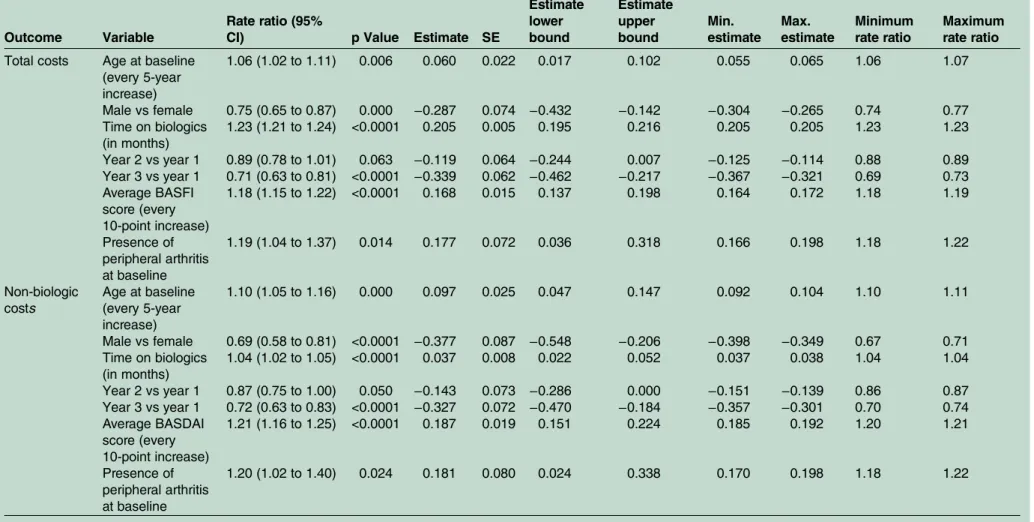
In the final model (table 3), each month of biologics use was associated with a 23% increase (rate ratio (RR): 1.23; 95% CI 1.21 to 1.24) in total costs. The presence of peripheral arthritis at baseline was associated with a 19% increase (RR: 1.19; 95% CI 1.04 to 1.37) in total costs, while every 10-point increase in the average BASFI score was associated with an 18% increase in total costs (RR: 1.18; 95% CI 1.15 to 1.22). Although absolute costs were higher in year 2 than year 1 (table 4), when
adjusting for time on biologics, costs in years 2 and 3 were significantly lower than in year 1 (table 3). Imaging status was not significantly associated with total costs and was excluded from thefinal model (figure 2).
Cost excluding biologics
In the final model (table 3), each month of biologics use was associated with a 4% increase (RR: 1.04; 95% CI 1.02 to 1.05) in non-biologic costs. The presence of per-ipheral arthritis at baseline was associated with a 20% increase (RR: 1.20; 95% CI 1.02, 1.40) in non-biologics costs; every 10-point increase in the average BASDAI score was associated with a 21% increase in non-biologic costs (RR: 1.21; 95% CI 1.16 to 1.25). Every 5-year increase in age was associated with a 10% increase (RR: 1.10; 95% CI 1.05 to 1.16) in non-biologic costs, while males had 31% less costs relative to females (RR: 0.69; 95% 0.58 to 0.81). Imaging status was not significantly associated with costs excluding biologics and was excluded from thefinal model.
DISCUSSION
This study described costs related to health resource util-isation and work productivity losses among patients with early SpA over 3 years. Our findings reflect the cost impact of biologics, which represented by far the largest cost component among DESIR patients. In the prebiolo-gic era among patients with AS, work productivity loss was observed to account for the majority of total costs, for example, from 62% of total annual costs among patients with AS in Hong Kong24 to 74% of total annual costs among patients with AS in the UK.25 In our study, an analysis of patients with early SpA in the biologic era, productivity loss may be expected to represent a lower proportion of costs given patients’ better functional status and higher drug costs; that said, productivity loss costs among DESIR patients still represented between 10% and 17% of annual costs over the study period. In terms of absolute costs, work productivity loss costs among DESIR patients (which ranged from€843 in year one to €497 in year 3) are consistent with those in a Dutch cohort of patients with early SpA (approximately €422 over 1 year).26 We note that our estimates of prod-uctivity loss costs are conservative: we did not calculate the costs of presenteeism, that is, the cost of reduced performance at work, which is another potentially important source of costs.27
Currently, there is increased interest in non-radiographic axial SpA, defined as SpA in the absence of definite sacroiliac changes on X-ray, which includes both patients who satisfy only the clinical criteria for SpA and those with active inflammation in the sacroiliac joints visible only on MRI.28 To the best of our knowl-edge, this is the first longitudinal study of patients with SpA that has explored the impact of radiographic damage on cost, distinguishing between damage on X-Ray with or without MRI inflammation. Interestingly,
Table 3 Models of total cost and non-biologic costs
Outcome Variable
Rate ratio (95%
CI) p Value Estimate SE
Estimate lower bound Estimate upper bound Min. estimate Max. estimate Minimum rate ratio Maximum rate ratio Total costs Age at baseline
(every 5-year increase) 1.06 (1.02 to 1.11) 0.006 0.060 0.022 0.017 0.102 0.055 0.065 1.06 1.07 Male vs female 0.75 (0.65 to 0.87) 0.000 −0.287 0.074 −0.432 −0.142 −0.304 −0.265 0.74 0.77 Time on biologics (in months) 1.23 (1.21 to 1.24) <0.0001 0.205 0.005 0.195 0.216 0.205 0.205 1.23 1.23 Year 2 vs year 1 0.89 (0.78 to 1.01) 0.063 −0.119 0.064 −0.244 0.007 −0.125 −0.114 0.88 0.89 Year 3 vs year 1 0.71 (0.63 to 0.81) <0.0001 −0.339 0.062 −0.462 −0.217 −0.367 −0.321 0.69 0.73 Average BASFI score (every 10-point increase) 1.18 (1.15 to 1.22) <0.0001 0.168 0.015 0.137 0.198 0.164 0.172 1.18 1.19 Presence of peripheral arthritis at baseline 1.19 (1.04 to 1.37) 0.014 0.177 0.072 0.036 0.318 0.166 0.198 1.18 1.22 Non-biologic costs Age at baseline (every 5-year increase) 1.10 (1.05 to 1.16) 0.000 0.097 0.025 0.047 0.147 0.092 0.104 1.10 1.11 Male vs female 0.69 (0.58 to 0.81) <0.0001 −0.377 0.087 −0.548 −0.206 −0.398 −0.349 0.67 0.71 Time on biologics (in months) 1.04 (1.02 to 1.05) <0.0001 0.037 0.008 0.022 0.052 0.037 0.038 1.04 1.04 Year 2 vs year 1 0.87 (0.75 to 1.00) 0.050 −0.143 0.073 −0.286 0.000 −0.151 −0.139 0.86 0.87 Year 3 vs year 1 0.72 (0.63 to 0.83) <0.0001 −0.327 0.072 −0.470 −0.184 −0.357 −0.301 0.70 0.74 Average BASDAI score (every 10-point increase) 1.21 (1.16 to 1.25) <0.0001 0.187 0.019 0.151 0.224 0.185 0.192 1.20 1.21 Presence of peripheral arthritis at baseline 1.20 (1.02 to 1.40) 0.024 0.181 0.080 0.024 0.338 0.170 0.198 1.18 1.22 6 Harvard S, et al .RMD Open 2016; 2 :e000230. doi:10.1 136/rmdopen -2015-000 230 RMD O pen group.bmj.com on April 27, 2016 - Published by http://rmdopen.bmj.com/ Downloaded from
Table 4 Health resource use and productivity loss costs in 2013 Euros by year of follow-up and biologics use
Year 1 Year 2 Year 3 Three-year total
Patient group
Resource component
% patients
with costs Mean SD Med
% patients
with costs Mean SD Med
% patients
with costs Mean SD Med
% patients
with costs Mean SD Med All patients (n=708) Health practitioners* 91 733 789 486 84 615 783 350 77 481 676 254 97 1829 1860 1239 Medical workups† 79 249 306 144 71 195 257 85 66 163 234 65 92 607 618 403 Biologics 24 2515 5322 0 27 3205 6202 0 26 3287 6460 0 32 9007 16 512 0 All drugs 100 2680 5340 155 100 3339 6224 127 100 3396 6477 99 100 9416 16 565 408 HRU costs 100 4161 5901 1297 100 4675 6780 1107 100 4464 6859 856 100 13 299 17 770 4505 Productivity loss 30 843 2899 0 23 769 3368 0 24 497 1951 0 46 2109 5846 0 All costs excluding biologics 100 2489 3629 1228 100 2239 4159 872 100 1673 2718 706 100 6402 7770 3708 All costs 100 5004 6870 1547 100 5444 7937 1287 100 4961 7457 1063 100 15 409 19 794 5358 Ever received a biologic (n=225) Health practitioners* 99 997 886 722 94 909 922 577 86 702 886 399 100 2608 2175 1952 Medical workups† 96 427 374 324 91 328 303 245 83 265 296 168 100 1020 716 922 Biologics 76 7913 6819 8510 86 10 084 7191 12 047 81 10 344 7641 12 694 100 28 341 17 606 28 554 All drugs 100 8123 6802 8548 100 10 265 7183 12 186 100 10 477 7650 12 716 100 28 865 17 568 28 962 HRU costs 100 10 214 7073 11 175 100 12 244 7422 13 437 100 11 889 7895 13 577 100 34 347 17 833 36 107 Productivity loss 41 1523 3723 0 33 1391 4827 0 34 945 2900 0 59 3859 8071 485 All costs excluding biologics 100 3823 4341 2019 100 3552 5614 1677 100 2490 3635 1217 100 9865 9727 6701 All costs 100 11 736 7883 12 477 100 13 635 8915 13 880 100 12 834 8667 13 765 100 38 206 19 829 39 306 Never received a biologic (n=483) Health practitioners* 88 610 707 352 80 478 668 211 72 378 522 177 95 1466 1566 937 Medical workups† 70 166 225 81 62 132 205 41 59 116 180 41 88 414 452 270 Biologics 0 0 0 0 0 0 0 0 0 0 0 0 0 0 0 0 All drugs 100 145 223 99 100 113 143 75 100 98 145 53 100 355 423 252 HRU costs 100 1341 1662 750 100 1149 1619 510 100 1004 1518 429 100 3495 3501 2240 Productivity loss 25 527 2360 0 19 479 2355 0 20 288 1241 0 40 1294 4206 0 All costs excluding biologics 100 1868 3057 850 100 1628 3090 566 100 1293 2060 521 100 4789 6022 2633 All costs 100 1868 3057 850 100 1628 3090 566 100 1293 2060 521 100 4789 6022 2633 *Health practitioners include physicians and other allied health professionals (nurse, physiotherapist, osteopath, etc).
†Medical workups include blood and urine tests, X-ray, ultrasound, scanner, MRI, bone densitometry, scintigraphy, respirometry, colonoscopy, mammography and fibroscopy.
et al .RMD Open 2016; 2 :e000230 . doi:10.113 6/rmdopen -2015-00023 0 7 Spondyloarthritis group.bmj.com on April 27, 2016 - Published by http://rmdopen.bmj.com/ Downloaded from
while preventing progression to radiographic SpA remains a high priority from the clinical perspective, we found no significant independent effect of imaging status on total costs or costs excluding biologics.
In this study, the most significant cost component was biologic drugs, and patients who ever received a biologic accounted for over 75% of total costs in the cohort. While this was not surprising, the finding that approxi-mately a quarter of DESIR patients had received a bio-logic by the 6-month visit (biobio-logics use at baseline was not permitted9) was higher than anticipated, suggesting that biologics use was already relatively common even among patients with early SpA in 2010. Whether biolo-gics provide good value for money is being explored in a separate study, which considers the impact of biologics on health-related quality of life. Our study also found peripheral arthritis, age and functional ability to be related to total costs, indicating subgroups where biologic use may be prioritised. In this study, we found that, in the first 3 years, treatment with biologics leads to increased costs in other health resource use domains, not a reduction as is sometimes expected; follow-up is needed to determine whether this trend holds over a longer period.
This study has some limitations. The DESIR cohort includes only patients with early SpA in France between 2007 and 2014; the results cannot necessarily be general-ised to patients with SpA with more advanced disease or in other settings at other times. Indeed, it is unknown whether similarly high rates of biologic use exist among patients with early SpA in other countries; another recently established early SpA cohort (‘SPACE’) is ongoing in the Netherlands,29 but to the best of our knowledge the prevalence of biologics use in this cohort has not as yet been reported. A recent Canadian study of patients with SpA seen clinically between 2003 and 2014 found that 48% had been treated with a biologic, yet the mean disease duration (8 years) was much longer in this sample than in DESIR.30 Generalisable to patients with early SpA in France, ourfindings will allow
for future comparisons with other cohorts of patients with early SpA, as well as the observation of trends within DESIR over time.
In terms of costing methods employed, we did not include non-SpA-related drugs, transportation or pres-enteeism, or include other patient out-of-pocket costs. Attendance declined over time and data imputation was required. Resource utilisation was self-reported and the potential exists for either underreported or overreported utilisation. In order to exclude the excess resource util-isation associated with study participation, we excluded the baseline visit from cost estimates. However, study par-ticipation could have also resulted in underestimation of resource utilisation following the baseline visit, if study visits replaced normal resource utilisation but were not reported as such. Finally, work productivity losses were estimated using self-reported workdays lost (rather than hours lost) and average daily wages by professional cat-egory, estimated from the entire population of French workers. We used profession-specific daily wages and did not further adjust wages for age and sex, although there are small differences in the age and sex distribution in DESIR compared to the French working population from which income data were derived (48% female and 77% aged 25–54 among French workers vs 54% female and 81% aged 25–54 in DESIR31). By not adjusting for the 6% higher proportion of females in DESIR, it could be argued that we have slightly overvalued productivity losses, as daily wages among females in France are lower than among males; however, we note that wage inequal-ity functions more generally to minimise the value of productivity loss. Although our valuation method pro-vides a good estimate of productivity losses, we acknow-ledge that a greater level of accuracy could be achieved with direct self-report data on wage and productivity losses expressed in hourly terms. Despite these limita-tions, our findings are consistent with another recent description of patients with early SpA26 and reflect pat-terns of health resource utilisation and work productivity loss within one of the largest early SpA cohorts to date.
Author affiliations
1University of British Columbia, Vancouver, British Columbia, Canada 2Centre for Health Evaluation and Outcome Sciences, Vancouver, British
Columbia, Canada
3Sorbonne Universités, UPMC Univ Paris 06, Paris, France 4Faculty of Medicine, University Paris Diderot, Paris, France
5AP-HP, Rheumatology Department, Lariboisiere University Hospital, Paris,
France
6AP-HP, Rheumatology B Department, Cochin University Hospital, Paris,
France
7Faculty of Medicine, University Paris Descartes, Paris, France 8EULAR Center of Excellence
9Clinical Epidemiology and Biostatistics, INSERM (U1153): PRES Sorbonne
Paris-Cité, Paris, France
10AP-HP, Rheumatology Department, Pitié Salpétrière University Hospital,
Paris, France
Acknowledgements The authors acknowledge Sabrina Dadoun, Violaine Foltz, Fanny Roure, Guillaume Bertrand and Huiying Sun. The DESIR cohort is conducted under the control of Assistance publique–Hopitaux de Paris via the
Figure 2 Yearly costs among non-biologics users.
8 Harvard S,et al. RMD Open 2016;2:e000230. doi:10.1136/rmdopen-2015-000230
RMD Open
group.bmj.com
on April 27, 2016 - Published by
http://rmdopen.bmj.com/
Clinical Research Unit Paris-Centre and under the umbrella of the French Society of Rheumatology and Inserm (Institut national de la santé et de la recherche médicale). The database management is performed within the department of epidemiology and biostatistics (Professor Jean-Pierre Daurès, D.I.M., Nîmes, France). An unrestricted grant from Wyeth Pharmaceuticals was allocated for the first 5 years of the follow-up of the recruited patients. We also wish to thank the different regional participating centres: Pr Maxime Dougados (Paris–Cochin B), Pr André Kahan (Paris–Cochin A), Pr Olivier Meyer (Paris–Bichat), Pr Pierre Bourgeois (Paris–La Pitié-Salpetrière), Pr Francis Berenbaum (Paris–Saint Antoine), Pr Pascal Claudepierre (Créteil), Pr Maxime Breban (Boulogne Billancourt), Dr Bernadette Saint-Marcoux (Aulnay-sous-Bois), Pr Philippe Goupille (Tours), Pr Jean-Francis Maillefert (Dijon), Dr Xavier Puéchal (Le Mans), Pr Daniel Wendling (Besancon), Pr Bernard Combe (Montpellier), Pr Liana Euller-Ziegler (Nice), Pr Philippe Orcel (Paris–Lariboisière), Pr Pierre Lafforgue (Marseille), Dr Patrick Boumier (Amiens), Pr Jean-Michel Ristori (Clermont- Ferrand), Dr Nadia Mehsen (Bordeaux), Pr Damien Loeuille (Nancy), Pr René-Marc Flipo (Lille), Pr Alain Saraux (Brest), Pr Corinne Miceli (Le Kremlin Bicêtre), Pr Alain Cantagrel (Toulouse), Pr Olivier Vittecoq (Rouen).
Contributors SH collected the economic data, cleaned and merged the clinical and economic data sets, undertook the costing methods described, developed the economic models, and drafted the manuscript. DG led the data
management effort, provided expert statistical input (both theoretical and in computer programming), and designed the economic models. NB made substantial contributions to the development of methods, economic aspects of model development, and the interpretation of results. PR made substantial contributions to the conception of the work and acquisition of data. MD made substantial contributions to the conception of the work, the acquisition of data, clinical aspects of model development, and the interpretation of results. AA made substantial contributions to the design of the work, economic aspects of model development, and the interpretation of results. BF led the development of costing methods, the conception and design of the work, and contributed substantially to the acquisition of data, model development and the interpretation of results. All authors reviewed the work and revised it critically for important intellectual content. All authors give final approval of the version published and agree to be accountable for all aspects of the work in ensuring that questions related to the accuracy or integrity of any part of the work are appropriately investigated and resolved.
Funding The DESIR cohort is financially supported by unrestricted grants from both the French Society of Rheumatology and Pfizer Ltd, France.
Competing interests None declared.
Ethics approval University of British Columbia Research Ethics Board.
Provenance and peer review Not commissioned; externally peer reviewed.
Data sharing statement Additional unpublished data from this study are available to peer reviewers from the researchers on request.
Open Access This is an Open Access article distributed in accordance with the Creative Commons Attribution Non Commercial (CC BY-NC 4.0) license, which permits others to distribute, remix, adapt, build upon this work non-commercially, and license their derivative works on different terms, provided the original work is properly cited and the use is non-commercial. See: http:// creativecommons.org/licenses/by-nc/4.0/
REFERENCES
1. Baraliakos X, Braun J. Spondyloarthritides.Best Pract Res Clin Rheumatol2011;25:825–42.
2. Rudwaleit M, Haibel H, Baraliakos X, et al. The early disease stage in axial spondylarthritis: results from the German Spondyloarthritis Inception Cohort.Arthritis Rheum2009;60:717–27.
3. Zink A, Thiele K, Huscher D, et al. Healthcare and burden of disease in psoriatic arthritis. A comparison with rheumatoid arthritis and ankylosing spondylitis. J Rheumatol 2006;33:86–90.
4. Barlow JH, Wright CC, Williams B, et al. Work disability among people with ankylosing spondylitis.Arthritis Rheum2001;45:424–9. 5. Boonen A, Chorus A, Miedema H, et al. Withdrawal from labour
force due to work disability in patients with ankylosing spondylitis. Ann Rheum Dis2001;60:1033–9.
6. Palla I, Trieste L, Tani C, et al. A systematic literature review of the economic impact of ankylosing spondylitis. Clin Exp Rheumatol 2012;30:S136–41.
7. Reveille JD, Ximenes A, Ward MM. Economic considerations of the treatment of ankylosing spondylitis.Am J Med Sci2012;343:371–4. 8. Dougados M, d’Agostino MA, Benessiano J, et al. The DESIR
cohort: a 10-year follow-up of early inflammatory back pain in France: study design and baseline characteristics of the 708 recruited patients.Joint Bone Spine2011;78:598–603. 9. Dougados M, Etcheto A, Molto A, et al. Clinical presentation of
patients suffering from recent onset chronic inflammatory back pain suggestive of spondyloarthritis: The DESIR cohort.Joint Bone Spine 2015;82:345–51.
10. Calin A, Porta J, Fries JF, et al. Clinical history as a screening test for ankylosing spondylitis.JAMA1977;237:2613–4.
11. Rudwaleit M, Metter A, Listing J, et al. Inflammatory back pain in ankylosing spondylitis: a reassessment of the clinical history for application as classification and diagnostic criteria.Arthritis Rheum 2006;54:569–78.
12. Caisse Nationale de l’Assurance Maladie (France). L’Assurance Maladie en Ligne. 25 February 2014. http://www.ameli.fr/assures/ soins-et-remboursements/combien-serez-vous-rembourse/ consultations/les-consultations-en-metropole/dans-le-cadre-du-parcours-de-soins-coordonnes.php
13. Institut de recherche et de documentation en économie de la santé. Institut de recherche et de documentation en économie de la santé. 28 July 28 2014. http://www.irdes.fr
14. Institut de recherche et de documentation en économie de la santé. Eco-Santé Base de Données en Licence Ouverte. April 2014, 2014. http://www.ecosante.fr/index2.php?base=FRAN&langh=FRA&langs= FRA&sessionid=
15. Vidal Group. Dictionnaire Vidal: L’information de référence sur les produits de santé. http://vidalfrance.com
16. Sécurité Sociale L’Assurance Maladie. Medic’AM. 16 February 2015. http://www.ameli.fr/l-assurance-maladie/statistiques-et-publications/ donnees-statistiques/medicament/medic-am-2008–2012.php 17. Agence Technique de l’Information sur l’Hospitalisation. Utilisation
des codes diagnostics principaux ou actes classants dans les bases. 2013. http://stats.atih.sante.fr/mco/catalogmco.php 18. Agence Technique de l’Information sur l’Hospitalisation. Tarifs MCO
et HAD. 2013. http://www.atih.sante.fr/?id=0001000021FFmorey 19. [Anonymous]. Inflation.eu: Worldwide inflation data. Triami Media
BV. http://www.inflation.eu/inflation-rates/france/historic-inflation/cpi-inflation-france.aspx
20. National Institute of Statistics and Economic Studies. Publications et statistiques pour la France ou les régions. http://www.insee.fr/fr/ themes/theme.asp?theme=4
21. Pan W. Akaike’s information criterion in generalized estimating equations.Biometrics2001;57:120–5.
22. Shen CW, Chen YH. Model selection of generalized estimating equations with multiply imputed longitudinal data.Biom J 2013;55:899–911.
23. IMORI S. Model selection criterion based on the multivariate quasi-likelihood for generalized estimating equations.Scand J Stat 2015;42:1214–24.
24. Zhu TY, Tam LS, Lee VW, et al. Costs and quality of life of patients with ankylosing spondylitis in Hong Kong.Rheumatology (Oxford) 2008;47:1422–5.
25. Ward MM. Functional disability predicts total costs in patients with ankylosing spondylitis.Arthritis Rheum2002;46:223–31. 26. van der Weijden MA, Boonen A, van der Horst-Bruinsma IE.
Problems in work participation and resource use should not be underestimated in patients with early spondyloarthritis.J Rheumatol 2014;41:2413–20.
27. Boonen A, Brinkhuizen T, Landewé R, et al. Impact of ankylosing spondylitis on sick leave, presenteeism and unpaid productivity, and estimation of the societal cost.Ann Rheum Dis2010;69:1123–8. 28. Boonen A, Sieper J, van der Heijde D, et al. The burden of
non-radiographic axial spondyloarthritis.Semin Arthritis Rheum 2015;44:556–62.
29. van den Berg R, de Hooge M, Rudwaleit M, et al. ASAS modification of the Berlin algorithm for diagnosing axial spondyloarthritis: results from the SPondyloArthritis Caught Early (SPACE)-cohort and from the Assessment of SpondyloArthritis international Society (ASAS)-cohort.Ann Rheum Dis2013;72:1646–53.
30. Bedaiwi M, Sari I, Thavaneswaran A, et al. Fatigue in ankylosing spondylitis and nonradiographic axial spondyloarthritis: analysis from a longitudinal observation cohort.J Rheumatol2015;42:2354–60. 31. Institut National de la statistique et des études économiques.
Emploi- Population Active. http://www.insee.fr/fr/mobile/etudes/ document.asp?reg_id=0&ref_id=T13F041
years of the DESIR cohort
from the first 3
Costs of early spondyloarthritis: estimates
Maxime Dougados, Aslam Anis and Bruno Fautrel
Stephanie Harvard, Daphne Guh, Nick Bansback, Pascal Richette,
doi: 10.1136/rmdopen-2015-000230
2016 2:
RMD Open
http://rmdopen.bmj.com/content/2/1/e000230
Updated information and services can be found at:
These include:
References
#BIBL
http://rmdopen.bmj.com/content/2/1/e000230
This article cites 21 articles, 7 of which you can access for free at:
Open Access
http://creativecommons.org/licenses/by-nc/4.0/
non-commercial. See:
provided the original work is properly cited and the use is
non-commercially, and license their derivative works on different terms, permits others to distribute, remix, adapt, build upon this work
Commons Attribution Non Commercial (CC BY-NC 4.0) license, which This is an Open Access article distributed in accordance with the Creative
service
Email alerting
box at the top right corner of the online article.
Receive free email alerts when new articles cite this article. Sign up in the
Notes
http://group.bmj.com/group/rights-licensing/permissions
To request permissions go to:
http://journals.bmj.com/cgi/reprintform
To order reprints go to:
http://group.bmj.com/subscribe/ To subscribe to BMJ go to: group.bmj.com on April 27, 2016 - Published by http://rmdopen.bmj.com/ Downloaded from