HAL Id: hal-01834236
https://hal.umontpellier.fr/hal-01834236
Submitted on 18 Dec 2019HAL is a multi-disciplinary open access archive for the deposit and dissemination of sci-entific research documents, whether they are pub-lished or not. The documents may come from teaching and research institutions in France or abroad, or from public or private research centers.
L’archive ouverte pluridisciplinaire HAL, est destinée au dépôt et à la diffusion de documents scientifiques de niveau recherche, publiés ou non, émanant des établissements d’enseignement et de recherche français ou étrangers, des laboratoires publics ou privés.
Nonclassical CD4 + CD49b + Regulatory T Cells as a
Better Alternative to Conventional CD4 + CD25 + T
Cells To Dampen Arthritis Severity
Rita Vicente, Julie Quentin, Anne-Laure Mausset-Bonnefont, Paul Chuchana,
Delphine Martire, Maïlys Cren, Christian Jorgensen, Pascale Louis-Plence
To cite this version:
Rita Vicente, Julie Quentin, Anne-Laure Mausset-Bonnefont, Paul Chuchana, Delphine Martire, et al.. Nonclassical CD4 + CD49b + Regulatory T Cells as a Better Alternative to Conventional CD4 + CD25 + T Cells To Dampen Arthritis Severity. Journal of Immunology, Publisher : Baltimore : Williams & Wilkins, c1950-. Latest Publisher : Bethesda, MD : American Association of Immunologists, 2015, 196 (1), pp.298 - 309. �10.4049/jimmunol.1501069�. �hal-01834236�
1
Non-classical CD4+CD49b+ regulatory T cells as a better alternative to 1
conventional CD4+CD25+ T cells to dampen arthritis severity 2
3
Rita Vicente1*,†,‡, Julie Quentin1*,†,‡, Anne-Laure Mausset-Bonnefont*,†,‡, Paul
4
Chuchana*,†,‡, Delphine Martire*,†,‡, Maïlys Cren†,‡, Christian Jorgensen*,†,‡, and
5
Pascale Louis-Plence*,†,‡
6 7
* Inserm, U1183, Institute of Regenerative Medicine and Biotherapies, Montpellier, 8
France 9
† University of Montpellier, Montpellier, France. 10
‡ CHU Saint Eloi, Institute of Regenerative Medicine and Biotherapies, Montpellier, 11
France 12
13
1 equally contributed to the study
14 15
Address correspondence to: Dr. Pascale Louis-Plence, Inserm U1183, IRMB, 80 rue 16
Augustin Fliche, 34295 Montpellier cedex 05, France. 17 Phone: (+33) 467 33 57 21/ Fax: (+33) 467 33 01 13 18 Email: pascale.plence@inserm.fr 19 20 21
Running title: CD49b+ Treg cells express multiple canonical Treg markers
22 23 24
2 Footnote:
25
This work was supported in part by research funding from the European Union 26
project Innovative Medicine Initiative 6 (“BeTheCure”; contract number 115142–2 to 27
C.J.) and by institutional fundings. J.Q. was supported by the Arthritis Foundation. 28
3 Abstract
30
Promising immunotherapeutic strategies are emerging to restore tolerance in 31
autoimmune diseases by triggering an increase in the number and/or the function of 32
endogenous regulatory T (Treg) cells, which actively control pathological immune 33
responses. Evidence suggests a remarkable heterogeneity in peripheral Treg cells 34
that warrants their better characterization in terms of phenotype and suppressive 35
function, to determine which subset may be optimally suitable for a given clinical 36
situation. 37
We found that repetitive injections of immature dendritic cells (DCs) expanded 38
FoxP3-negative CD49b+ Treg cells that displayed an effector memory phenotype.
39
These expanded Treg cells were isolated ex-vivo for transcriptome analysis and 40
found to contain multiple transcripts of the canonical Treg signature shared mainly by 41
CD25+ but also by other sub-phenotypes. We characterized the CD49b+ Treg cell
42
phenotype, underscoring its similarities with the CD25+ Treg cell phenotype and
43
highlighting some differential expression patterns for several markers, including LAG-44
3, KLRG1, CD103, ICOS, CTLA-4 and Granzyme B. Comparison of the CD25+ and
45
CD49b+ Treg cells' suppressive mechanisms, in vitro and in vivo, revealed the latter's
46
potent suppressive activity, which was partly dependent on IL-10 secretion. 47
Altogether our results strongly suggest that expression of several canonical Treg cell 48
markers and suppressive function could be FoxP3-independent, and underscore the 49
therapeutic potential of IL-10 secreting CD49b+ Treg cells in arthritis.
50 51
4
Introduction
52
Regulatory T (Treg) cells actively suppress pathological and physiological 53
immune responses, thereby contributing to the maintenance of immunological self-54
tolerance and immune homeostasis. Their development occurs in the thymus as a 55
result of high-avidity TCR interactions with self-Ags (1), and are called thymus-56
derived Treg (tTreg) cells. These Treg cell subset are characterized by a stable 57
expression of the transcription factor forkhead box P3 (FoxP3) (2) and constitutive 58
high-level expression of CD25 (IL-2 receptor a chain) and thus denoted as 59
CD4+CD25+FoxP3+ Treg cells. The severity of the autoimmune syndromes caused by
60
deficiencies in FoxP3 - scurfy in mice and IPEX in humans - highlights its central role 61
(reviewed in (3)). Treg cells also differentiate extrathymically from conventional T 62
cells and this differentiation is strongly modulated by cytokines such as IL-2 and 63
TGF-β (4-6). These Treg cells have been termed peripheral Treg (pTreg) and several 64
Ag-induced pTreg cell populations, with IL-10 based regulatory activity, appear to 65
have critical in vivo functions (7-9). Several experimental tolerogenic settings have 66
been shown to drive or increase expansion/differentiation of pTreg cells in vivo; these 67
include chronic activation and sub-immunogenic Ag presentation (10-12), exposure 68
to orally administered agonist peptides (13, 14), lymphopenia-driven homeostatic 69
expansion (15-17) and use of small molecular weight compounds such as retinoic 70
acid and histone deacetylase inhibitors (18, 19). 71
Alternative strategies to promote in vivo generation of stable pTreg cells use 72
the tolerogenic properties of immature dendritic cells (DCs). Indeed, DC-based 73
therapy has been proposed to restore tolerance in the context of several autoimmune 74
diseases (20-22). The two main strategies developed are the direct targeting of 75
antigens to DEC-205+ steady state DCs (11, 23-26) and the repetitive injection of
5
tolerogenic DCs (27-29). We have previously demonstrated that repetitive injection of 77
immature and semi-mature DCs can prevent adverse clinical outcome and protect 78
mice from experimental collagen-induced arthritis (CIA) (30, 31). This protection was 79
associated with the expansion of a particular FoxP3-negative CD4+ Treg cell
80
population characterized by the expression of CD49b (the alpha2 subunit of the 81
adhesion molecule VLA-2) which specifically binds to collagens I, II and X (30). 82
These induced CD49b+ Treg cells, which secrete high levels of IL-4 and IL-10,
83
displayed strong immunosuppressive properties in vivo, improving established CIA 84
and attenuating delayed type hypersensitivity reactions (32, 33). Similarly, Benoist 85
and Mathis’ group demonstrated that CD4+CD49b+ Treg cells, present in naïve mice,
86
were more efficient in suppressing the onset of diabetes than CD4+CD25+ Treg cells
87
(34). As with the cell population we described, these cells' effect was IL-4 and IL-10 88
dependent. Recently, Gagliani et al. showed that CD49b and the lymphocyte 89
activation gene 3 (LAG-3) define the IL-10-producing FoxP3-negative T regulatory 90
type 1 cells (35). 91
Altogether these data reveal a remarkable heterogeneity in pTreg cell 92
populations and define the CD49b molecule as a relevant marker for specific Treg 93
cell subsets. Interestingly, recent studies challenged the notion that FoxP3 94
expression is uniquely responsible for all aspects of the transcriptional signature of 95
CD4+CD25+ Treg cells and showed that FoxP3-independent epigenetic changes are
96
required for Treg cell function (36, 37). These results underscore the need to better 97
characterize the non-classical CD49b+ induced Treg cells, which are mainly
FoxP3-98
negative. We therefore investigated their suppressive mechanism in vivo and 99
compared it with that of CD25+ Treg cells in order to determine their respective
100
therapeutic capacities. 101
6
Materials and Methods
102
Mice
103
DBA/1 mice were obtained from Harlan Laboratories and were bred in our own 104
animal facility. Transgenic mice carrying the rearranged Va11.1 and Vβ8.2 TCR 105
chain genes isolated from a collagen-type II (Col II)-specific T cell hybridoma were 106
kindly provided by R. Toes (LUMC, Leiden) with the approval of W. Ladiges. C57BL/6 107
wild type and C57BL/6 IL10-/- knockout mice (KO) were obtained from Janvier
108
(B6.129P2-IL10tm1Cgn/J) and were maintained in our animal facility under specific
109
pathogen free conditions in isolated ventilated cages. Experimental groups were 110
obtained by crossing heterozygous mice to obtain IL10-KO and wild type littermates 111
with the same genetic background. Experiments were performed in accordance with 112
national guidelines and approved by the Ethics committee for Animal Research of 113
Languedoc-Roussillon (CEEA-LR-1067) and French Health Authorities (C34-172-36). 114
115
DC generation and injections
116
DCs were generated as previously described (30). Briefly, bone marrow cells were 117
harvested from the femur and tibiae of mice and washed in RPMI following red blood 118
cells lysis. T and B cells were depleted using mouse pan T and pan B Dynabeads® 119
(Dynal) and monocytes were removed by 4h plate adhesion. The remaining cells 120
were cultured in complete medium (RPMI 1640 supplemented with 5% FCS, 2mM L-121
glutamine, 5 x 10⁻⁵ M b-mercaptoethanol, 100U/ml penicillin, 100 µg/ml streptomycin,
122
essential amino acids and 1 mM sodium pyruvate) with 1,000 IU/ml of rmGM-CSF 123
(R&D Systems) and 1,000 IU/ml of rmIL-4 (R&D Systems) at 5 x 10⁵ cells/ml in
24-124
well plates. Culture medium was renewed at days 2 and 4. For in vivo experiments, 125
DCs were harvested at day 7. Syngeneic DBA/1, IL-10 KO or wild type littermates 126
7
were injected i.p. with 0.5 x 10⁶ DCs in 100 µl PBS, 7, 5 and 3 days before
127
euthanasia for splenic T cell purification. 128
129
Antibodies and FACS analysis
130
Spleens were harvested and single-cell suspensions were obtained by gentle 131
passage through 70 μm nylon mesh filters (BD Biosciences). Following red blood 132
cells lysis using ACK buffer, suspensions were pre-blocked using purified anti-133
CD16/32 Ab (2.4.G2) for 10 min. For intracellular cytokine staining, cells were 134
stimulated during 48h at 37°C with anti-CD3/anti-CD28 antibody-coated Dynabeads 135
(Dynal Biotech ASA, Oslo, Norway). During the last 4 hours of stimulation, 50 ng/ml 136
of phorbol 12-myristate 13-acetate (PMA), 1 µg/ml of ionomycin and 10 µg/ml 137
brefeldin A (Sigma-Aldrich, Zwijndrecht, The Netherlands) was added. Subsequently, 138
cells were stained with surface antibodies (20 min, on ice). Cells were fixed using the 139
eBioscience permeabilization kit according to the manufacturer’s procedure and 140
subsequently stained for intracellular markers. Data acquisition was performed on a 141
Canto II or LSR Fortessa flow cytometer (BD Biosciences, Mountain View, CA) and 142
analyses were performed using FlowJo software. 143
144
Treg cell isolation and adoptive cell transfer experiments
145
Splenocytes from DC-vaccinated mice were recovered by filtration on cell strainer, 146
washed and then CD4+ T cells purified by negative selection using Dynabeads. CD4
147
T cells were stained with anti-CD4, anti-CD49b and anti-CD25 conjugated antibodies 148
and cell sorting was performed on FACSAria (MRI platform Montpellier, Fig.S1). 149
FACS-sorted CD4+CD25+/-CD49b+ T cells (purity >95 ± 2%), CD4+CD25+CD49b
-150
(purity >96 ± 1%) or CD4+CD25-CD49b- T cells (purity >96 ± 1%), herein called
8
CD49b+, CD25+ and CD4+ cells, respectively, were washed and 1.5 x 10⁵ cells were
152
injected i.v. in the tail vein of CIA mice or were used for subsequent analyses. 153
154
Gene Chip hybridization and data analysis.
155
Total RNA from CD4+, CD25+ and CD49b+ T cells isolated from DC-injected mice and
156
non-injected mice (CD4+ only) were prepared using QIAGEN RNeasy Mini kit
157
(QIAGEN). To reduce variability, we pooled cells from multiple mice (n>10) for cell-158
sorting, and three replicates were generated for CD25+ and CD49b+ cell groups as
159
well as two replicates for CD4+ cells isolated from DC-injected and non-injected mice.
160
All gene-expression profiles were obtained from highly purified FACS-sorted T cell 161
populations (MRI platform Montpellier). RNA was amplified, labeled, and hybridized 162
(IVT Express, Affymetrix) to Affymetrix M430 PM Array Strips that cover almost all 163
known murine genes. Affymetrix microarrays were processed at the Microarray Core 164
Facility located at the IRMB institute. All chip data were uploaded to NCBI Gene 165
Expression Omnibus (accession number is GSE68621, 166
http://www.ncbi.nlm.nih.gov/geo/query/acc.cgi?acc=GSE68621) and are publicly 167
available. Microarray data were analyzed according to a previously described 168
procedure (38), to define the baseline average signal using the transcriptional profile 169
of CD4+ cells isolated from non-injected mice, and to calculate the differential
170
expression variation using the transcriptional profiles of CD4+, CD25+ and CD49b+ T
171
cells isolated from DC-injected mice. To perform a robust analysis of the differentially 172
expressed genes, we used the distribution of the number of differentially expressed 173
transcripts to determine the optimal threshold for both the co-occurrence rate and the 174
transcript expression variation (expression variation ³1.15 and occurrence of 4/4 for 175
CD4+ and 6/6 for CD25+ and CD49b+) (39).
9
177
In vitro suppressive experiments
178
CFSE-labeled CD4 effector T cells (105) were cultured with titrated numbers of either
179
FACS-sorted Treg cells or unlabeled-T effector cells in the presence of irradiated 180
allogenic splenocytes (5 x 10⁵) and 2-5 µg/ml of anti-CD3e mAb (145-2C11). After 4
181
days of culture, proliferation of effector T cells was assessed by FACS. Data were 182
analyzed using FlowJo software. 183
184
Collagen-induced arthritis (CIA) induction and evaluation
185
Male 9-12 week-old mice were immunized at the base of the tail with 100 μg of 186
bovine or chicken Collagen type II (Col II) (MD biosciences) emulsified in CFA 187
(Pierce, complemented to 4mg/ml with Mycobacterium tuberculosis H37RA) for 188
DBA/1 or C57BL/6, respectively. To boost immunization, C57BL/6 mice received an 189
i.v. injection of one million chicken Col II (2µg/ml)-loaded mature DCs on day 0. On 190
day 21, DBA/1 or C57BL/6 mice received a booster immunization at the base of the 191
tail with 100 µg of bovine Col II emulsified in IFA or chicken Col II emulsified in CFA, 192
respectively. Mice were i.v. injected with the FACS-sorted Treg cells on day 28. From 193
day 21, the thickness of each hind paw was measured 3 times a week with a caliper, 194
and the severity of arthritis was graded according to the clinical scale previously 195
described (40) with some modifications. Ankylosis was graded (score 5) and number 196
of inflamed digits was also added to obtain a maximal score of 10 per paw and 40 per 197
mouse. Clinical scores are represented as means ± SEM on a given day. 198
199
Cytokine secretion profile
10
Supernatants of FACS-sorted T cells (100,000 cells/well) were harvested 48 hours 201
following in vitro stimulation and stored at -20°C until tested for the presence of 202
murine IFN-g, IL-10, IL-4, IL-5, and IL-13. All these cytokines were quantified by 203
ELISA kits according to the manufacturer recommendations (R&D Systems). 204
205
Th1 or Th2 polarization of T cells
206
For in vitro differentiation, naïve OVA-specific CD4+ T cells from DO11.10 transgenic
207
mice were cultured during 3 days in Th1 (rIL-12, 10 ng/ml + anti IL-4 antibody, 5 µg/ 208
ml) or Th2 (rIL-4, 10 ng/ml + anti-IFN-γ antibody, 1.25 µg/ml) polarizing conditions 209
with irradiated splenocytes in the presence of OVA peptide (1µg/ml) kindly provided 210 by A. Chavanieu. 211 212 Statistics 213
Data are presented as mean ± SEM and significance was determined using 214
GraphPad Prism software (GraphPad Software). Depending on the distribution of the 215
data, parametric or non-parametric tests with appropriate comparisons were used to 216
compare groups. A one-way or repeated two-way ANOVA with a post hoc multiple 217
comparison test were used when more than two groups were compared. 218
11
Results
220
DC-induced CD49b cells display an effector memory phenotype
221
As we previously published (30, 32) and as clearly shown in figure S1, 222
repetitive injections of immature DCs significantly induced CD4+CD49b+ cells (from 5
223
± 0.2% to 9 ± 0.4%, p<0.0001) without modifying CD4+CD25+ cell frequencies (12 ±
224
0.2% to 12 ± 0.1%, NS; Fig. S1B). In naïve mice the CD4+CD49b+ cells are a
225
heterogeneous population containing FoxP3+ cells (57 ± 2%) and activated
226
CD25+FoxP3neg cells (7 ± 0.4%). After repeated DC injection, the expanded
227
CD4+CD49b+ population showed a significant decrease in the percentage of FoxP3
228
expressing cells (24 ± 1%, p<0.0001; Fig. S1B) and a significant increase in the 229
percentage of CD25negFoxP3neg cells (69 ± 0.9%, p<0.0001). These results
230
demonstrate that the induced CD49b+ cells were mostly CD25neg and FoxP3neg.
231
Although the frequency of CD4+CD25+ cells did not significantly change after
232
repeated DC injection, we observed a slight increase in the frequency of these cells 233
expressing FoxP3 (67 ± 1% to 76 ± 2%, p<0.0001). As shown in figure S1A, the 234
analyzed populations were gated as CD4+CD49b+CD25+/-, CD4+CD25+ and
235
CD4+CD25negCD49bneg cells and hereafter referred to as gated CD49b, CD25 and
236
CD4 cells, respectively. The same gating strategy was used to sort the three 237
populations. 238
To better characterize the DC-induced CD49b+ cells, we compared their cell
239
surface phenotype with those of CD25+ and CD4+ cells. We first compared the
240
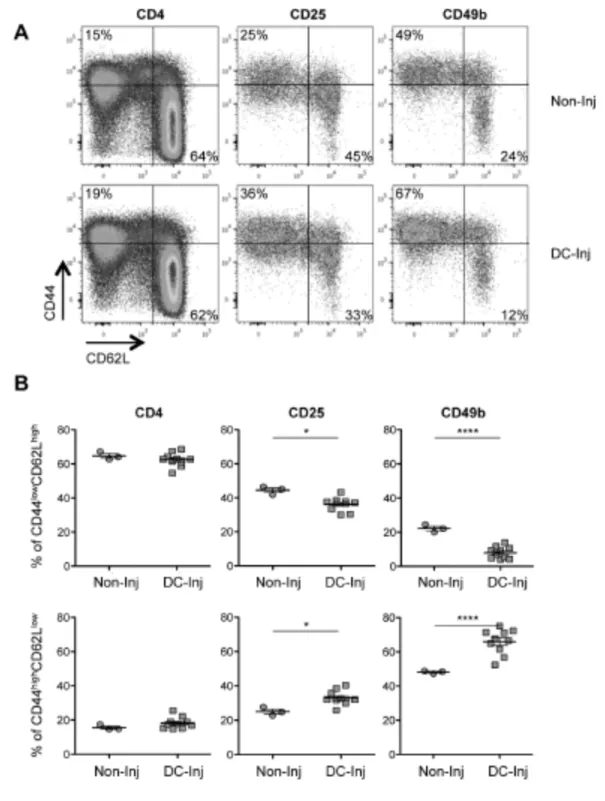
frequency of naïve T cells (defined as CD44lowCD62Lhigh) and effector memory T cells
241
(CD44highCD62Llow) within the gated CD4, CD25 and CD49b cell populations in
non-242
injected and DC-injected mice (Fig. 1A lower right and upper left quadrant, 243
respectively). The percentage of naïve T cells (Fig. 1B, top panels) was considerably 244
12
lower both in the CD25+ (44 ± 1%) and CD49b+ (26 ± 1%) cell populations, than in the
245
CD4+ cell population (65 ± 1%) of non-injected mice. Concomitantly, the percentages
246
of effector memory T cells (Fig. 1B, bottom panels) were found to be higher in the 247
CD49b+ cell population (48 ± 0.5%) than in the CD25+ and CD4+ cell populations (25
248
± 1% and 16%± 1%, respectively) of non-injected mice. Following DC-vaccination, we 249
observed a slight but significant decrease in the percentage of cells with a naïve 250
phenotype within the CD25+ cell population (44 ± 1% and 36 ± 1%, p<0.05) and more
251
importantly within the CD49b+ cell population (26 ± 1% to 10 ± 1%, p<0.0001). These
252
significant decreases in cells with naïve phenotype were associated with significant 253
increases in cells with effector memory phenotype in the CD49b+ (48 ± 0.5% to 66 ±
254
2%, p<0.0001) and to a lesser extent the CD25+ (25 ± 1% to 33 ± 1%, p<0.05) cell
255
populations. These data demonstrate that the CD49b+ T cell population induced by
256
DC vaccination clearly displayed an effector memory phenotype whereas the CD25+
257
T cells phenotype was less impacted. 258
259
The transcriptional profiles of CD49b+ T cells contain multiple transcripts of the 260
canonical Treg cell signature shared either by CD25+ or other Treg sub-261
phenotypes
262
To identify the genes differentially expressed by CD25+ and CD49b+, defined
263
as prototypical Treg transcripts, we compared the gene expression patterns of highly 264
purified T cells. The gating strategy and purity of FACS-sorted CD49b+, CD25+ and
265
CD4+ populations are given in Supplemental Figure 1. We determined the differential
266
transcriptional profiles associated with the DC-vaccination protocol by comparative 267
analysis of the FACS-sorted CD4+ cells isolated from non-injected and DC-injected
268
mice. The transcriptional profiles of DC-induced CD25+ and CD49b+ included both
13
the transcriptional profile associated with the CD4+ cell subset and the
DC-270
vaccination induced transcripts. To focus our analysis only on CD49b+ and CD25+
271
specific transcripts, we removed the transcripts associated with DC vaccination found 272
in CD4+. We were therefore able to compare these CD25+ and CD49b+ differential
273
gene expression profiles with the canonical Treg cell expression signature consisting 274
of 603 probe sets (16, 26, 37). These 603 probe sets defined by Hill et al., 275
correspond to 431 transcripts (138 down-regulated and 293 up-regulated) that 276
revealed a mean probe set redundancy of 1.4 in their study. In our study, the precise 277
and robust analysis of the differentially expressed transcripts is underscored by the 278
mean global score for probe redundancy of 2.0. We found 79 differentially expressed 279
transcripts in the CD49b+ cells (18 down-regulated and 61 up-regulated) and 128
280
differentially expressed transcripts in the CD25+ cells (28 down-regulated and 100
281
up-regulated) all in common with the canonical Treg signature, with similar 282
modulation described by Hill et al. (Fig. 2A). Interestingly the CD25+ and CD49b+ cell
283
populations shared 59 differentially expressed transcripts (11 down-regulated and 48 284
up-regulated) (Fig 2B), corresponding to 74.6% of the differentially expressed 285
transcripts found in CD49b+, therefore underscoring the similarities between CD49b+
286
and CD25+ Treg cells. Similar transcriptional expression variations were observed
287
between CD49b+ and CD25+ Treg cells with similar modulations to those described
288
by Hill et al. The common transcriptional pattern between CD49b+ and CD25+
289
contained several prototypical Treg transcripts, including Itgae, Klrg1, Nrp1, Gzmb, 290
Ebi3, Entpd1, Dusp4, Socs2, Ahr, Swap70.
291
We also found that each cell population uniquely expressed several canonical 292
Treg cell signature transcripts: 69 for CD25+ (17 down-regulated and 52
up-293
regulated) and 20 for CD49b+ (7 down-regulated and 13 up-regulated) (Fig. 2A and
14
Fig. S2). Interestingly among the transcripts specific for CD49b+, we found AcoT7,
295
LXN, 5830474E16Rik, Gpr34, Pros1 and Ndrg1. These transcripts have previously
296
been described as differentially expressed in conventional Treg cells isolated from 297
spleen, and highly expressed in CD103+ and KLRG1+ Treg cells (26). Altogether, our
298
results demonstrate that the CD49b+ transcriptional signature contains prototypical
299
Treg cell transcripts shared by either CD25+ or other Treg cell sub-phenotypes.
300 301
CD49b+ Treg cells express several canonical markers of CD25+FoxP3+ Treg 302
cells.
303
To further characterize and compare the phenotypes of the DC-induced 304
CD49b+ and CD25+ cells isolated from the same DC-vaccinated mice, we performed
305
6-10 colors cytometric analyses. We showed that, despite weakly expressing CD25 306
and the master regulator transcription factor FoxP3 (Fig. S1), CD49b+ cells express
307
markers commonly used to characterize CD25+FoxP3+ Treg cells, including CD103,
308
KLRG1, CTLA-4, latency associated peptide (LAP) and glucocorticoid-induced TNFR 309
family related gene (GITR) (Fig. 3). Interestingly, CD49b+ cells also expressed
310
programmed cell death-1 (PD1), shown to play an important role in pTreg cell 311
induction and function (41), although at a lower level than that in CD25+ cells (Fig.
312
3A). Moreover, expression of LAG-3, KLRG1 and CD103 molecules was in contrast 313
significantly higher in CD49b+ than in CD25+ cells (Fig. 3A). Within the CD49b+ cell
314
population, we noted that LAG-3 expression was mostly restricted to the FoxP3neg
315
cells, whereas KLRG1 and CD103 expressions were found in both FoxP3+ and
316
FoxP3neg cells.
317
Several molecules sustaining the Treg cell suppressive function are known to 318
be highly expressed following activation. As CD25 and CD49b expressions are also 319
15
modulated following activation, we first purified the T cells from DC-vaccinated mice 320
by FACS-sorting them (Fig. S1) and the three resulting populations were analyzed 48 321
hours following in vitro stimulation. Phenotypic analysis of activated T cells clearly 322
showed that all T cells acquired CD25 expression, and that half of the CD25+ Treg
323
cells were FoxP3+ compared to less than 4% of the CD49b+ Treg cells (Fig. 3B).
324
Interestingly, compared to the CD25+ T cell population, that of the CD49b+ T cells
325
displayed higher percentages or mean fluorescence intensity (MFI) of several 326
markers commonly expressed by Treg cells. These markers included Granzyme B 327
(GrB), GITR, inducible T-cell costimulator (ICOS), LAP and IL-10 in terms of 328
percentages, and CTLA-4 for MFI. We narrowed our focus down to effector 329
mechanisms by comparing the phenotype of IL-10 secreting T cells (gated within the 330
CD49b+ cell population) with that of FoxP3+ cells (gated within the CD25+ cell
331
population) (Fig. S3). Interestingly, the FoxP3+ cell sub-population displayed a higher
332
percentage of cells expressing LAP than did the IL-10 secreting sub-population (31 ± 333
8% versus 10 ± 0.5% respectively, p=0.008). Conversely, GITR (96 ± 0.5% versus 78 334
± 3%, p= 0.026), CTLA-4 (97 ± 0.1% versus 84 ± 5%, p= 0.02) and GrB (31 ± 8% 335
versus 2.5 ± 0.3%, p=0.010) were more frequently expressed among the IL-10 336
secreting CD49b+ Treg cells than in the FoxP3+CD25+ cell sub-population. These
337
results suggest that, besides IL-10, these three molecules could play an important 338
role in the CD49b+ suppressive function (Fig. S3).
339 340
Peripherally induced CD49b+ cells express Neuropilin-1 without co-expressing 341
Helios.
342
Neuropilin-1 (Nrp-1) was proposed as a Treg cell surface marker in 2004 (42) 343
and its coordinated expression along with Helios, an Ikaros family transcription factor, 344
16
was more recently suggested for use in distinguishing thymic derived from inducible 345
Foxp3+CD25+ Treg cells (43-46). Indeed, pTreg cell populations generated in vivo
346
displayed reduced Nrp-1 expression compared with tTreg cells, indicating Nrp-1 as a 347
tTreg specific marker (26). As previously published for NOD and C57BL/6 mice (43), 348
we showed in DBA/1 mice that the majority of CD25+ cells express concurrently
Nrp-349
1 and Helios (56 ± 3%) (Fig. 4). Interestingly, Nrp-1 expression was high (58 ± 1%) 350
but Helios expression was significantly lower (15 ± 1%) in CD49b+ cells. Moreover,
351
we observed that CD49b+Helios+ cells co-expressed Nrp-1+ and FoxP3+ suggesting
352
that among the CD49b+ cell population, almost 20% of cells could be considered as
353
natural tTreg cells based on the concomitant expression of Helios, Nrp-1 and FoxP3 354
(Fig.4). Altogether, our results show that induced FoxP3negCD49b+ Treg cells are
355
positive for Nrp-1 but do not co-express Helios, as expected for induced pTreg cells. 356
357
Peripheral induced CD49b cells express Th1- and Th2-specific transcriptional
358
factors and cytokines
359
Recent evidence suggests that the capacity of Treg cells to control polarized 360
settings can be associated with the expression of specific transcription factors, such 361
as T-bet, interferon regulatory factor 4 (IRF4) and STAT3 to control Th1, Th2 and 362
Th17 responses respectively (47-49). Treg cells expressing these transcription 363
factors can partially mimic the phenotype of the effector T cells, providing them with 364
particular homing, survival, or functional properties (50). It has been demonstrated 365
that 25% of FoxP3+ compared to only 5% of FoxP3neg Treg cells isolated from spleen
366
express the canonical Th2 transcription factor Gata3 (51). These authors showed 367
that the expression of Gata3 controlled unbalanced polarization and inflammatory 368
cytokine production in Treg cells, and that it was required for the maintenance of 369
17
FoxP3 high level expression and promoted the accumulation of Treg cells at inflamed 370
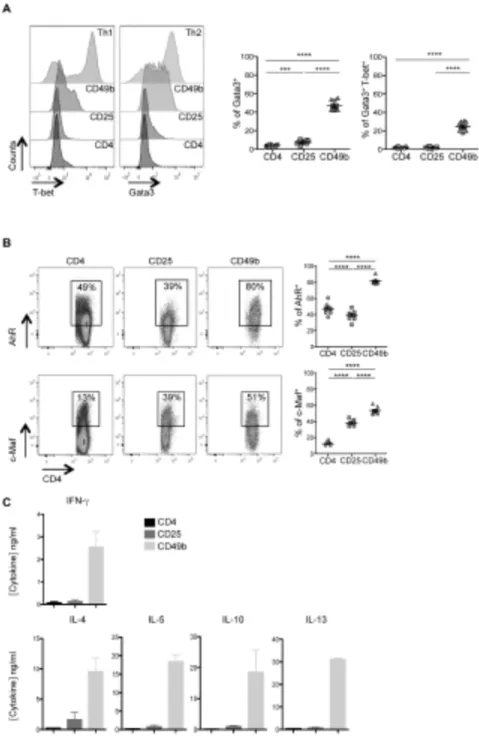
sites (51). In our study in DBA/1 mice, we observed Gata3 expression in 8 ± 1% of 371
the CD25+ cells and in 47 ± 2% of the CD49b+ cell population (Fig. 5A). Furthermore,
372
we observed that only the DC-induced CD49b+ cells displayed a considerable
373
proportion of double positive staining for T-bet and Gata3 (25 ± 1.5%), in contrast 374
with the CD4+ and CD25+ cells (2 ± 0.2% for both populations) (Fig. 5A, right panel).
375
This DC-induced increase in the number of CD49b+ cells expressing both T-bet and
376
Gata3 was statistically significant (25 ± 1.5% versus 2 ± 0.2%, p<0.0001). 377
C-Maf was the first Th2-specific transcription factor identified and has been 378
shown to play a critical role in trans-activating IL-4 and IL-10 expression during Th17 379
polarization. The ligand-activated transcription factor aryl hydrocarbon receptor 380
(AhR), like the proto-oncogene Maf, was shown to be strongly induced during Tr1 cell 381
differentiation with similarly high levels of expression found in both Tr1 and Th17 cells 382
(52). We thus evaluated the expression of c-Maf and AhR in CD49b+ cells and found
383
them in 53 ± 2% and 82 ± 1% respectively, compared to in only 38 ± 1% and 39 ± 2% 384
respectively of the CD25+ population (Fig. 5B).
385
To further characterize the cytokine secretion profile we quantified the level of 386
cytokine secretion in the supernatant of highly purified FACS-sorted cells following 387
their in vitro activation. Besides the high level of IL-10 secretion (19 ± 7 ng/ml), we 388
measured significantly elevated secretion levels of other type 2 cytokines, including 389
IL-4 (10 ± 2 ng/ml), IL-5 (18 ± 2 ng/ml) and IL-13 (31 ± 0.5 ng/ml), as well as a 390
relatively high amount of IFN-g (3 ± 1 ng/ml) in the supernatant of the CD49b+ T cell
391
population. These results revealed an obvious type 2 dominant cytokine profile for 392
the CD49b+ Treg cells and underscored their dissimilarity with Tr1 cells, which
393
secrete high levels of IL-10 without concomitant secretion of IL-4 (40, 53). 394
18 395
Polyclonal and Ag-specific CD49b+ Treg cells have potent in vitro and in vivo 396
suppressive capacities
397
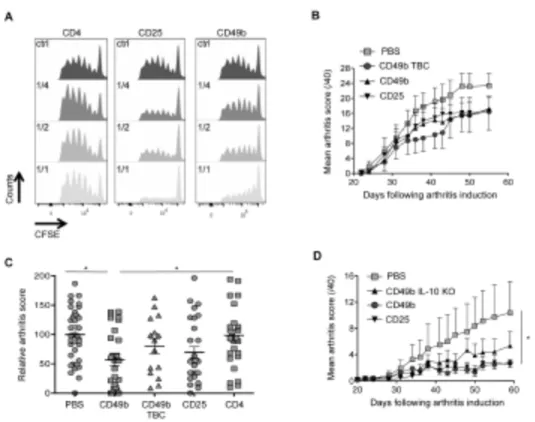
We compared the in vitro potential of CD49b+ and CD25+ Treg cells to
398
functionally suppress the proliferation of CD4+ T cells by co-cultivating Treg and
399
responder cell populations stimulated by a polyclonal T cell receptor stimulator (anti-400
CD3 mAb) and in the presence of antigen-presenting cells. Addition of CD49b+ or
401
CD25+ Treg cells reduced the proliferation, as measured by the CFSE dilution, in a
402
dose-dependent manner thus confirming their potent in vitro suppressive capacities 403
(Fig 6A). 404
We previously demonstrated the in vivo therapeutic potential of CD49b+ Treg
405
cells to protect against (30) as well as to improve the condition of established arthritis 406
(32). To further investigate the therapeutic potential of CD49b+ Treg cells, we
407
compared their protective effect with that of CD25+ Treg cells isolated from the same
408
DBA/1 mice and with CD49b+ Treg cells isolated from Col II-specific T cell transgenic
409
mice (TBC). We repeatedly injected syngeneic mice intraperitoneally with 0.5 x 10⁶
410
DCs the week before their euthanasia. CD4+ T cells were pre-purified and the Treg
411
cells were FACS-sorted to obtain >98% pure population. The FACS-sorted 412
populations were adoptively transferred intravenously into collagen-induced arthritic 413
(CIA) mice on day 28, at the onset of the clinical signs. In this experimental setting 414
that mimics the clinical situation, we observed a similar decrease of arthritis severity 415
in mice injected with either of the polyclonal Treg cells, CD49b+ or CD25+, isolated
416
from the same DBA/1 mouse, or with the antigen-specific CD49b+ Treg cells (CD49b
417
TBC, Fig. 6B). Similar results were obtained in several independent experiments, and 418
we performed robust statistical analyses using relative arthritic scores calculated 419
19
using the mean of the PBS-treated mice as 100% disease severity for each 420
experiment. We included in these experiments a control group of mice, which were 421
injected with the CD4+ cell population. As shown in figure 6C, injection of polyclonal
422
CD49b+ Treg cells markedly and significantly decreased the disease severity
423
compared with PBS-treated or CD4+-treated mice. We observed a tendency towards
424
decreased disease severity after injection of the CD25+ Treg cells or of the
antigen-425
specific CD49b+ Treg cells isolated from TBC mice, however these decreases were
426
not significant. These results in the CIA experimental model suggest that the use of 427
CD49b+ Treg cells may represent the best therapeutic strategy, over the use of
428
natural CD25+ Treg cells.
429
Finally, to further investigate the in vivo suppressive mechanism, we 430
performed similar adoptive transfer experiments with CD49b+ Treg cells isolated from
431
IL-10 KO mice. In this experimental setting, CD49b+ Treg cells were isolated from
IL-432
10 KO or wild-type littermates and injected on day 28 into arthritis-induced C57BL/6 433
mice. As clearly shown in figure 6D, injection of CD49b+ isolated from wild-type
434
littermates significantly protected mice from arthritis whereas IL-10 deficient CD49b+
435
Treg cells were less protective. These results underscore the partial involvement of 436
IL-10 secretion in the CD49b+ Treg protective effect and suggest that alternative
437
mechanisms might be important for their in vivo suppressive function. 438
20
Discussion
440
The discovery that Treg cells can control autoimmune inflammatory responses 441
has led to great enthusiasm for their clinical application in autoimmune diseases such 442
as rheumatoid arthritis (RA). The hope is that the impaired Treg cell differentiation 443
may be corrected by adoptive transfer of in vitro-generated autologous Treg cells or 444
by immunotherapeutic strategies triggering an increase in the number and/or an 445
improved functioning of endogenous Treg cells. 446
In vitro generation of autologous Treg cells could be a treatment option for
447
multiple autoimmune diseases, including experimental autoimmune 448
encephalomyelitis, diabetes, colitis, and lupus (54-56). However, this approach is 449
quite challenging because it is difficult to generate and/or expand Treg cells with 450
specific Ag specificity, especially when the immunodominant epitopes are 451
uncharacterized, such as in RA. Nevertheless, in vitro expansion of Col II-specific Tr1 452
cells isolated from RA patients was recently demonstrated (57). Pre-clinical proof-of-453
concept concerning the therapeutic potential of in vitro generated Col II-specific Tr1 454
cells has also been recently validated in two experimental models of arthritis (40). 455
Altogether these results support the therapeutic use of ex-vivo expanded autologous 456
Ag-specific Treg cells in RA. 457
However, some evidence suggests that Treg cells generated in vitro are 458
phenotypically and functionally unstable, whereas those induced in vivo are 459
epigenetically more stable and would lead to a longer-lasting therapeutic effect (4, 460
58, 59). The in vivo-induced Treg cells are usually Ag specific, which implies a likely 461
more efficient effect in treating autoimmune diseases. In RA patients, TNF-α blocking 462
antibodies have been described as an effective way to stimulate the induction of 463
peripheral FoxP3+ Treg cells, overcoming the impaired peripheral Treg cell
21
differentiation (60). For all these reasons, the development of strategies to promote in 465
vivo generation of Ag-specific Treg cells appears crucial for the treatment of
466
autoimmune diseases. 467
The aim of our study was to better characterize a particular sub-population of 468
in vivo-induced CD49b+ Treg cells. We demonstrated that this particular Treg cell
469
subset expresses several canonical markers of Treg cells while being mostly 470
negative for CD25 and FoxP3, which are routinely used to identify Treg cells. We first 471
demonstrated that 30% of the Treg cell signature was found in the CD25+ Treg cell
472
specific expression profile. Indeed, the Treg cell canonical signature is a composite 473
signature derived from Treg cells isolated from several lymphoid organs (37). This 474
bulk of Treg cell sub-phenotypes could explain the lack of complete overlapping with 475
the specific transcriptional profile of CD25+ cells in our study. A similar lack of
476
complete overlapping has previously been observed when comparing the 477
transcriptional profile of converted FoxP3+ Treg cells with the canonical Treg cell
478
signature (26). Interestingly, the induced CD49b+ Treg cells shared a transcriptional
479
profile common to CD25+ Treg cells and the canonical Treg cell signature. We
480
showed that 75% of the differentially expressed transcripts found in CD49b+ T cells
481
were common with those found in CD25+ T cells, underscoring the similarities
482
between CD49b+ and CD25+ Treg cells. Indeed, we demonstrated that these cells
483
share a common signature of 59 prototypical Treg cell transcripts including effector 484
molecules and transcription factors. Several transcripts from this common signature 485
have been proposed as promising candidates to specifically discriminate between 486
Ag-induced and homeostatically converted Treg cells, including Itgae, Ctla4, Entpd1 487
(CD39), Ebi3 (a component of IL35), Irf4, αEβ7 (CD103) and Klrg1 (a member of the 488
killer cell lectin-like receptor family). The CD49b+ Treg cell transcriptional profile also
22
contained several specific transcripts in common with the canonical Treg signature. 490
These results suggest an overlap of the transcriptional profile of CD49b+ Treg cells
491
with several other Treg sub-phenotypes. 492
We validated by FACS analyses the common expression of several markers 493
between CD25+ and CD49b+ cells that were differentially expressed compared with
494
CD4+. Among these markers, CD49b and KLRG1, both considered as NK cell
495
markers and minimally expressed on conventional CD4+ T cells, were previously
496
observed in an extrathymically derived subset of CD4+CD25+FoxP3+ Treg cells (61).
497
Within the sub-population of CD25+FoxP3+ Treg cells in the spleen, KLRG1+ Treg
498
cells were previously shown to display a more activated phenotype 499
(CD69+CD62LlowCD103+CD44high) than KLRG1neg Treg cells. Furthermore,
cell-500
surface staining of homeostatically converted FoxP3+ cells revealed them as
501
uniformly CD103+, an excellent marker for identifying in vivo–activated FoxP3+CD4+
502
Treg cells, and that 50% of the cells expressed KLRG1 (26). We showed that the two 503
markers, KLRG1 and CD103, were expressed on CD49b+ and CD25+ cells and, as
504
previously observed for the CD4+CD25+FoxP3+ Treg cells, were associated with an
505
activated phenotype for the CD49b cells. Similarly, Nrp-1 was previously described 506
on a population of activated/memory FoxP3negNrp-1+ in secondary lymphoid organs
507
and inflamed tissues, which could imply that the expression of Nrp-1 is associated 508
with the CD49b+ activated/memory phenotype. Finally, the lack of concomitant
509
expression of Nrp-1 and Helios as well as their effector/memory phenotype confirm 510
the peripheral origin of these cells. 511
Initially characterized as a Th2 specific cytokine, IL-10 has since been found 512
expressed by almost all CD4+ T cells, including CD25+FoxP3+ Treg cells and Tr1
513
cells, but also Th1, Th2 and Th17 cells, in order to promote immune homeostasis. 514
23
Previous mouse studies have described the collaborative actions of c-Maf with AhR 515
and the ICOS receptor ligation that drive IL-10 expression and promote Tr1 516
differentiation (52, 62). We demonstrated in this study that the CD49b+ Treg cells
517
highly express these three molecules suggesting that, similarly to Tr1 cells, several 518
transcriptional pathways, associated with high secretion of IL-10, are activated. 519
CD49b+ cells are also positive for the Th2 specific transcription factor Gata3 and 30%
520
of the cells are double positive for T-bet and Gata3 with concomitant secretion of 521
IFN-g and Th2 cytokines. The co-expression of T-bet and Gata3 has been previously 522
observed in vivo following viral infection and this hybrid phenotype appeared to be 523
stable (63). Altogether our results suggest that the CD49b+ cells display a balanced
524
Th2/Th1 phenotype that could endow them with specific properties to better control 525
effector T cell responses. 526
Other similarities and differences between IL-10-secreting CD49b+ Treg cells
527
and Tr1 cells can be discussed. Co-expression of CD49b and LAG-3 has been 528
recently proposed as specific for Tr1 cells (35). In our experimental setting, only 5 to 529
10% of CD49b+ Treg cells were positive for LAG-3 before in vitro activation and
530
interestingly CD49b+LAG-3+ cells are mostly FoxP3 negative cells like Tr1 cells.
531
Furthermore Tr1 cells are reported to be induced at mucosal sites in response to 532
antigen stimulation in the presence of IL-10. We observed that IL-10 deficient DCs 533
promoted IL-10 secreting CD49b+ Treg cell expansion in several lymphoid organs of
534
wild type animals suggesting that, in contrast to Tr1 cells (64), the IL-10 secretion by 535
DCs is dispensable for the expansion of CD49b+ (P. Louis-Plence, unpublished data).
536
Altogether our results suggest that the CD49b+ Treg cells constitute a Treg
sub-537
phenotype that shares similarities with the CD25+ Treg cells as well as with the Tr1
24
cells, and should be considered alongside other sub-phenotypes as homeostatically 539
converted or antigen-induced. 540
Here we have investigated the suppressive function of CD25+ and CD49b+
541
Treg cell populations in vitro and in vivo, in the experimental model of CIA. In vitro, 542
both Treg cell populations similarly suppressed the T cell proliferation. To compare 543
their therapeutic potential in CIA, we injected CD25+, polyclonal CD49b+ or Col
II-544
specific CD49b+ Treg cells at the onset of clinical signs of arthritis. As previously
545
described (32), we demonstrated a significant reduction of these clinical signs 546
following injection of polyclonal CD49b+ Treg cells. Although not significant, we also
547
observed decreased clinical signs following injection of CD25+ or Col II-specific
548
CD49b+ Treg cells. Our results suggest that following their activation by self-Ag(s),
549
the CD49b+ regulatory T cells display a potent bystander suppressive function and as
550
polyclonal in vivo-expanded Treg cells, they could be a better alternative to classical 551
Treg cells for arthritis treatment. The suppressive function of CD49b+ Treg cells was
552
found to be partially dependent on IL-10 secretion. Moreover expression of several 553
canonical Treg markers, implicated in the Treg suppressive function, suggests that 554
other molecules might also play a role in the CD49b suppressive activity. Indeed, GrB 555
and CTLA-4 have been shown to play a crucial role in the suppressive function of 556
conventional CD25+FoxP3+ Treg cells and thus might also play an important role in
557
the suppressive function of CD49b+ Treg cells. Furthermore, CD103 expression could
558
also be implicated in their suppressive function as its expression was shown to be 559
responsible for the retention of Treg cells in inflamed tissue by interaction with its 560
ligand E-cadherin (65, 66). Finally, expression of the alpha2 integrin CD49b itself, 561
could also be important for their function since it was demonstrated that this integrin 562
is required for the migration of memory CD4 T-cell precursors into their survival 563
25
niches of the bone marrow (67). Since VLA-2 also binds collagen II, expression of 564
CD49b could provide Treg cells with particular homing, survival, or more potent 565
suppressive function in the context of arthritis since collagen II is expressed by the 566
damaged cartilage. 567
In this study, we have provided an in-depth characterization of the CD49b+
568
Treg cells, underscoring their similarities with other Treg sub-phenotypes and 569
highlighting specific expression patterns for several markers including ICOS, CTLA-4 570
and GrB. The expression of these canonical Treg markers strongly supports the 571
notion that several suppressive mechanisms could be FoxP3-independent. Their 572
potent suppressive activity in vivo, higher than that of the classical CD25+ Treg cells,
573
underscores the need to select appropriate Treg subsets for a given clinical 574
application and supports their therapeutic application in RA. 575
576
Acknowledgments
577
We thank Myriam Boyer and Christophe Duperray (Montpellier RIO Imaging 578
platform) for performing cell-sorting experiments with the FACSAria and the 579
ECELLFRANCE national infrastructure for providing the LSR Fortessa cytometer. We 580
also thank Véronique Pantesco for gene-chip hybridization and the animal facility 581
staff located at the INM institute in Montpellier (RAM network) for their expert care of 582
the mice colonies. 583
584
References
585
1. Klein, L., and K. Jovanovic. Regulatory T cell lineage commitment in the thymus. 586
Semin Immunol 23:401-409.
587
2. Wing, K., and S. Sakaguchi. Regulatory T cells exert checks and balances on self 588
tolerance and autoimmunity. Nat Immunol 11:7-13. 589
3. Ziegler, S. F. 2006. FOXP3: of mice and men. Annu Rev Immunol 24:209-226. 590
26
4. Chen, Q., Y. C. Kim, A. Laurence, G. A. Punkosdy, and E. M. Shevach. 2003. IL-2 591
controls the stability of Foxp3 expression in TGF-beta-induced Foxp3+ T cells in vivo. J 592
Immunol 186:6329-6337.
593
5. Curotto de Lafaille, M. A., and J. J. Lafaille. 2009. Natural and adaptive foxp3+ 594
regulatory T cells: more of the same or a division of labor? Immunity 30:626-635. 595
6. Zheng, S. G., J. Wang, P. Wang, J. D. Gray, and D. A. Horwitz. 2007. IL-2 is essential for 596
TGF-beta to convert naive CD4+CD25- cells to CD25+Foxp3+ regulatory T cells and for 597
expansion of these cells. J Immunol 178:2018-2027. 598
7. O'Garra, A., and P. Vieira. 2004. Regulatory T cells and mechanisms of immune 599
system control. Nat Med 10:801-805. 600
8. Hawrylowicz, C. M., and A. O'Garra. 2005. Potential role of interleukin-10-secreting 601
regulatory T cells in allergy and asthma. Nat Rev Immunol 5:271-283. 602
9. Roncarolo, M. G., S. Gregori, M. Battaglia, R. Bacchetta, K. Fleischhauer, and M. K. 603
Levings. 2006. Interleukin-10-secreting type 1 regulatory T cells in rodents and 604
humans. Immunol Rev 212:28-50. 605
10. Verginis, P., K. A. McLaughlin, K. W. Wucherpfennig, H. von Boehmer, and I. 606
Apostolou. 2008. Induction of antigen-specific regulatory T cells in wild-type mice: 607
visualization and targets of suppression. Proc Natl Acad Sci U S A 105:3479-3484. 608
11. Kretschmer, K., I. Apostolou, D. Hawiger, K. Khazaie, M. C. Nussenzweig, and H. von 609
Boehmer. 2005. Inducing and expanding regulatory T cell populations by foreign 610
antigen. Nat Immunol 6:1219-1227. 611
12. Apostolou, I., and H. von Boehmer. 2004. In vivo instruction of suppressor 612
commitment in naive T cells. J Exp Med 199:1401-1408. 613
13. Mucida, D., N. Kutchukhidze, A. Erazo, M. Russo, J. J. Lafaille, and M. A. Curotto de 614
Lafaille. 2005. Oral tolerance in the absence of naturally occurring Tregs. J Clin Invest 615
115:1923-1933. 616
14. Curotto de Lafaille, M. A., N. Kutchukhidze, S. Shen, Y. Ding, H. Yee, and J. J. Lafaille. 617
2008. Adaptive Foxp3+ regulatory T cell-dependent and -independent control of 618
allergic inflammation. Immunity 29:114-126. 619
15. Knoechel, B., J. Lohr, E. Kahn, J. A. Bluestone, and A. K. Abbas. 2005. Sequential 620
development of interleukin 2-dependent effector and regulatory T cells in response 621
to endogenous systemic antigen. J Exp Med 202:1375-1386. 622
16. Haribhai, D., W. Lin, B. Edwards, J. Ziegelbauer, N. H. Salzman, M. R. Carlson, S. H. Li, 623
P. M. Simpson, T. A. Chatila, and C. B. Williams. 2009. A central role for induced 624
regulatory T cells in tolerance induction in experimental colitis. J Immunol 182:3461-625
3468. 626
17. Curotto de Lafaille, M. A., A. C. Lino, N. Kutchukhidze, and J. J. Lafaille. 2004. CD25- T 627
cells generate CD25+Foxp3+ regulatory T cells by peripheral expansion. J Immunol 628
173:7259-7268. 629
18. Benson, M. J., K. Pino-Lagos, M. Rosemblatt, and R. J. Noelle. 2007. All-trans retinoic 630
acid mediates enhanced T reg cell growth, differentiation, and gut homing in the face 631
of high levels of co-stimulation. J Exp Med 204:1765-1774. 632
19. Edwards, A. J., and S. L. Pender. Histone deacetylase inhibitors and their potential 633
role in inflammatory bowel diseases. Biochem Soc Trans 39:1092-1095. 634
20. Amodio, G., A. Mugione, A. M. Sanchez, P. Vigano, M. Candiani, E. Somigliana, M. G. 635
Roncarolo, P. Panina-Bordignon, and S. Gregori. HLA-G expressing DC-10 and CD4(+) T 636
cells accumulate in human decidua during pregnancy. Hum Immunol 74:406-411. 637
27
21. Gross, C. C., and H. Wiendl. Dendritic cell vaccination in autoimmune disease. Curr 638
Opin Rheumatol 25:268-274.
639
22. Hilkens, C. M., J. D. Isaacs, and A. W. Thomson. 2010. Development of dendritic cell-640
based immunotherapy for autoimmunity. Int Rev Immunol 29:156-183. 641
23. Mahnke, K., Y. Qian, J. Knop, and A. H. Enk. 2003. Induction of CD4+/CD25+ 642
regulatory T cells by targeting of antigens to immature dendritic cells. Blood 643
101:4862-4869. 644
24. Kretschmer, K., T. S. Heng, and H. von Boehmer. 2006. De novo production of 645
antigen-specific suppressor cells in vivo. Nat Protoc 1:653-661. 646
25. Idoyaga, J., C. Fiorese, L. Zbytnuik, A. Lubkin, J. Miller, B. Malissen, D. Mucida, M. 647
Merad, and R. M. Steinman. Specialized role of migratory dendritic cells in peripheral 648
tolerance induction. J Clin Invest 123:844-854. 649
26. Feuerer, M., J. A. Hill, K. Kretschmer, H. von Boehmer, D. Mathis, and C. Benoist. 650
2010. Genomic definition of multiple ex vivo regulatory T cell subphenotypes. Proc 651
Natl Acad Sci U S A 107:5919-5924.
652
27. Jonuleit, H., E. Schmitt, G. Schuler, J. Knop, and A. H. Enk. 2000. Induction of 653
interleukin 10-producing, nonproliferating CD4(+) T cells with regulatory properties 654
by repetitive stimulation with allogeneic immature human dendritic cells. J Exp Med 655
192:1213-1222. 656
28. Menges, M., S. Rossner, C. Voigtlander, H. Schindler, N. A. Kukutsch, C. Bogdan, K. 657
Erb, G. Schuler, and M. B. Lutz. 2002. Repetitive injections of dendritic cells matured 658
with tumor necrosis factor alpha induce antigen-specific protection of mice from 659
autoimmunity. J Exp Med 195:15-21. 660
29. Petzold, C., J. Riewaldt, T. Koenig, S. Schallenberg, and K. Kretschmer. Dendritic cell-661
targeted pancreatic beta-cell antigen leads to conversion of self-reactive CD4(+) T 662
cells into regulatory T cells and promotes immunotolerance in NOD mice. Rev Diabet 663
Stud 7:47-61.
664
30. Charbonnier, L. M., L. M. van Duivenvoorde, F. Apparailly, C. Cantos, W. G. Han, D. 665
Noel, C. Duperray, T. W. Huizinga, R. E. Toes, C. Jorgensen, and P. Louis-Plence. 2006. 666
Immature dendritic cells suppress collagen-induced arthritis by in vivo expansion of 667
CD49b+ regulatory T cells. J Immunol 177:3806-3813. 668
31. van Duivenvoorde, L. M., P. Louis-Plence, F. Apparailly, E. I. van der Voort, T. W. 669
Huizinga, C. Jorgensen, and R. E. Toes. 2004. Antigen-specific immunomodulation of 670
collagen-induced arthritis with tumor necrosis factor-stimulated dendritic cells. 671
Arthritis Rheum 50:3354-3364.
672
32. Charbonnier, L. M., W. G. Han, J. Quentin, T. W. Huizinga, J. Zwerina, R. E. Toes, C. 673
Jorgensen, and P. Louis-Plence. 2010. Adoptive transfer of IL-10-secreting 674
CD4+CD49b+ regulatory T cells suppresses ongoing arthritis. J Autoimmun 34:390-675
399. 676
33. Han, W. G., E. I. van der Voort, H. el Bannoudi, P. Louis-Plence, T. W. Huizinga, and R. 677
E. Toes. 2010. DX5(+)CD4(+) T cells modulate cytokine production by CD4(+) T cells 678
towards IL-10 via the production of IL-4. Eur J Immunol 40:2731-2740. 679
34. Gonzalez, A., I. Andre-Schmutz, C. Carnaud, D. Mathis, and C. Benoist. 2001. Damage 680
control, rather than unresponsiveness, effected by protective DX5+ T cells in 681
autoimmune diabetes. Nat Immunol 2:1117-1125. 682
35. Gagliani, N., C. F. Magnani, S. Huber, M. E. Gianolini, M. Pala, P. Licona-Limon, B. Guo, 683
D. R. Herbert, A. Bulfone, F. Trentini, C. Di Serio, R. Bacchetta, M. Andreani, L. 684
28
Brockmann, S. Gregori, R. A. Flavell, and M. G. Roncarolo. 2013. Coexpression of 685
CD49b and LAG-3 identifies human and mouse T regulatory type 1 cells. Nat Med 686
19:739-746. 687
36. Ohkura, N., M. Hamaguchi, H. Morikawa, K. Sugimura, A. Tanaka, Y. Ito, M. Osaki, Y. 688
Tanaka, R. Yamashita, N. Nakano, J. Huehn, H. J. Fehling, T. Sparwasser, K. Nakai, and 689
S. Sakaguchi. T cell receptor stimulation-induced epigenetic changes and Foxp3 690
expression are independent and complementary events required for Treg cell 691
development. Immunity 37:785-799. 692
37. Hill, J. A., M. Feuerer, K. Tash, S. Haxhinasto, J. Perez, R. Melamed, D. Mathis, and C. 693
Benoist. 2007. Foxp3 transcription-factor-dependent and -independent regulation of 694
the regulatory T cell transcriptional signature. Immunity 27:786-800. 695
38. Chuchana, P., D. Marchand, M. Nugoli, C. Rodriguez, N. Molinari, and J. A. Garcia-696
Sanz. 2007. An adaptation of the LMS method to determine expression variations in 697
profiling data. Nucleic Acids Res 35:e71. 698
39. Chuchana, P., P. Holzmuller, F. Vezilier, D. Berthier, I. Chantal, D. Severac, J. L. 699
Lemesre, G. Cuny, P. Nirde, and B. Bucheton. 2010. Intertwining threshold settings, 700
biological data and database knowledge to optimize the selection of differentially 701
expressed genes from microarray. PLoS One 5:e13518. 702
40. Asnagli, H., D. Martire, N. Belmonte, J. Quentin, H. Bastian, M. Boucard-Jourdin, P. B. 703
Fall, A. L. Mausset-Bonnefont, A. Mantello-Moreau, S. Rouquier, I. Marchetti, C. 704
Jorgensen, A. Foussat, and P. Louis-Plence. 2014. Type 1 regulatory T cells specific for 705
collagen-type II as an efficient cell-based therapy in arthritis. Arthritis Res Ther 706
16:R115. 707
41. Francisco, L. M., V. H. Salinas, K. E. Brown, V. K. Vanguri, G. J. Freeman, V. K. Kuchroo, 708
and A. H. Sharpe. 2009. PD-L1 regulates the development, maintenance, and function 709
of induced regulatory T cells. J Exp Med 206:3015-3029. 710
42. Bruder, D., M. Probst-Kepper, A. M. Westendorf, R. Geffers, S. Beissert, K. Loser, H. 711
von Boehmer, J. Buer, and W. Hansen. 2004. Neuropilin-1: a surface marker of 712
regulatory T cells. Eur J Immunol 34:623-630. 713
43. Yadav, M., C. Louvet, D. Davini, J. M. Gardner, M. Martinez-Llordella, S. Bailey-714
Bucktrout, B. A. Anthony, F. M. Sverdrup, R. Head, D. J. Kuster, P. Ruminski, D. Weiss, 715
D. Von Schack, and J. A. Bluestone. 2012. Neuropilin-1 distinguishes natural and 716
inducible regulatory T cells among regulatory T cell subsets in vivo. J Exp Med 717
209:1713-1722, S1711-1719. 718
44. Weiss, J. M., A. M. Bilate, M. Gobert, Y. Ding, M. A. Curotto de Lafaille, C. N. 719
Parkhurst, H. Xiong, J. Dolpady, A. B. Frey, M. G. Ruocco, Y. Yang, S. Floess, J. Huehn, 720
S. Oh, M. O. Li, R. E. Niec, A. Y. Rudensky, M. L. Dustin, D. R. Littman, and J. J. Lafaille. 721
2012. Neuropilin 1 is expressed on thymus-derived natural regulatory T cells, but not 722
mucosa-generated induced Foxp3+ T reg cells. J Exp Med 209:1723-1742, S1721. 723
45. Thornton, A. M., P. E. Korty, D. Q. Tran, E. A. Wohlfert, P. E. Murray, Y. Belkaid, and E. 724
M. Shevach. Expression of Helios, an Ikaros transcription factor family member, 725
differentiates thymic-derived from peripherally induced Foxp3+ T regulatory cells. J 726
Immunol 184:3433-3441.
727
46. Singh, K., M. Hjort, L. Thorvaldson, and S. Sandler. Concomitant analysis of Helios and 728
Neuropilin-1 as a marker to detect thymic derived regulatory T cells in naive mice. Sci 729
Rep 5:7767.