HAL Id: hal-02995881
https://hal.archives-ouvertes.fr/hal-02995881
Submitted on 19 Nov 2020
HAL is a multi-disciplinary open access
archive for the deposit and dissemination of
sci-entific research documents, whether they are
pub-lished or not. The documents may come from
teaching and research institutions in France or
abroad, or from public or private research centers.
L’archive ouverte pluridisciplinaire HAL, est
destinée au dépôt et à la diffusion de documents
scientifiques de niveau recherche, publiés ou non,
émanant des établissements d’enseignement et de
recherche français ou étrangers, des laboratoires
publics ou privés.
Distributed under a Creative Commons Attribution - NonCommercial| 4.0 International
License
mortality: EPIC cohort study in 10 European countries
Mélanie Deschasaux, Inge Huybrechts, Chantal Julia, Serge Hercberg, Manon
Egnell, Bernard Srour, Emmanuelle Kesse-Guyot, Paule Latino-Martel, Carine
Biessy, Corinne Casagrande, et al.
To cite this version:
Mélanie Deschasaux, Inge Huybrechts, Chantal Julia, Serge Hercberg, Manon Egnell, et al..
Associ-ation between nutritional profiles of foods underlying Nutri-Score front-of-pack labels and mortality:
EPIC cohort study in 10 European countries. BMJ - British Medical Journal, BMJ, 2020, pp.m3173.
�10.1136/bmj.m3173�. �hal-02995881�
Association between nutritional profiles of foods underlying
Nutri-Score front-of-pack labels and mortality: EPIC cohort study
in 10 European countries
Mélanie Deschasaux,
1,2Inge Huybrechts,
2,3Chantal Julia,
1,4Serge Hercberg,
1,2,4Manon Egnell,
1Bernard Srour,
1,2Emmanuelle Kesse-Guyot,
1,2Paule Latino-Martel,
1,2Carine Biessy,
3Corinne Casagrande,
3Neil Murphy,
2,3Mazda Jenab,
2,3Heather A Ward,
5Elisabete Weiderpass,
3Kim Overvad,
7Anne Tjønneland,
8,9Agnetha Linn Rostgaard-Hansen,
9Marie-Christine Boutron-Ruault,
10,11Francesca Romana Mancini,
10,11Yahya Mahamat-Saleh,
10,11Tilman Kühn,
12Verena Katzke,
12Manuela M Bergmann,
13,14Matthias B Schulze,
13,14Antonia Trichopoulou,
15Anna Karakatsani,
15,16Eleni Peppa,
15Giovanna Masala,
17Claudia Agnoli,
18Maria Santucci De Magistris,
19Rosario Tumino,
20Carlotta Sacerdote,
21Jolanda MA Boer,
22WM Monique Verschuren,
22,23Yvonne T van der Schouw,
23Guri Skeie,
6Tonje Braaten,
6M Luisa Redondo,
24Antonio Agudo,
25Dafina Petrova,
26,27,28Sandra M Colorado-Yohar,
28,29,30Aurelio Barricarte,
28,31,32Pilar Amiano,
28,33Emily Sonestedt,
34Ulrika Ericson,
34Julia Otten,
35Björn Sundström,
35Nicholas J Wareham,
36Nita G Forouhi,
36Paolo Vineis,
37Konstantinos K Tsilidis,
38,39Anika Knuppel,
40Keren Papier,
40Pietro Ferrari,
2,3Elio Riboli,
5Marc J Gunter,
2,3Mathilde Touvier
1,2AbstrAct
Objective
To determine if the Food Standards Agency nutrient profiling system (FSAm-NPS), which grades the nutritional quality of food products and is used to derive the Nutri-Score front-of-packet label to
guide consumers towards healthier food choices, is associated with mortality.
Design
Population based cohort study.
setting
European Prospective Investigation into Cancer and Nutrition (EPIC) cohort from 23 centres in 10 European countries.
ParticiPants
521 324 adults; at recruitment, country specific and validated dietary questionnaires were used to assess their usual dietary intakes. A FSAm-NPS score was calculated for each food item per 100 g content of energy, sugars, saturated fatty acids, sodium, fibre, and protein, and of fruit, vegetables, legumes, and nuts. The FSAm-NPS dietary index was calculated for each participant as an energy weighted mean of the FSAm-NPS score of all foods consumed. The higher the score the lower the overall nutritional quality of the diet.
Main OutcOMe Measure
Associations between the FSAm-NPS dietary index score and mortality, assessed using multivariable adjusted Cox proportional hazards regression models.
results
After exclusions, 501 594 adults (median follow-up 17.2 years, 8 162 730 person years) were included in the analyses. Those with a higher FSAm-NPS dietary index score (highest versus lowest fifth) showed an increased risk of all cause mortality (n=53 112 events from non-external causes; hazard ratio 1.07, 95% confidence interval 1.03 to 1.10, P<0.001 for trend) and mortality from cancer (1.08, 1.03 to 1.13, P<0.001 for trend) and diseases of the circulatory (1.04, 0.98 to 1.11, P=0.06 for trend), respiratory (1.39, 1.22 to 1.59, P<0.001), and digestive (1.22,
For numbered affiliations see end of the article.
Correspondence to: M Deschasaux
m.deschasaux@eren.smbh.univ-paris13.fr
(ORCID 0000-0002-3359-420X)
Additional material is published online only. To view please visit the journal online.
cite this as: BMJ2020;370:m3173
http://dx.doi.org/10.1136/bmj.m3173 Accepted: 3 August 2020
WhAt is AlreAdy knoWn on this topic
Helping consumers make healthier food choices is a major challenge for the prevention of non-communicable diseases and related deaths
The Food Standards Agency nutrient profiling system (FSAm-NPS), which grades the nutritional quality of food products based on 100 g content of energy, sugars, saturated fatty acids, sodium, fibre and protein, and of fruit, vegetables, legumes, and nuts, underlies the Nutri-Score
Nutri-Score is a simple nutrition label selected by several countries in Europe and considered at the European Union level as a candidate for enabling uniform food labelling systems
FSAm-NPS defined nutritional quality of foods has been studied in relation to health but not to mortality in French cohorts, and recently to cancer risk in the large multinational European Prospective Investigation into Cancer and Nutrition (EPIC) cohort; evidence in an international setting for other health outcomes and especially mortality is still needed
WhAt this study Adds
This study used data from EPIC, a large cohort comprising 501 594 adults from 10 European countries (53 112 deaths), with diverse profiles and dietary patterns and showed that the consumption of foods with higher FSAm-NPS scores (lower nutritional quality) was associated with increased all cause and cause specific mortality
These results add support to the relevance of using the FSAm-NPS (and the derived Nutri-Score) to characterise healthier food choices as a basis for public health nutritional policies in Europe
This is important considering ongoing and future debates at the EU level on making food labelling systems uniform on the front of food product packaging
on 19 November 2020 by guest. Protected by copyright.
http://www.bmj.com/
1.02 to 1.45, P=0.03 for trend) systems. The age standardised absolute rates for all cause mortality per 10 000 persons over 10 years were 760 (men=1237; women=563) for those in the highest fifth of the FSAm-NPS dietary index score and 661 (men=1008; women=518) for those in the lowest fifth.
cOnclusiOns
In this large multinational European cohort,
consuming foods with a higher FSAm-NPS score (lower nutritional quality) was associated with a higher mortality for all causes and for cancer and diseases of the circulatory, respiratory, and digestive systems, supporting the relevance of FSAm-NPS to characterise healthier food choices in the context of public health policies (eg, the Nutri-Score) for European populations. This is important considering ongoing discussions about the potential implementation of a unique nutrition labelling system at the European Union level.
introduction
Poor nutrition is a major well known risk factor for non-communicable diseases, with an estimated 11 million deaths from such diseases attributed to unhealthy diets worldwide in 2017.1 Although it is well
established that less sugars, saturated fats, salt, and energy and more dietary fibres or fruit and vegetables should be consumed for better health, putting these recommendations into practice remains an important challenge. Helping consumers make healthier food choices could therefore serve as one of the key strategies to prevent mortality from non-communicable diseases. A front-of-pack label providing user friendly information on the nutritional quality of food products has been identified as a possible solution to this problem.2 3 Such labels have the potential to
help consumers choose food products with a better nutritional quality at the point of purchase, and, simultaneously, to incentivise food manufacturers to improve the nutritional quality of products, thus contributing to a healthier food environment.4 5 The
Nutri-Score labelling system, which uses five colours,6 is
considered promising in a broad international context. Nutri-Score classifies food products into five categories according to nutritional quality (from category A, indicating higher nutritional quality, to category E, indicating lower nutritional quality) assessed using the Food Standards Agency nutrient profiling system (FSAm-NPS), an adapted version of a nutrient profiling system (FSA-NPS) initially developed by the British Food Standards Agency.7-9 This scoring system was
developed to prevent a large range of nutrition related non-communicable diseases, by allocating a score to a given food or beverage per 100 g content of energy, saturated fatty acids, sugars, sodium, dietary fibre, and protein, and of fruit, vegetables, legumes, and nuts.
In 2017, public health authorities in France officially adopted Nutri-Score10 11 after a series of studies
showed the validity, scientific relevance, and potential public health benefits of the FSAm-NPS12-14 and of the
Nutri-Score label as a tool for public health nutrition
policies15-23 (reviewed in24). Subsequently, Belgium,
Spain, Germany, the Netherlands, Switzerland, and Luxembourg adopted Nutri-Score. Medical professionals and academic societies in Europe have also recognised the importance and potential public health impact of Nutri-Score as a tool that can be recommended to the general public and patients to guide them towards food choices of higher nutritional quality.
Under current European Union labelling regulations, member states cannot legally enforce the inclusion of a front-of-pack nutrition label such as Nutri-Score, which leaves the choice to food manufacturers. The stakes are therefore high for standardised nutritional labelling systems at the EU level, using a unique mandatory front-of-pack nutrition label. Similar discussions are ongoing in America and Australia. Since most of the original studies assessing the validity of the FSAm-NPS underlying Nutri-Score were performed in France,24-27
it is important that the validity of the model is exten-ded to international settings28 to provide relevant
scientific evidence for ongoing discussions in the EU and beyond.
Part of the validity assessment of FSAm-NPS is to study the association between the nutritional quality of food products graded by the scoring system and health outcomes. Such studies, done in the French SU.VI.MAX and NutriNet-Santé cohorts, showed that on average consumption of more food products with lower FSAm-NPS scores (representing higher nutritional quality) was associated with more favourable outcomes for weight gain,29 asthma symptoms,27 metabolic syndrome,30
cardiovascular diseases,31 32 and cancer.33 34 Recently,
we showed that similar observations could be made for cancer risk in a large multinational European cohort, the European Prospective Investigation into Cancer and Nutrition (EPIC) study.35 In the current study we
investigated the association between the FSAm-NPS scores of food products consumed and mortality in this large and diverse European population.
Methods
study population: ePic cohort
This study was conducted within the framework of the EPIC cohort study (https://epic.iarc.fr/), which enrolled more than 500 000 volunteers (aged 25-70 years) from 23 centres in 10 European countries (Denmark, France, Germany, Greece, Italy, Netherlands, Norway, Spain, Sweden, and the United Kingdom) between 1992 and 2000. This cohort study investigates metabolic, dietary, lifestyle, and environmental factors associated with the development of cancer and other non-communicable diseases in Europe. All participants gave written informed consent. Details of the study design, recruitment, and data collection are published elsewhere.36-38
baseline data collection
Information on the participants was obtained during enrolment from questionnaires that covered sociodemographic characteristics, lifestyle factors,
on 19 November 2020 by guest. Protected by copyright.
http://www.bmj.com/
personal and family history of diseases, and, for women, menstrual and reproductive history. Anthropometric measurements, such as height and weight, were performed in all centres at baseline using standard procedures; except in France, the UK, and Norway, where self-reported data were collected. Updated data on weight during follow-up were obtained for a subsample of participants involved in the European Prospective Investigation into Cancer and Nutrition-Physical Activity, Nutrition, Alcohol, Cessation of Smoking, Eating Out of Home and Obesity (EPIC-PANACEA) study.39
Dietary intake assessment
To assess the usual dietary intakes of participants, we used country specific and validated dietary questionnaires at recruitment. Depending on the study centres, these questionnaires were either self-administered or interviewer self-administered semi-quantitative food frequency questionnaires, with an estimation of individual average portions or with the same standard portion assigned to all participants, or diet history questionnaires, some combining a food frequency questionnaire and seven day dietary records.38 The EPIC food composition database
comprises more than 10 000 food and beverage items reflecting the types of food consumed in each country.40
A subset of the EPIC cohort (random samples of 5-12% of participants from each EPIC centre) also completed one computer assisted 24 hour dietary recall (EPIC-SOFT computer program), as part of a calibration study.41
Fsam-nPs dietary index computation
The FSAm-NPS is a modified version of the original nutrient profiling system (FSA-NPS), with slight adaptations to the allocation of points for specific foods (beverages, cheese, and added fats) recommended by the French High Council for Public Health to ensure a proper discrimination of the nutritional quality of products within these groups and a high consistency of the FSAm-NPS score with nutritional recommendations.14 Details on how the FSAm-NPS
score is calculated are published elsewhere8 12 14 35
(also see supplementary methods).
For each food or beverage in the EPIC food composition database we calculated the FSAm-NPS score (food level score) based on its composition for each 100 g of content: we allocated A points (ie, nutrients that should be consumed in limited amounts) for total sugars (g), saturated fatty acids (g), sodium (mg), and energy (kJ) and C points (ie, nutrients or components that should be promoted) for dietary fibre (g) and protein (g) and for fruit, vegetables, legumes, and nuts (%). The percentage content of fruit, vegetables, legumes, and nuts was derived using standard recipes. A points (range 0-10 for each of the four items) and C points (range 0-5 for each of the three items) are allocated following specific grids for each item (see supplementary methods) and summed. To obtain the FSAm-NPS score the
sum of C points is then subtracted from the sum of A points (see supplementary methods). The FSAm-NPS score for each food or beverage is based on a unique discrete continuous scale ranging theoretically from −15 points (highest nutritional quality) to 40 points (lowest nutritional quality). Cut-offs are then applied to the FSAm-NPS score to derive the Nutri-Score. The supplementary methods provide examples of the FSAm-NPS score calculation, Nutri-Score cut-offs, and food products classified according to Nutri-Score.
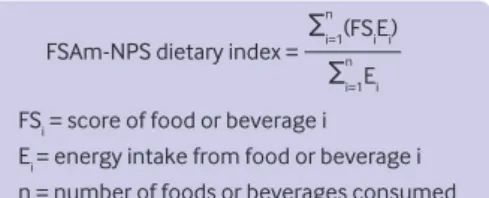
In a second step, we calculated a FSAm-NPS dietary index to characterise the nutritional quality of an individual’s diet. The FSAm-NPS dietary index (individual level score) was obtained as the sum of FSAm-NPS score for each food or beverage consumed, multiplied by the amount of energy provided by this product (energy content per 100 g multiplied by the estimated daily intake assessed using the baseline dietary questionnaires), divided by the total amount of energy intake (fig 1).42 A higher FSAm-NPS dietary
index score reflects an overall lower nutritional quality of foods consumed.
Follow-up for vital status
We obtained data on vital status and cause of death through linkage to mortality registries combined with data collected during follow-up of the cohort. The end of follow-up or closure dates of the study period varied between 2012 and 2015 depending on the country. The cause of death was coded using ICD-10 (international classification of diseases, 10th revision).43 In this
study, in addition to mortality from all causes we considered mortality due to specific causes: cancer (C00–D48), diseases of the circulatory system (I00– I99), diseases of the respiratory system (J00–J99), and diseases of the digestive system (K00–K93), and, as a negative control, mortality due to external causes (injury, poisoning, and other consequences of external causes: S00-T98, and external causes of morbidity and mortality: V01–Y98). Mortality from all non-external causes (main exposure) was defined as mortality from all causes except external causes of death.
statistical analyses
Of the 521 324 participants, we excluded those with missing lifestyle or dietary information (n=6902), along with those with an extreme ratio of energy intake to energy requirement (highest and lowest centiles, n=10 241), participants with no follow-up (n=2516), and those with missing date of death (n=71). A total of 54 951 deaths were recorded during follow-up, 1839 of which were due to external causes (see flowchart in supplementary figure 1).
We calculated age standardised absolute rates as the number of cases per 10 000 persons over 10 years in the highest and lowest fifths of the FSAm-NPS dietary index.
We considered the FSAm-NPS dietary index as a continuous variable (increment of 1 standard deviation—ie, 2.1 points of score) and as sex specific fifths. Tests for linear trends were performed assigning
on 19 November 2020 by guest. Protected by copyright.
http://www.bmj.com/
the median for each fifth of FSAm-NPS dietary index. Restricted cubic spline modelling was used to explore non-linear associations. Cox proportional hazards regression models were computed to analyse the associations between the FSAm-NPS dietary index score and all cause and cause specific mortality. Examination of the Schoenfeld residuals confirmed that the assumptions of proportionality were satisfied (see supplementary figure 2). Participants contributed person time to the model until date of death, date of emigration or loss to up, or end of follow-up, whichever occurred first. For analyses of cause specific mortality, participants who died from another cause than the one under study were included and censored at the date of the competing death event. Similarly, for analyses on mortality from all non-external causes, we included participants who died from external causes in the model and censored them at date of death. Competing risks were also tested using Fine and Gray models.44 Hazard ratios
and corresponding 95% confidence intervals were derived from multivariable Cox regression models using age as the underlying time variable. Models were stratified (using Cox model stratums) by age at recruitment (one year intervals) and study centre,36
to take into account a possible heterogeneity between study centres (and therefore countries). The main model accounted for all major potential confounders available through an adjustment for several covariates: sociodemographic characteristics (sex, educational level—longer education, including university degree, technical or professional school, secondary school, primary school), lifestyle (combined total physical activity—sex specific categories: active, moderately active, moderately inactive, inactive), smoking status and intensity (current, 1-15 cigarettes daily, 16-25 cigarettes daily, ≥26 cigarettes daily, and pipe, cigar, or occasional; current or former, missing; former, quit for ≤10 years, quit for 11-19 years, quit for ≥20 years; non-smoker), alcohol and energy intakes at baseline, anthropometric characteristics (body mass index (BMI), height), and prevalent disease (history of cancer, cardiovascular diseases, and diabetes).
Missing data on covariates (physical activity: n=34 400 (6.9%); smoking status and intensity: n=8527 (1.7%); educational level: n=18 383 (3.7%); history of cardiovascular diseases: n=78 400 (15.6%), history of diabetes: n=39 892 (7.9%); BMI: n=91 412 (18.2%); height: n=90 258 (18%)) were handled using multiple imputation by chained equations
(MICE method45) by fully conditional specification (10
imputed datasets). We also conducted a complete case approach (ie, excluding participants with missing data on covariates).
We considered BMI as a confounding factor in the analyses and therefore it was adjusted for in the multivariable models. As BMI could also be considered as an intermediate mediating factor, however, we performed sensitivity analyses without adjustment for BMI, and analyses of mediation through variation in BMI were also implemented using a method proposed previously.46
To test the robustness of the associations, we carried out several sensitivity analyses: we removed energy intake from the models (assessing a potential collider bias), we included coffee and soft drink intakes in the models (assessing if these two dietary factors recently found to be strongly associated with mortality in EPIC47 48 would entirely explain the associations), we
excluded from the analyses participants with a history of cancer, cardiovascular diseases, and diabetes (assessing a potential bias from modified dietary behaviours after these major health events, such as indications to follow a healthier diet), and we excluded from the analyses those participants who died during the first five years of follow-up (allowing a longer delay between baseline dietary assessment and mortality event). To assess the potential for residual confounding we also carried out subgroup analyses according to major potential confounders (sex, BMI, physical activity, educational level, smoking status, alcohol intake, energy intake). Potential residual confounding from unmeasured confounders was assessed using E values.49 50
All tests were two sided and we considered P<0.05 to be statistically significant. SAS version 9.4 (SAS Institute) and R version 3.6.2 were used for the analyses.
Patient and public involvement
The research question developed in this article corresponds to concerns of the participants involved in the EPIC cohort, and of the public in general. The results of the present study will be disseminated through institutional websites and the media.
results
A total of 501 594 adults (70.8% women, median age 51.6 years) were included in this study (see supplementary figure 1). After a median follow-up of 17.2 years (8 162 730 person years), 54 951 deaths occurred, 23 143 of which were from cancer, 13 246 from diseases of the circulatory system, 2857 from diseases of the respiratory system, 1561 from diseases of the digestive system, and 1839 from external causes.
Table 1 shows the baseline characteristics of the participants overall and according to sex specific fifths of the FSAm-NPS dietary index. This index reflects the overall nutritional quality of an individual’s diet based on the intrinsic nutritional quality of each food consumed, regardless of cultural context. Owing
FSAm-NPS dietary index =
Σ
i=1(FSiEi) FSi = score of food or beverage i Ei = energy intake from food or beverage i n = number of foods or beverages consumedn
Σ
i=1Ei nFig 1 | equation to calculate the Food standards agency nutrient profiling system (Fsam-nPs) dietary index
on 19 November 2020 by guest. Protected by copyright.
http://www.bmj.com/
table 1 | baseline characteristics of study participants from european Prospective investigation into cancer and nutrition (ePic) cohort overall and by sex specific fifths of Food standards agency nutrient profiling system (Fsam-nPs) dietary index score. values are numbers (percentages) unless stated otherwise
characteristics all (n=501 594)*
Fifths of Fsam-nPs dietary index score† First (highest
nutritional quality)
(n=100 318)‡ second (n=100 319) third (n=100 319) Fourth (n=100 319)
Fifth (lowest nutritional quality (n=100 319) Median (interquartile range)
FSAm-NPS dietary index score 5.95 (4.53-7.39) 3.29 (2.52-3.79) 4.84 (4.53-5.13) 5.95 (5.67-6.22) 7.07 (6.78-7.39) 8.66 (8.14-9.44)
Men 146 329 (29.2) 29 265 (20.0) 29 266 (20.0) 29 266 (20.0) 29 266 (20.0) 29 266 (20.0)
Women 355 265 (70.8) 71 053 (20.0) 71 053 (20.0) 71 053 (20.0) 71 053 (20.0) 71 053 (20.0)
Median (interquartile range)
age at recruitment (years) 51.6 (45.3-58.4) 52.1 (45.4-59.2) 51.5 (44.9-58.3) 51.5 (44.8-58.0) 51.6 (45.4-58.3) 51.5 (45.7-58.4) Country: France 72 980 (14.5) 2558 (3.51) 6812 (9.33) 13 135 (18.0) 21 795 (29.9) 28 680 (39.3) Italy 45 700 (9.11) 9734 (21.3) 13 945 (30.5) 11 143 (24.4) 7295 (16.0) 3583 (7.84) Spain 40 619 (8.10) 21 587 (53.1) 8708 (21.4) 5214 (12.8) 3098 (7.63) 2012 (4.95) UK 80 441 (16.0) 18 826 (23.4) 13 661 (17.0) 13 936 (17.3) 14 652 (18.2) 19 366 (24.1) Netherlands 38 195 (7.61) 3736 (9.78) 7725 (20.2) 10 108 (26.5) 9999 (26.2) 6627 (17.3) Greece 26 651 (5.31) 10 900 (40.9) 10 032 (37.6) 4263 (16.0) 1206 (4.53) 250 (0.94) Germany 52 010 (10.4) 4729 (9.09) 7718 (14.8) 11 107 (21.4) 13 735 (26.4) 14 721 (28.3) Sweden 52 741 (10.5) 8495 (16.1) 10 311 (19.5) 11 043 (20.9) 10 982 (20.8) 11 910 (22.6) Denmark 55 818 (11.1) 8503 (15.2) 10 461 (18.7) 12 297 (22.0) 13 171 (23.6) 11 386 (20.4) Norway 36 439 (7.26) 11 250 (30.9) 10 946 (30.0) 8073 (22.1) 4386 (12.0) 1784 (4.90)
Median (interquartile range)
body mass index§ 25.3 (22.8-28.2) 26.0 (23.3-29.1) 25.5 (23.1-28.5) 25.2 (22.8-28.0) 24.8 (22.5-27.6) 24.7 (22.2-27.5) Median (interquartile range)
height (cm)¶ 166 (160-173) 164 (158-170) 165 (159-172) 166 (160-173) 167 (161-174) 167 (161-174)
Educational level**:
None or primary school 149 580 (31.0) 40 566 (27.1) 33 650 (22.5) 27 778 (18.6) 23 976 (16.0) 23 610 (15.8) Technical, professional,
or secondary school 214 154 (44.3) 35 580 (16.6) 41 742 (19.5) 44 933 (21.0) 46 072 (21.5) 45 827 (21.4) Longer education
(including university degree) 119 477 (24.7) 20 301 (17.0) 21 935 (18.4) 24 473 (20.5) 26 653 (22.3) 26 115 (21.9) Physical activity††: Inactive 76 414 (15.2) 12 349 (16.2) 13 864 (18.1) 15 532 (20.3) 16 969 (22.2) 17 700 (23.2) Moderately inactive 159 880 (31.9) 26 205 (16.4) 27 882 (17.4) 30 765 (19.2) 35 200 (22.0) 39 828 (24.9) Moderately active 185 968 (37.1) 44 635 (24.0) 40 824 (22.0) 36 879 (19.8) 33 180 (17.8) 30 450 (16.4) Active 44 932 (8.96) 9819 (21.8) 9429 (21.0) 9178 (20.4) 8541 (19.0) 7965 (17.7) Smoking status‡‡: Non-smoker 244 929 (48.8) 51 476 (21.0) 48 552 (19.8) 47 992 (19.6) 48 625 (19.8) 48 284 (19.7) Former smoker 134 382 (26.8) 27 306 (20.3) 27 400 (20.4) 27 459 (20.4) 26 815 (19.9) 25 402 (18.9) Current smoker 111 938 (22.3) 19 756 (17.6) 22 405 (20.0) 22 851 (20.4) 22 817 (20.4) 24 109 (21.5)
Median (interquartile range)
alcohol intake (g/d) 5.29 (0.93-14.8) 2.86 (0.35-11.8) 4.56 (0.82-13.2) 5.56 (1.08-15.0) 6.64 (1.46-16.4) 6.81 (1.49-17.0) Median (interquartile range)
energy (kcal/d) 1992 (1628-2430) 1745 (1432-2144) 1899 (1568-2310) 1984 (1645-2393) 2092 (1736-2502) 2253 (1863-2703) Median (interquartile range)
total dietary fibre (g/d) 21.8 (17.4-27.0) 24.2 (19.3-30.4) 22.4 (18.1-27.5) 21.7 (17.4-26.6) 21.1 (16.9-25.9) 19.9 (15.7-24.5) Median (interquartile range)
vegetables (g/d) 175.4 (110.0-276.3) 218.6 (133.6-339.7) 183.2 (115.3-292.1) 166.2 (107.0-260.4) 160.6 (104.0-249.3) 157.2 (98.4-243.5) Median (interquartile range)
fruit, nuts, and seeds (g/d) 200.5 (111.7-321.6) 287.1 (173.5-434.6) 234.1 (132.1-354.5) 194.9 (111.6-308.1) 171.9 (98.8-273.2) 143.6 (80.1-234.0) Median (interquartile range)
dairy products (g/d) 278.1 (161.3-445.9) 269.8 (146.5-448.7) 284.5 (164.5-463.6) 294.9 (173.6-465.4) 284.1 (168.2-445.5) 258.3 (153.0-400.0) Median (interquartile range)
fish and shellfish (g/d) 28.0 (13.8-49.7) 32.9 (15.1-63.6) 28.6 (14.4-53.0) 27.3 (13.6-48.9) 26.5 (13.2-44.8) 25.5 (12.8-42.3) Median (interquartile range)
red meat (g/d) 34.5 (16.1-62.7) 26.1 (10.1-49.9) 34.2 (16.6-60.3) 37.3 (18.0-65.9) 40.1 (19.0-69.0) 36.6 (17.1-65.9) Median (interquartile range)
processed meat (g/d) 24.3 (10.6-43.9) 13.0 (3.22-27.4) 19.9 (7.74-36.5) 25.6 (12.5-44) 30.5 (16.1-50.9) 35.6 (18.5-59.9) History of cancer 24 155 (4.82) 4359 (18.0) 4456 (18.4) 4708 (19.5) 5204 (21.5) 5428 (22.5) History of cardiovascular diseases§§ 97 370 (19.4) 22 211 (22.8) 19 915 (20.4) 18 997 (19.5) 18 645 (19.2) 17 602 (18.1) History of diabetes¶¶ 13 311 (2.65) 5258 (39.5) 2853 (21.4) 2017 (15.1) 1692 (12.7) 1491 (11.2) *Column percentages.
†Cut-offs for sex specific fifths of FSAm-NPS dietary index were 4.14, 5.35, 6.43, and 7.68 for women and 4.32, 5.55, 6.63, and 7.88 for men. A higher score indicates a lower nutritional quality of foods consumed. ‡Row percentages. §Missing for 91 412 (18.2%). ¶Missing for 90 258 (18.0%). **Missing for 18 383 (3.7%). ††Missing for 34 400 (6.9%). ‡‡Missing for 10 345 (2.1%). §§Missing for 78 400 (15.6%). ¶¶Missing for 39 892 (7.9%).
on 19 November 2020 by guest. Protected by copyright.
http://www.bmj.com/
to the diverse dietary patterns of the 10 countries participating in the EPIC cohort, FSAm-NPS dietary index scores were lower, indicating diets of overall higher nutritional quality in Spain (median 4.06), Greece (4.49), Norway (4.92), and Italy (5.34), and higher in the UK (6.01), Sweden (6.19), the Netherlands (6.22), Denmark (6.25), Germany (6.73), and France (7.25).
Participants with higher FSAm-NPS dietary index scores were more likely to have less healthy dietary intakes (lower intakes of dietary fibres, fruit and vegetables, and fish and higher intakes of red and processed meat) and higher energy intakes. Nonetheless, a broad range of energy intakes was observed within each fifth. Participants with higher FSAm-NPS dietary index scores were also more likely to smoke, to be less physically active, and to have a higher alcohol intake and higher level of education, and a history of cancer. In contrast, a higher proportion of existing cardiovascular diseases or diabetes and a higher BMI was observed in participants with lower FSAm-NPS dietary index scores, which might reflect a change in diet required for management of disease in these participants.
Table 2 shows the associations between the FSAm-NPS dietary index and mortality. A higher score (lower nutritional quality diet) was associated with higher mortality overall (highest fifth versus lowest fifth: hazard ratio 1.06, 95% confidence interval 1.03 to 1.09, P<0.001 for trend, P<0.001 for non-trend). Mortality from external causes was not associated with the FSAm-NPS dietary index score (0.99, 0.84 to 1.16, P=0.9 for trend, P=0.9 for non-trend). Mortality from all non-external causes (all cause mortality) was positively associated with the FSAm-NPS dietary index (n=53 112 cases, 1.07, 1.03 to 1.10, P<0.001 for trend, P<0.001 for non-trend). Corresponding age standardised absolute rates for all cause mortality per 10 000 persons over 10 years were 760 (men=1237; women=563) in those with a high FSAm-NPS dietary index (low nutritional quality diet) and 661 (men=1008; women=518) in those with low scores (high nutritional quality diet).
Overall, results were consistent across all countries (see supplementary figure 3), with only borderline statistically significant associations (restricted sample size). Results for Norway might be related to the distribution of the FSAm-NPS dietary index scores in this country, with overall low scores and a resulting small contrast between individuals with higher and lower scores (median 4.92, interquartile range 3.87-5.98).
Cause specific analyses showed that a higher FSAm-NPS dietary index score (lower nutritional quality diet) was associated with higher mortality from cancer (highest fifth versus lowest fifth: hazard ratio 1.08, 1.03 to 1.13, P<0.001 for trend, P=0.003 for non-trend) and diseases of the circulatory (1.04, 0.98 to 1.11, P=0.06 for trend, P=0.02 for non-trend), respiratory (1.39, 1.22 to 1.59, P<0.001 for trend, P<0.001 for non-trend), and digestive systems (1.22, 1.02 to 1.45, P=0.03 for trend, P=0.19 for non-trend).
Some evidence of non-linearity was observed for all cause mortality and mortality from cancer and diseases of the circulatory system. Such non-linearity was mainly observed for low FSAm-NPS dietary index scores, whereas for higher scores the association had a linear shape (see supplementary figure 4). Similar results were observed across all sensitivity analyses (see supplementary table 1).
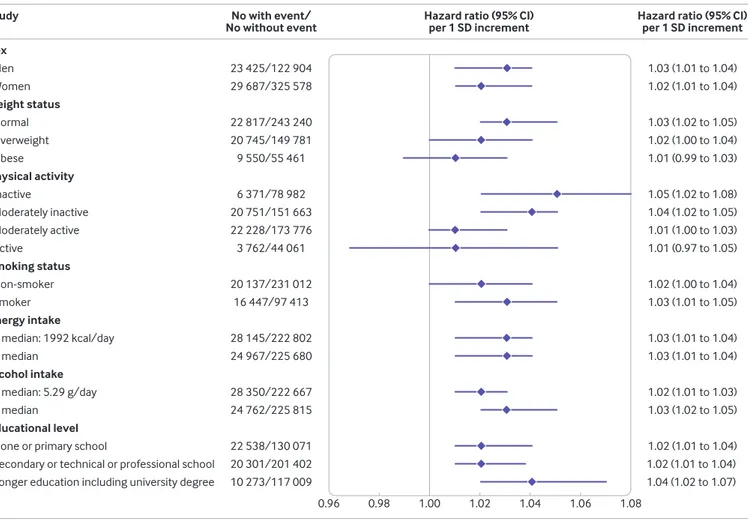
Overall, subgroup analyses showed the robustness of the results across categories of major potential confounders (fig 2): associations with all cause mortality were consistent across stratums for men and women, non-smokers and smokers, and according to energy or alcohol intakes and education levels (although strengthened in highly educated participants); associations were stronger in non-obese participants and in those who were less physically active.
Mediation analyses suggested a limited mediation effect from variation in BMI during follow-up in the association between FSAm-NPS dietary index score and mortality (see supplementary table 2). Removing BMI from the models did not change the results of the main models (see supplementary table 1).
Finally, E values suggested that residual confounding due to potential unmeasured confounding factors is likely to be moderate (see supplementary table 3).
discussion
This study was conducted in a large population from 10 European countries participating in the EPIC cohort to assess the relevance of the FSAm-NPS dietary index score (high values representing low nutritional quality of food products) to characterise healthier food choices in a European context. We found that a higher consumption of food products with higher FSAm-NPS scores (ie, higher FSAm-NPS dietary index scores at the individual level) was positively associated with mortality from all causes and from cancer and diseases of the circulatory, respiratory, and digestive systems.
comparison with other studies
This work builds on previous analyses conducted on cancer incidence in the EPIC cohort35 to investigate the
association between the FSAm-NPS dietary index and health outcomes in a large European population, and it complements the analyses conducted in the French SU.VI.MAX and NutriNet-Santé cohorts.27 29-34 These
studies consistently reported poorer health outcomes (weight gain,29 metabolic syndrome,30 cancer,33-35
cardiovascular diseases,31 32 asthma symptoms27)
associated with higher FSAm-NPS dietary index scores. Previous studies in the UK have also investigated the association between the FSA-NPS score (the original score before modifications were made and it was renamed FSAm-NPS) and mortality, applying to the FSA-NPS a cut-off to categorise food products as healthier or as less healthy (Ofcom threshold used for advertising regulation9). The results of these studies
were consistent with ours, showing a lower all cause and cancer related mortality associated with intake of
on 19 November 2020 by guest. Protected by copyright.
http://www.bmj.com/
a wide variety of healthier food items in the Whitehall II cohort51 and a higher all cause mortality associated
with a higher consumption of less healthy food items in EPIC-Norfolk (highest versus lowest fifth: hazard ratio 1.11, 95% confidence interval 1.02 to 1.20).52
In both studies no association was observed with mortality from cardiovascular diseases, whereas in our study we found a borderline statistically significant association. This might be related to the larger sample size in our study or to a better ranking of participants using the continuous FSAm-NPS, which allows for a
more refined discrimination of the nutritional quality of food products likely resulting in a better ranking of participants according to the overall nutritional quality of their diets.
The approach used in our study, in which a dietary index at the individual level is derived from the nutrient profile of the foods consumed and is studied in relation to health outcomes, was also implemented with different nutrient profiling systems in two other studies. In the Nurses’ Health Study and the Health Professionals Follow-up Study, the Overall Nutritional
table 2 | associations between fifths of Food standards agency nutrient profiling system (Fsam-nPs) dietary index score and all cause and cause specific mortality, from multivariable cox proportional hazards regression models, in participants of european Prospective investigation into cancer and nutrition (ePic) cohort, 1992-2015. values are hazard ratios (95% confidence intervals) unless stated otherwise
Mortality continuous (per 1 sD increment) P value Fifths* P for non-trend First (highest
nutritional quality) second third Fourth Fifth (lowest nutritional quality) P for trend all causes
No/person years 54 951/8 162 730 10 887/1 605 206 9934/1 585 846 10 275/1 626 056 11 098/1 662 098 12 757/1 683 523 Sex adjusted
model† 1.04 (1.03 to 1.05) <0.001 0.97 (0.94 to 1.00) 0.98 (0.95 to 1.01) 1.01 (0.98 to 1.04) 1.10 (1.07 to 1.14) <0.001 <0.001 Main model‡ 1.02 (1.01 to 1.03) <0.001 1.00 (ref) 0.98 (0.96 to 1.01) 0.99 (0.96 to 1.02) 1.01 (0.98 to 1.04) 1.06 (1.03 to 1.09) <0.001 <0.001 cause specific Non-external: No/person years 53 112/8 162 730 10 515/1 605 206 9605/1 585 846 9922/1 626 056 10 728/1 662 098 12 342/1 683 523 Sex adjusted model 1.04 (1.03 to 1.05) <0.001 1.00 (ref) 0.97 (0.94 to 1.00) 0.98 (0.95 to 1.01) 1.01 (0.98 to 1.04) 1.10 (1.07 to 1.14) <0.001 <0.001 Main model 1.03 (1.02 to 1.04) <0.001 1.00 (ref) 0.99 (0.96 to 1.02) 0.99 (0.96 to 1.02) 1.01 (0.98 to 1.04) 1.07 (1.03 to 1.1) <0.001 <0.001 External:
No/person
years 1839/7 783 132 372/1 568 430 329/1 538 426 353/1 556 361 370/1 562 787 415/1 557 129
Sex adjusted
model 1.03 (0.98 to 1.09) 0.23 0.95 (0.81 to 1.10) 1.00 (0.86 to 1.17) 1.00 (0.86 to 1.17) 1.08 (0.92 to 1.27) 0.21 0.54 Main model 1.00 (0.95 to 1.05) 0.93 1.00 (ref) 0.94 (0.81 to 1.1) 0.98 (0.84 to 1.15) 0.96 (0.82 to 1.13) 0.99 (0.84 to 1.16) 0.98 0.93 Cancer:
No/person
years 23 143/7 783 132 4550/1 568 430 4288/1 538 426 4482/1 556 361 4700/1 562 787 5123/1 557 129 Sex adjusted
model 1.06 (1.04 to 1.07) <0.001 1.00 (ref) 1.00 (0.96 to 1.04) 1.04 (0.99 to 1.08) 1.07 (1.03 to 1.12) 1.16 (1.11 to 1.21) <0.001 <0.001 Main model 1.03 (1.01 to 1.04) <0.001 1.00 (ref) 0.99 (0.95 to 1.04) 1.02 (0.98 to 1.07) 1.03 (0.99 to 1.08) 1.08 (1.03 to 1.13) <0.001 0.003 Circulatory diseases: No/person years 13 246/7 783 132 2973/1 568 430 2432/1 538 426 2377/1 556 361 2526/1 562 787 2938/1 557 129 Sex adjusted model 1.02 (1.00 to 1.04) 0.04 1.00 (ref) 0.91 (0.86 to 0.96) 0.92 (0.87 to 0.97) 0.95 (0.90 to 1.01) 1.03 (0.97 to 1.09) 0.11 <0.001 Main model 1.02 (1.00 to 1.04) 0.03 1.00 (ref) 0.96 (0.91 to 1.01) 0.96 (0.91 to 1.02) 1.00 (0.94 to 1.06) 1.04 (0.98 to 1.11) 0.06 0.02 Respiratory diseases: No/person years 2857/7 783 132 508/1 568 430 501/1 538 426 507/1 556 361 591/1 562 787 750/1 557 129 Sex adjusted model 1.16 (1.12 to 1.21) <0.001 1.00 (ref) 1.12 (0.98 to 1.27) 1.15 (1.01 to 1.31) 1.30 (1.14 to 1.47) 1.56 (1.37 to 1.76) <0.001 <0.001 Main model 1.11 (1.06 to 1.15) <0.001 1.00 (ref) 1.15 (1.01 to 1.31) 1.16 (1.01 to 1.32) 1.27 (1.11 to 1.45) 1.39 (1.22 to 1.59) <0.001 <0.001 Digestive diseases: No/person years 1561/7 783 132 294/1 568 430 286/1 538 426 282/1 556 361 326/1 562 787 373/1 557 129 Sex adjusted model 1.09 (1.03 to 1.15) 0.002 1.00 (ref) 1.06 (0.89 to 1.25) 1.03 (0.87 to 1.22) 1.15 (0.97 to 1.36) 1.25 (1.06 to 1.48) 0.005 0.05 Main model 1.08 (1.02 to 1.14) 0.01 1.00 (ref) 1.08 (0.91 to 1.28) 1.05 (0.88 to 1.25) 1.15 (0.97 to 1.37) 1.22 (1.02 to 1.45) 0.03 0.19 *Cut-offs for sex specific fifths of the FSAm-NPS dietary index were 4.14, 5.35, 6.43, and 7.68 for women and 4.32, 5.55, 6.63, and 7.88 for men. A higher score indicates a lower nutritional quality of foods consumed.
†Sex adjusted model was stratified for age (one year interval) and study centre and adjusted for age (time scale) and sex.
‡The main model was stratified for age (one year interval) and study centre and adjusted for age (time scale) sex, body mass index, height, educational level (longer education, including university degree, technical or professional school, secondary school, primary school, missing), combined total physical activity (sex specific categories: active, moderately active, moderately inactive, inactive, missing), smoking status and intensity of smoking (current, 1-15 cigarettes daily; 16-25 cigarettes daily; ≥26 cigarettes daily; pipe, cigar, occasional; current or former, missing; former, quit 11-19 years, quit ≥20 years, quit ≤10 years; non-smoker; missing), baseline alcohol intake, baseline energy intake, and history of cancer (yes, no), cardiovascular diseases (yes, no, missing) and diabetes (yes, no, missing).
on 19 November 2020 by guest. Protected by copyright.
http://www.bmj.com/
Quality Index translated into the ONQI-f score at the individual level was associated with lower mortality.53
In the Rotterdam Study, the Nutrient-Rich Food 9.3 score at the individual level was inversely associated with all cause mortality but not with mortality from cardiovascular diseases.54 These scores nonetheless
differ by the number and types of nutritional items considered. The FSAm-NPS was designed to be easily computable by industrial and public stakeholders in a transparent manner to serve as a basis for tools of public health nutritional policies (such as the Nutri-Score label). Hence the FSAm-NPS consists of a unique scale applicable to all food products (raw or manufactured) and to all countries (as was done in the present study) and intentionally focuses on seven items only (energy, saturated fatty acids, sodium, sugars, dietary fibre, and protein, and fruit, vegetables, legumes, and nuts). These items are generally found in the nutritional
information on food labels and were selected based on an association with non-communicable diseases or because they reflect the nutritional value of foods, in line with dietary guidelines.8 42 In contrast, the
Overall Nutritional Quality Index is based on 30 items and the Nutrient-Rich Food 9.3 is based on 12 items, both including not only macronutrients, vitamins, and minerals but also polyphenols (Overall Nutritional Quality Index) and reference values of intake (Nutrient-Rich Food 9.3) that might differ across countries.
The FSAm-NPS is also consistent with recent reports from the Global Burden of Disease Study and the EAT-Lancet Commission, both of which estimated that about 11 million deaths worldwide could be prevented with healthier diets, including, notably, less sodium, sugars, and saturated fats and more dietary fibre and whole grains, fruit, vegetables, legumes, and nuts.1 55
Our results showed a strong association of the
FSAm-Sex Men Women Weight status Normal Overweight Obese Physical activity Inactive Moderately inactive Moderately active Active Smoking status Non-smoker Smoker Energy intake < median: 1992 kcal/day ≥ median Alcohol intake < median: 5.29 g/day ≥ median Educational level None or primary school
Secondary or technical or professional school Longer education including university degree
23 425/122 904 29 687/325 578 22 817/243 240 20 745/149 781 9 550/55 461 6 371/78 982 20 751/151 663 22 228/173 776 3 762/44 061 20 137/231 012 16 447/97 413 28 145/222 802 24 967/225 680 28 350/222 667 24 762/225 815 22 538/130 071 20 301/201 402 10 273/117 009 1.03 (1.01 to 1.04) 1.02 (1.01 to 1.04) 1.03 (1.02 to 1.05) 1.02 (1.00 to 1.04) 1.01 (0.99 to 1.03) 1.05 (1.02 to 1.08) 1.04 (1.02 to 1.05) 1.01 (1.00 to 1.03) 1.01 (0.97 to 1.05) 1.02 (1.00 to 1.04) 1.03 (1.01 to 1.05) 1.03 (1.01 to 1.04) 1.03 (1.01 to 1.04) 1.02 (1.01 to 1.03) 1.03 (1.02 to 1.05) 1.02 (1.01 to 1.04) 1.02 (1.01 to 1.04) 1.04 (1.02 to 1.07) 0.96 0.98 1.00 1.02 1.04 1.06 1.08
Study Hazard ratio (95% CI)
per 1 SD increment No with event/
No without event Hazard ratio (95% CI)per 1 SD increment
Fig 2 | associations between Food standards agency nutrient profiling system (Fsam-nPs) dietary index score and all cause mortality, subgroup analyses from multivariable cox proportional hazards regression models in the european Prospective investigation into cancer and nutrition (ePic) cohort, 1992-2015. a higher score indicates a lower nutritional quality of consumed foods. the main model was stratified for age (one year interval) and study centre and adjusted for sex, body mass index, height, educational level (longer education, including university degree, technical or professional school, secondary school, primary school, missing), combined total physical activity (sex specific categories: active, moderately active, moderately inactive, inactive, missing), smoking status and intensity of smoking (current, 1-15 cigarettes daily, 16-25 cigarettes daily, ≥26 cigarettes daily, pipe, cigar, or occasional; current or former, missing; former, quit ≤10 years, quit 11-19 years, quit ≥20 years; non-smoker; missing), baseline alcohol intake, baseline energy intake, and history of cancer (yes, no), cardiovascular diseases (yes, no, missing), and diabetes (yes, no, missing). P for interaction, obtained for each subgroup analysis from the likelihood ratio test of models with and without the interaction term, were: sex, P=0.04; weight status, P=0.22; physical activity, P=0.23; smoking status, P<0.001; energy intake, P=0.05; alcohol intake, P=0.07; educational level, P=0.27
on 19 November 2020 by guest. Protected by copyright.
http://www.bmj.com/
NPS dietary index score with mortality from respiratory diseases. Beyond the well established impact of nutrition on cancer and cardiometabolic risks,1
mounting evidence also supports a substantial impact of nutrition on respiratory health through several pathways involving oxidative stress and inflammation, epigenetics, and the gut microbiome. Notably, dietary fibres (involved in anti-inflammatory responses) and fruit and vegetables (sources of antioxidants), as part of a healthy diet, have been suggested to play a beneficial role in respiratory health, whereas components such as saturated fats and red or processed meat (involved in pro- inflammatory responses), or, more generally, a Western diet, would have detrimental effects.56-61
The FSAm-NPS dietary index score has also been associated with asthma symptoms in the NutriNet-Santé cohort study.27 Similar strong associations with
mortality from respiratory diseases (compared with mortality from other causes) have been observed in previous studies of saturated fatty acid62 or vegetables
and red meat intakes.63 These results are consistent
with the items in the FSAm-NPS dietary index.
non-linearity and associations between Fsam-nPs dietary index and bMi
In our study, evidence of non-linearity was observed for associations with all cause mortality and mortality from cancer and diseases of the circulatory system at low values of FSAm-NPS dietary index scores. Such values reflect healthy food choices that might have been adopted by individuals with a greater risk of disease (and thus high underlying risks of mortality). Hence, individuals consuming diets of the highest nutritional quality (lowest FSAm-NPS dietary index scores) would be the ones with higher mortality rates, thus blurring the association overall. Evidence of this can be seen in table 1 where participants in the lowest fifth of the FSAm-NPS dietary index have a higher baseline BMI (cross sectional analyses) and were more likely to have prevalent cardiovascular disease or prevalent diabetes at baseline (probably partly related to their past diet). This might also help to explain why weaker (although statistically significant) associations were observed for mortality from circulatory diseases or why we observed stronger results in non-obese participants at baseline, because mechanisms leading to premature death have to some extent already played out for obese individuals. Finally, our analyses showed little mediation effect of variation in BMI in the association between the FSAm-NPS dietary index score and mortality. This suggests that the overall nutritional quality of a diet might have an impact on mortality beyond weight gain.
associations between Fsam-nPs dietary index and educational level
The positive cross sectional association between the FSAm-NPS dietary index score and educational level might seem counterintuitive but has also been observed in studies conducted in the independent SU.VI.MAX and NutriNet-Santé cohorts.42 64 Several
hypotheses can explain this finding. In EPIC, countries
with a higher proportion of participants with lower mean educational level (eg, Greece, Spain, Italy) also had the lowest FSAm-NPS dietary index scores (reflecting trends towards a Mediterranean or healthier diet in countries of southern Europe65 66). At least in
these countries, people with lower education might be more likely to consume traditional diets that could include food of better nutritional quality. This trend could also be related to an age or generation effect. Younger people tend to have a higher educational level but also to have a higher consumption of “junk food,” leading to higher FSAm-NPS dietary index scores (diets of lower nutritional quality). Associations were statistically significant for all categories of educational level but slightly strengthened in highly educated participants. The latter finding might be related to more contrasted FSAm-NPS dietary index scores in the category of participants with longer education. Another hypothesis is that participants with longer education might be less exposed to risk factors linked to occupation or environment than those of a lower socioeconomic position.
strengths and limitations of this study
Strengths of our study pertain to its prospective design and long follow-up of many participants from different European countries with various phenotypes, and for whom collected data have been standardised. This provided an opportunity to study the nutritional quality of food choices in relation to mortality in a broad European context of diverse dietary patterns. Additionally, a large array of lifestyle data was available which allowed adjustment for major potential confounding factors in our main model and the performance of in-depth sensitivity analyses.
Our study also has some limitations. Firstly, owing to the observational design, potential residual confounding or unmeasured confounding (from genetic or environmental factors that could not be taken into account) cannot be ruled out. In addition, as we collected data using questionnaires, we cannot exclude misclassification bias from imprecise dietary data and covariates. Because data were collected before the studied outcome (prospective design), any misclassification resulting from measurement errors is likely to have been non-differential—that is, independent of death status. Nonetheless, this might have resulted in biased estimates of effect (underestimation or overestimation).67 68 In particular,
the tools used to estimate an individual’s usual diet are subject to imprecision and inaccuracy (such as misreporting bias, inherent in assessments of usual dietary intakes) and therefore could have resulted in some misclassification of the nutritional quality of foods consumed by participants. Indeed, most EPIC centres used a food frequency questionnaire to assess dietary intakes, which, despite allowing for a good estimation of usual dietary intakes, still limits discrimination between the nutritional quality of individual food products (compared with, for example, repeated 24 hour dietary records, as used
on 19 November 2020 by guest. Protected by copyright.
http://www.bmj.com/
in the SU.VI.MAX and NutriNet-Santé cohorts, where larger effect estimates were observed for associations between FSAm-NPS dietary index scores and health outcomes31-34 61). In the subsample from the EPIC
calibration study (n=34 367), good concordance was shown between the FSAm-NPS dietary index score calculated from the dietary questionnaires (mainly food frequency questionnaires) and the calibrated 24 hour dietary recall (68% of participants were classified in either the same or the adjacent fifth, only 3% were classified in extreme opposite fifths, data not tabulated). However, only one day of 24 hour recall was available for participants in the calibration study. Therefore, although the dietary questionnaires available for the whole EPIC cohort might have some limitations about the level of detail available for each food item, the questionnaires still provide a better overview of the usual diet of participants compared with the single 24 hour recall. In addition, we only assessed dietary intakes at baseline. Although changes in food consumption might have occurred during follow-up, it is hypothesised that the baseline estimation usually reflects general eating behaviour throughout middle age.69 Also, EPIC participants were volunteers
involved in a long term cohort study investigating the association between nutrition and health and likely had more health conscious behaviours and less unhealthy dietary behaviours than the general population. This might have resulted in weaker observed associations (hence a smaller effect size) owing to smaller differences between high and low FSAm-NPS dietary index scores. Additionally, EPIC participants were recruited from 10 countries in western Europe and so caution is warranted in extrapolating the results to other populations or ethnicities worldwide. Finally, the order of magnitude for the association between the FSAm-NPS dietary index score and mortality found in our study was relatively modest but still in line with the one traditionally observed in nutritional epidemiology, and it was similar to the one observed in the study on cancer incidence in EPIC.35 From a public
health perspective, the opportunity to prevent 7% of premature deaths globally through healthier food choices might nonetheless be of great interest.
Potential sources of bias in our study warrant caution in the interpretation of the findings. Despite the low hazard ratios, several things allow for some confidence in our results and are in favour of an association supporting possible causality, beyond residual confounding: the robustness of associations across sensitivity analyses, including across categories of major potential confounders; null results obtained for associations between FSAm-NPS dietary index scores and mortality from external causes, which are unrelated to diet (negative control); E values that suggest moderate potential unmeasured confounding49 50;
consistency of the results with previous studies on the association between the FSAm-NPS dietary index score and health outcomes in independent cohorts27 29-34;
and consistency of the results with mechanistic hypotheses, supporting biological plausibility.
conclusions and policy implications
In this large cohort study involving 10 European countries, a diet composed on average of more food products with higher FSAm-NPS scores, which reflected poorer nutritional profiles, was associated with higher all cause and cause specific mortality. Overall, that a higher FSAm-NPS dietary index score, obtained for varied dietary patterns in different countries representing a diverse European population, leads to higher mortality rates, suggests that the FSAm-NPS is a relevant tool to characterise more or less healthy food products, no matter the food category or the specificities of the national dietary patterns.
This study adds to the current body of evidence for the FSAm-NPS score and for Nutri-Score, a nutrition label derived from the FSAm-NPS: studies linking the FSAm-NPS dietary index to health outcomes, including one study in the EPIC cohort,27 29-35 and studies on the
perception and understanding of Nutri-Score and its actual impact on food choices.24-26 28 70 Together, these
results back up the relevance of using the FSAm-NPS to grade the nutritional quality of food products in the framework of public health nutritional measures such as the Nutri-Score label, a tool aimed at the general public and patients to help them to choose food products of a higher nutritional quality. This is important considering ongoing and future debates at the EU level about making food labelling systems uniform on the front of food product packaging.
authOr aFFiliatiOns
1Sorbonne Paris Nord University, Inserm, Inrae, Cnam, Nutritional
Epidemiology Research Team (EREN), Epidemiology and Statistics Research Centre – University of Paris (CRESS), Bobigny, France
2French network for Nutrition And Cancer Research (NACRe
network), France
3International Agency for Research on Cancer, World Health
Organization, Lyon, France
4Department of Public Health, Hôpitaux Universitaires Paris
Seine-Saint-Denis (AP-HP), Bobigny, France
5Faculty of Medicine, School of Public Health, Imperial College
London, London, UK
6Department of Community Medicine, Faculty of Health Sciences,
UiT The Arctic University of Norway, Tromsø, Norway
7Department of Public Health, Section for Epidemiology, Aarhus
University, Aarhus C, Denmark
8Department of Public Health, University of Copenhagen,
Copenhagen, Denmark
9Danish Cancer Society Research Centre, Diet, Genes and
Environment, Copenhagen, Denmark
10CESP, INSERM U1018, Université Paris-Sud, UVSQ, Université
Paris-Saclay, Paris, France
11Gustave Roussy, Villejuif, France
12Division of Cancer Epidemiology, German Cancer Research Centre
(DKFZ), Heidelberg, Germany
13Department of Molecular Epidemiology, German Institute of
Human Nutrition Potsdam-Rehbruecke, Nuthetal, Germany
14Institute of Nutrition Science, University of Potsdam, Nuthetal,
Germany
15Hellenic Health Foundation, Athens, Greece
162nd Pulmonary Medicine Department, School of Medicine,
National and Kapodistrian University of Athens, Attikon University Hospital, Haidari, Greece
17Cancer Risk Factors and Life-Style Epidemiology Unit, Institute for
Cancer Research, Prevention and Clinical Network (ISPRO), Florence, Italy
on 19 November 2020 by guest. Protected by copyright.
http://www.bmj.com/
18Epidemiology and Prevention Unit, Fondazione IRCCS Istituto
Nazionale dei Tumori, Milan, Italy
19AOU Federico II, Naples, Italy
20Cancer Registry and Histopathology Department, Provincial Health
Authority ASP Ragusa, Italy
21Unit of Cancer Epidemiology, Città della Salute e della Scienza
University-Hospital and Centre for Cancer Prevention (CPO), Turin, Italy
22National Institute for Public Health and the Environment,
Bilthoven, Netherlands
23Julius Centre for Health Sciences and Primary Care, University
Medical Centre Utrecht, Utrecht University, Utrecht, Netherlands
24Public Health Directorate, Asturias, Spain
25Unit of Nutrition and Cancer, Cancer Epidemiology Research
Program, Catalan Institute of Oncology - ICO, Group of Research on Nutrition and Cancer, Bellvitge Biomedical Research Institute - IDIBELL, L’Hospitalet of Llobregat, Barcelona, Spain
26Andalusian School of Public Health (EASP), Granada, Spain 27Instituto de Investigación Biosanitaria de Granada (ibs.GRANADA),
Granada, Spain
28CIBER of Epidemiology and Public Health (CIBERESP), Spain 29Department of Epidemiology, Murcia Regional Health Council,
IMIB-Arrixaca, Murcia, Spain
30Research Group on Demography and Health, National Faculty of
Public Health, University of Antioquia, Medellín, Colombia
31Navarra Public Health Institute, Pamplona, Spain
32Navarra Institute for Health Research (IdiSNA), Pamplona, Spain 33Public Health Division of Gipuzkoa, Biodonostia Health Research
Institute, Ministry of Health of the Basque Government, San Sebastian, Spain
34Department of Clinical Sciences Malmö, Lund University, Malmö,
Sweden
35Department of Public Health and Clinical Medicine, Umeå
University, Umeå, Sweden
36MRC Epidemiology Unit, University of Cambridge School of Clinical
Medicine, Cambridge Biomedical Campus, Cambridge, UK
37MRC Centre for Environment and Health, School of Public Health,
Imperial College London, London, UK
38Department of Epidemiology and Biostatistics, School of Public
Health, Imperial College London, London, UK
39Department of Hygiene and Epidemiology, University of Ioannina
School of Medicine, Ioannina, Greece
40Cancer Epidemiology Unit, Nuffield Department of Population
Health, University of Oxford, Oxford, UK
We thank the EPIC participants and staff for contributing to this study. This work was performed within the framework of the French Network for Nutrition And Cancer Research (https://www6.inra.fr/nacre/). When authors are identified as staff of the International Agency for Research on Cancer/World Health Organization, the authors alone are responsible for the views expressed in this article and they do not necessarily represent the decisions, policy, or views of IARC/WHO. Contributors: MD, MT, SH, CJ, and IH conceived the study and defined the analytical strategy. MD, MT, and IH performed statistical analyses and provided preliminary interpretation of findings. MD and the writing group (IH, CJ, SH, ME, MJG, MT) drafted the manuscript. CB, CC, HAW, KO, ATj, ALR-H, M-CB-R, FRM, YM-S, TK, VK, MMB, MBS, ATr, AK, EP, GM, CA, MSDM, RT, CS, JMAB, WMMV, YTvdS, GS, TB, MLR, AA, DP, SMC-Y, AB, PA, ES, UE, JO, BSu, NJW, NGF, PV, KKT, AKn, KP, PF, ER, and MJG acquired the data and obtained funding to continue the study. All authors critically interpreted the results, revised the manuscript, provided relevant intellectual input, and read and approved the final manuscript. MD and MT had primary responsibility for the final content and are the guarantors. The corresponding author attests that all listed authors meet authorship criteria and that no others meeting the criteria have been omitted.
Funding: This work was funded by a research grant from the French National Cancer Institute (INCa)-Cancéropôle Ile-de-France (convention No 2017-1-PL SHS-01-INSERM ADR 5-1, principal investigator: MT, co-principal investigator MD). MD was supported by a grant from the Fondation Recherche Médicale (ARF201809007046). The coordination of EPIC is financially supported by the European Commission (DG-SANCO) and the International Agency for Research
on Cancer. The national cohorts are supported by the Danish Cancer Society (Denmark); Ligue Contre le Cancer, Institut Gustave Roussy, Mutuelle Générale de l’Education Nationale, and Institut National de la Santé et de la Recherche Médicale (Inserm), (France); Deutsche Krebshilfe, Deutsches Krebsforschungszentrum, and Federal Ministry of Education and Research (Germany); the Hellenic Health Foundation (Greece); Associazione Italiana per la Ricerca sul Cancro-AIRC-Italy and National Research Council (Italy); Dutch Ministry of Public Health, Welfare, and Sports, Netherlands Cancer Registry, LK Research Funds, Dutch Prevention Funds, Dutch ZON (Zorg Onderzoek Nederland), World Cancer Research Fund, and Statistics Netherlands (the Netherlands); Health Research Fund, Instituto de Salud Carlos III, regional governments of Andalucía, Asturias, Basque Country, Murcia, and Navarra, and the Catalan Institute of Oncology (Spain); Swedish Cancer Society, Swedish Scientific Council, and county councils of Skåne and Västerbotten (Sweden); Cancer Research UK (C864/A14136 to EPIC-Norfolk; C8221/A19170 to EPIC-Oxford), Medical Research Council (MR/N003284/1 and MC-UU_12015/1 to EPIC-Norfolk; MR/M012190/1 to EPIC-Oxford; UK). NJW and NGF acknowledge funding from the Medical Research Council Epidemiology Unit (MC_UU_12015/1 and MC_UU_12015/5) and National Institute for Health Research Biomedical Research Centre, Cambridge: Nutrition, Diet, and Lifestyle Research Theme (IS-BRC-1215-20014). AK and KP are supported by the Wellcome Trust, Our Planet, and Our Health (Livestock, Environment and People) (205212/Z/16/Z). The funders had no role in the study design or in the collection, analysis, interpretation of data, writing of the report, or decision to submit the article for publication.
Competing interests: All authors have completed the ICMJE uniform disclosure form at www.icmje.org/coi_disclosure.pdf and declare: support from the French National Cancer Institute (INCa)-Cancéropôle Ile-de-France and the Fondation Recherche Médicale; no financial relationships with any organisations that might have an interest in the submitted work in the previous three years; no other relationships or activities that could appear to have influenced the submitted work. Ethical approval: This study was approved by the local ethics committees and the internal review board of the International Agency for Research on Cancer.
Data sharing: Information on submitting an application for access to EPIC data or biospecimens is available at https://epic.iarc.fr/access/ index.php.
The lead authors (the manuscript’s guarantors) affirm that the manuscript is an honest, accurate, and transparent account of the study being reported; that no important aspects of the study have been omitted; and that any discrepancies from the study as planned (and, if relevant, registered) have been explained.
Dissemination to participants and related patient and public communities: The results of this article will be disseminated as lay summaries to the public through different channels, including articles on the open web platform The Conversation (in English and French), press releases, social media accounts of our research team, International Agency for Research on Cancer newsletter, and communications through the French Nutrition and Cancer Research network (www.inra.fr/nacre).
Provenance and peer review: Not commissioned; externally peer reviewed.
This is an Open Access article distributed in accordance with the Creative Commons Attribution Non Commercial (CC BY-NC 4.0) license, which permits others to distribute, remix, adapt, build upon this work non-commercially, and license their derivative works on different terms, provided the original work is properly cited and the use is non-commercial. See: http://creativecommons.org/licenses/ by-nc/4.0/.
1 Afshin A, Sur PJ, Fay KA, et al, GBD 2017 Diet Collaborators. Health effects of dietary risks in 195 countries, 1990-2017: a systematic analysis for the Global Burden of Disease Study 2017. Lancet 2019;393:1958-72. doi:10.1016/S0140-6736(19)30041-8
2 Organisation for Economic Co-operation and Development. Promoting sustainable consumption—good practices in OECD countries. OECD, Paris, 2008. www.oecd.org/ greengrowth/40317373.pdf
3 Hercberg S. Report to the French Ministry of Health: Propositions pour un nouvel élan de la politique nutritionnelle française de santé publique dans le cadre de la Stratégie Nationale de Santé - 1ère Partie: Mesures concernant la Prévention nutritionnelle. 2013. https://solidarites-sante.gouv.fr/IMG/pdf/rapport_ Hercberg_15_11_2013.pdf
on 19 November 2020 by guest. Protected by copyright.
http://www.bmj.com/