HAL Id: inserm-02368584
https://www.hal.inserm.fr/inserm-02368584
Submitted on 18 Nov 2019HAL is a multi-disciplinary open access archive for the deposit and dissemination of sci-entific research documents, whether they are pub-lished or not. The documents may come from teaching and research institutions in France or abroad, or from public or private research centers.
L’archive ouverte pluridisciplinaire HAL, est destinée au dépôt et à la diffusion de documents scientifiques de niveau recherche, publiés ou non, émanant des établissements d’enseignement et de recherche français ou étrangers, des laboratoires publics ou privés.
Combination of IL-2, rapamycin, DNA
methyltransferase and histone deacetylase inhibitors for
the expansion of human regulatory T cells
Makoto Miyara, Driss Chader, Aude Burlion, Jérémie Goldstein, Delphine
Sterlin, Francoise Norol, Hélène Trebeden-Negre, Laetitia Claër, Shimon
Sakaguchi, Gilles Marodon, et al.
To cite this version:
Makoto Miyara, Driss Chader, Aude Burlion, Jérémie Goldstein, Delphine Sterlin, et al.. Combination of IL-2, rapamycin, DNA methyltransferase and histone deacetylase inhibitors for the expansion of human regulatory T cells. Oncotarget, Impact journals, 2017, 8 (62), pp.104733-104744. �10.18632/on-cotarget.10914�. �inserm-02368584�
www.impactjournals.com/oncotarget/ Oncotarget, 2017, Vol. 8, (No. 62), pp: 104733-104744
Combination of IL-2, rapamycin, DNA methyltransferase and
histone deacetylase inhibitors for the expansion of human
regulatory T cells
Makoto Miyara1,2, Driss Chader1,2, Aude Burlion2, Jérémie Goldstein2, Delphine
Sterlin1,2, Françoise Norol3, Hélène Trebeden-Nègre3, Laetitia Claër1,2, Shimon
Sakaguchi4,*, Gilles Marodon2,*, Zahir Amoura1,2,5,6,* and Guy Gorochov1,2,6
1 Department of immunology, AP-HP Pitié Salpêtrière, Paris, France
2 Sorbonne Universités, UPMC Univ Paris 06, INSERM, CNRS, Centre d’Immunologie et des Maladies Infectieuses
(CIMI-Paris), Paris, France
3 Cell Therapy, AP-HP Pitié Salpêtrière, Paris, France
4 Experimental Immunology, Immunology Frontier Research Center, Osaka University, Osaka, Japan
5 Internal Medicine, French Reference Center for Systemic Lupus Erythematosus and Antiphospholipid Syndrome, AP-HP Pitié
Salpêtrière, Paris, France
6 UPMC Paris Sorbonne, Paris, France
* These authors have contributed equally to this work
Correspondence to: Makoto Miyara, email: makoto.miyara@aphp.fr
Correspondence to: Guy Gorochov, email: guy.gorochov@upmc.fr
Keywords: human regulatory T cells, FOXP3, cell therapy, autoimmunity, GVH
Received: June 07, 2016 Accepted: June 09, 2016 Published: July 28, 2016
Copyright: Miyara et al. This is an open-access article distributed under the terms of the Creative Commons Attribution License 3.0 (CC BY
3.0), which permits unrestricted use, distribution, and reproduction in any medium, provided the original author and source are credited.
ABSTRACT
FOXP3+ regulatory T cell (Treg) based cellular therapies represent promising therapeutic options in autoimmunity, allergy, transplantation and prevention of Graft Versus Host (GVH) Disease. Among human FOXP3-expressing CD4+T cells, only the CD45RA+ naïve Treg (nTreg) subset is suitable for in vitro expansion. However, FoxP3 expression decays in cells using currently described culture protocols.
Rapamycin alone was not able to prevent FOXP3 loss in nTregs cells, as only a half of them maintained FOXP3 expression after 14 days of culture. In contrast we report a novel combined drug regimen that can drastically stabilize FOXP3 expression in cultured Tregs. IL-2, rapamycin, histone deacetylase and DNA methyltransferase inhibitors act in synergy to allow expansion of human regulatory T cells with sustained high expression of FOXP3 and CD15s with potent suppressive capacities in vitro and control of murine xeno-GVH reactions. Of note, an additional subsequent infusion of expanded nTreg cells did not improve survival of mice.
Combination of IL-2, rapamycin, histone deacetylase and DNA methyltransferase inhibitors is optimal for the expansion in vitro of pure effective nTreg maintaining high levels of FOXP3 for therapeutic purposes.
INTRODUCTION
Thymus derived naturally occurring FOXP3 expressing CD4+ regulatory T cells (Treg cells) are indispensable for the maintenance of self tolerance and immune homeostasis [1]. Treg cells play a crucial role in the prevention of autoimmune diseases, allergy and allograft rejection. Manipulation of Treg cell biology has
therefore emerged as a potential alternative strategy for the control of immune responses [2].
Transfer of Treg cells isolated from spleen and lymph nodes of healthy mice have proven efficient in the prevention of numerous autoimmune diseases in various animal models [3-6], leading to the assumption that Treg cell could represent a new therapeutic option in autoimmunity [7, 8].
Because FOXP3 expressing Treg cells represent 1 to 6 % of CD4+ T cells in humans [9], in vitro expansion strategies are required to enable the infusion of significant number of Treg cells, given that 2 million Treg cells are usually required for infusion in mice (105 Treg cells per gram) to prevent autoimmunity [10] .
Human Treg cells were initially defined as CD4+CD25high T cells [11-16]. Thus, most strategies aiming at the expansion of human Treg cells have been mainly based on the isolation of CD25+CD4+ T cells, giving rise to expanding cells that contain significant proportions of cells that do not express FOXP3 [17, 18]. Because FOXP3 is a key molecule in the development and function of Treg cells, and because high levels of FOXP3 are more correlated with potent suppression than low levels of FOXP3 [19], Treg expansion protocols should incorporate means to maintain high levels of FOXP3 expression.
We have previously shown that human FOXP3 expressing CD4+ T cells are composed of three subsets that are phenotypically and functionally distinct: CD45RA+FOXP3low naïve Treg cells (nTreg cells) and CD45RA-FOXP3high effector Treg cells (eTreg cells) and CD45RA-FOXP3low non suppressive T cells (FOXP3low non Treg cells) [20]. In addition, we have recently shown that, among CD45RA-FOXP3+ cells, expression of surface marker CD15s (sialyl Lewis x) could differentiate eTreg cells, that are CD15s+, from FOXP3low non Treg cells that do not express CD15s [21]. Because FOXP3 expressing CD4+ T cells are heterogeneous, it is necessary to study FOXP3 and suppressive capacities of each in vitro-expanded subset. It is also important to determine which pathways can be manipulated in order to enhance FOXP3 expression and maintain suppressive capacities in cultured Treg cells. Currently accepted reference protocol for the
in vitro expansion of human Treg cells is based on the use
of rapamycin in combination with IL-2 [22]. Epigenetic changes such as DNA methylation of FOXP3 genes and acetylation of histones and of the FOXP3 protein itself have been shown to be important for the stability and the suppressive function of Treg cells [23-27]. We therefore questioned whether molecules modifying the epigenetics of Treg cells could enhance their expression of FOXP3 and/or their suppressive capacities in vitro or in vivo and whether their effects were better than the ones observed with rapamycin.
Here we report a novel combined drug regimen that can drastically stabilize FOXP3 expression in cultured Treg cells. IL-2, rapamycin, histone deacetylase and DNA methyltransferase inhibitors act in synergy to allow expansion of human regulatory T cells with sustained high expression of FOXP3 and CD15s with potent control of murine xeno-Graft Versus Host (GVH) reactions.
RESULTS
IL-2/rapamycin combination partially maintains
FOXP3 expression in expanding FOXP3+ CD4+ T
cell subsets
FOXP3 expressing CD4+ T cells are heterogeneous in terms of FOXP3 expression levels and suppressive capacities [9]. We examined whether purified FOXP3-expressing CD4+ T cells subsets had different fates upon expansion in vitro.
Neither FOXP3low CD45RA+nTreg nor
FOXP3lowCD45RA- non Treg cells were able to maintain FOXP3 expression in culture. In contrast eTreg cells maintained high levels of FOXP3 expression under the same culture conditions in term of percentage of cells and of MFI. However, the latter cells were poorly proliferative even in the presence of high dose IL-2 (Figure 1).
We also monitored longitudinally FOXP3lownonTreg cells and observed that about a half of expanding cells maintained FOXP3 expression upon expansion in vitro (mean % +/-SD: 55 +/- 13.5, mean MFI+/-SD: 2682 +/- 1416 after 7 days of culture). This indicates that some FOXP3low CD45RA- cells may have eTreg differentiation potentiality. In the presence of rapamycin in addition to IL-2, the proportion of expanding FOXP3lowCD45RA -non Treg cells maintaining FOXP3 expression was higher (mean % +/-SD: 66.9 +/- 8.4, mean MFI +/- SD: 4466 +/- 2411), which is consistent with the finding that rapamycin promotes the expansion of genuine Treg cells at the expense of non Treg cells [22]. However, significant proportion of expanding non Treg cells still lost FOXP3 expression after 7 days of culture, even in the presence of rapamycin (Figure 2A). This finding in addition to the poor capacity of eTreg cells to survive even in the presence of high dose IL-2 indicates that FOXP3+ cells with a CD45RA- phenotype are improper for expansion.
In contrast to eTreg cells, naïve Treg cells were highly proliferative in the presence of IL-2 and most expanding nTreg cells maintained FOXP3 expression until day 7 (Figure 1) indicating that nTreg cells are, as previously shown by Hoffman et al., better suited to in
vitro expansion than other FOXP3 expressing CD4+ T cell subsets [28]. However, expanded nTreg FOXP3 levels were clearly lower than those of expanded eTreg cells in term of % and of MFI (Figure 1). Moreover, nTreg cells progressively lost FOXP3 expression during the second week of expansion, even in the presence of rapamycin (mean % +/-SD: 49.69 +/- 10.6 and 51.6 +/- 6.26 in the presence of IL-2 alone or IL-2 and rapamycin respectively). These results indicate that neither IL-2 nor IL-2/rapamycin association can efficiently maintain FOXP3 expression in nTreg cells. (Figure 2)
Figure 1: FOXP3 expression following expansion in the presence of high dose IL-2. A. CD25-CD45RA+CD4+ T cells,
nTreg cells, FOXPp3low non Treg cells and eTreg cells were flow isolated according to the gating strategy described in Supplementary
Figure 1 and cultured for 7 days in the presence of anti-CD3/CD28 beads and IL-2 and analyzed for FOXP3 and Ki-67 expression. Representative flow cytometry of indicated CD4+FOXP3 expressing subsets from 11 individual experiments is shown (top). Threshold
for FoxP3 expression is defined in CD4+CD25-CDR45RA+ T cells after 7 days of culture. Numbers indicate % of cells in each quadrant.
Proportions of FOXP3+ cells and MFI corresponding to FOXP3 expression of indicated CD4+FOXP3 expressing subsets for each individual
experiment are presented using distinct colors (n = 11, bottom). Red horizontal bars represent mean percentages. Comparisons were made using the Wilcoxon matched pairs test. B. Fold expansion obtained after 7, 14 and 21 days of culture in the presence of anti-CD3/CD28 beads and IL-2 by indicated CD4+FOXP3 expressing subsets in 3 independent experiments. Error bar represent s.d.
Combination of azacytidin, vorinostat, rapamycin and IL-2 enhances FOXP3 expression in expanding nTreg cells
Since the addition of rapamycin to IL-2 is insufficient to maintain high expression of FOXP3 in nTreg, we investigated which pathways could be manipulated in order to maintain FOXP3 expression upon in vitro expansion. Because epigenetic changes such as DNA methylation of FOXP3 genes and acetylation of histones and of the FOXP3 protein itself have been shown to participate in Treg cell stability and suppressive function [23-27] , we assessed DNA methyl transferase inhibitor azacytidin and histone deacetylase inhibitor vorinostat for their capacity to enhance or even induce FOXP3 expression in vitro. Introduction of each molecule was by itself associated with increased proportions of FOXP3 expressing CD4+ T cells after 3 days of culture, compared to cells cultured in the presence of anti-CD3/ anti-CD28 coated beads and high dose IL-2 alone. We also determined the optimal ranges of concentration that favor the relative expansion of FOXP3+ CD4+ T cells in such
cultures without excessive toxic effects as being 1 to 10 microM for azacytidin and 0.1 to 3 microM for vorinostat. (Supplementary Figure 2)
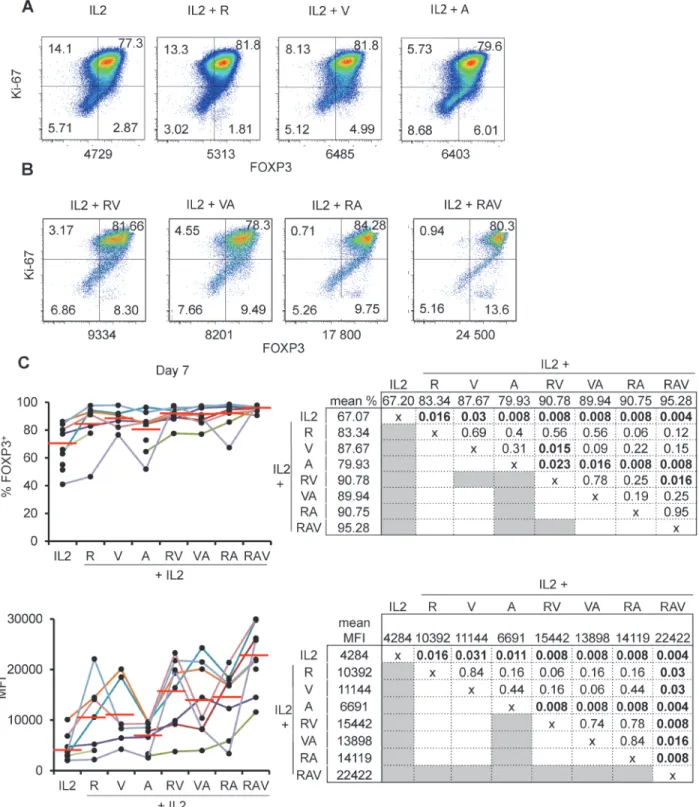
We then compared the effects of various combinations of rapamycin, azacytidin and vorinostat on nTreg expansion in the presence of IL-2. When tested separately, azacytidin (A), vorinostat (V) and rapamycin (R) had comparable effects on cultured nTreg cells as they enhanced FOXP3 expression in terms of % and MFI. However, none of the molecules was superior to others (Figure 3A and 3C). We then combined molecules two by two [i.e. rapamycin + azacytidin (RA); rapamycin + vorinostat (RV); and vorinostat + azacytidin (VA)] and observed, at day 7 of culture, that every combination was superior to azacytidin(A) alone but not to other drugs. RV combination was also superior to vorinostat (V) alone but not to rapamycin (R) alone. Of note, none of the pair-wise combination of the molecules mentioned above was superior to others. (Figure 3B and 3C).
We thus combined rapamycin, azacytidin, vorinostat (RAV) with IL-2 and this time observed a drastic effect on the preservation and the enhancement of FOXP3 expression of cultured nTreg cells until day 14 (Figure
Figure 2: Rapamycin does not prevent FoxP3 downregulation. A. FOXP3low non Treg cells and (B) CD25-CD45RA+CD4+ T
cells and nTreg cells were isolated and cultured for 14 days as in Figure 1 with or without addition of rapamycin (R) and then analyzed for FOXP3 and Ki-67 expression. Threshold for FOXP3 expression is defined in CD4+CD25-CDR45RA+ T cells after 14 days of culture.
Representative Flow cytometry data (left) and summary of 8 color-coded individual experiments (right). Red horizontal bars represent mean percentages. Comparisons were made using the Wilcoxon matched pairs test.
Figure 3: nTreg FOXP3 expression following expansion under IL-2, rapamycin, azacytidin and vorinostat combinations.
A. and B. Ki-67 and FOXP3 expression in nTreg isolated and cultured as described in Figure 1 with addition of (A) rapamycin (R), azacytidin (A), Vorinostat (V) indicated combinations. One representative experiment out of 8. Numbers under each panel indicate cellular MFI following anti-FOXP3 conjugated with PE. C. Proportions of FOXP3+ cells (top) and corresponding MFI (bottom) in expanding nTreg cells under indicated culture conditions. Each individual experiment (n = 8) is color-coded (left). Red horizontal bars represent mean percentages. Mean % and MFI pair wise comparisons using the Wilcoxon matched pairs test are displayed in charts (right). Significant p values ( < 0.05) are bold highlighted in shaded boxes.
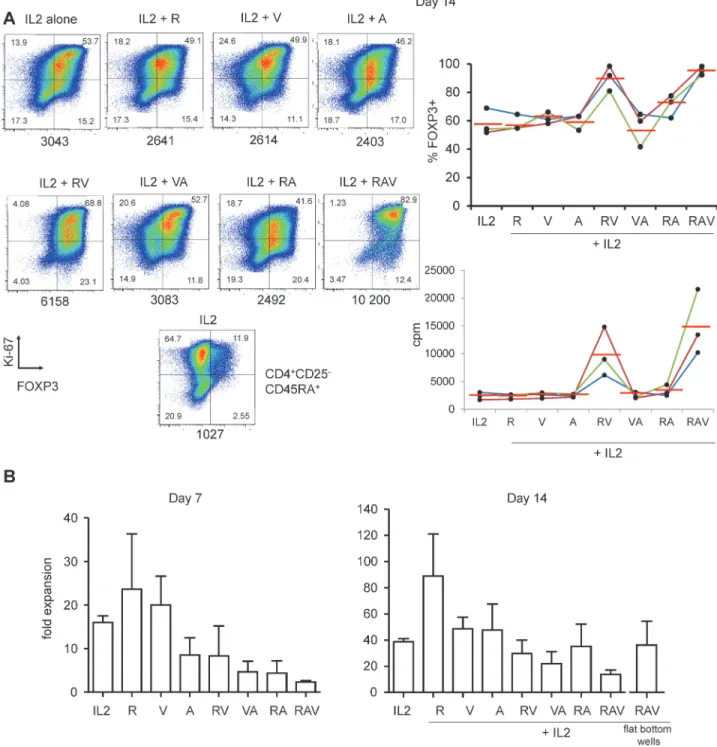
3B, 3C and Figure 4A). Interestingly, not only proportions of FOXP3+ cells, but also FOXP3 levels were increased in nTreg cells expanded in that way, compared to FOXP3 levels in nTreg cells expanded using other combinations at day 7 (see mean MFIs in Figure 3C) and day 14 of culture (Figure 4A).
We also measured nTreg cells expansion rates under each combination described above. Maximal expansion rate was obtained with IL-2 and rapamycin (23.7 fold expansion +/-12.7 at day 7 and 89 fold expansion +/-32 at day 14). The 3 molecules cocktail significantly reduced initial nTreg proliferation (2.3 fold expansion +/-0.57,
Figure 4: Highly pure FoxP3high cells after 14 days of culture under RAV regimen. A. Ki-67 and FOXP3 expression in nTreg
cells isolated and cultured as in Figure 1, but for 14 days in the presence of indicated R, A and V combinations. Expanded CD4+CD25
-CD45RA+ T cells were also co-analysed in order to set the threshold for FOXP3 expression (bottom plot). MFI values are indicated below
each panel. One representative (left) experiment out of 3 (right). B. Day 7 (left) and 14 (right) expansion rate of nTreg cells in the presence of IL-2 alone or in combination with indicated molecules. Mean values with standard seviations (s.d.) from 3 independent experiments.
day 7). However, after 2 weeks of culture nTreg were nevertheless amplified 13.7 +/-5.9 fold, only three times less than in the presence of IL-2 alone (38.7 +/-4.1) (Figure 4B). We next sought to optimize the proliferation rate of nTreg cells in the presence of RAV. The aforementioned expansion rates were obtained upon culture in U-bottom wells. We thus cultured the cells in flat bottom wells and could obtained better expansion rates as nTreg cells in the presence of RAV amplified 37 +/-18 fold after 2 weeks of culture (n = 3, Figure 4B).
Thus, the combination of rapamycin, vorinostat and azacytidin (RAV) is suitable for the optimal expansion of nTreg maintaining high expression of FOXP3 in the presence of IL-2.
Combination of azacytidin, vorinostat, rapamycin and IL-2 preserves nTreg cells suppressive function in vitro and in vivo
We then verified that nTreg cells expanded under the three drug regimen retained their suppressive capacities
in vitro. As shown, nTreg cells expanded for 10 to 14
days in the presence of 2 and the combination of IL-2, rapamycin, vorinostat and azacytidin potently suppress autologous responder T cell proliferation. Of note, nTreg cells expanded in the presence of each molecule alone or in the presence of RA or VA combinations showed less potent suppression than nTreg cells expanded under the three drug regimen while nTreg cells expanded in the presence of RA showed equivalent suppressive capacities (Figure 5A).
We have recently shown that surface expression of CD15s (sialyl Lewis x) identifies circulating highly suppressive FOXP3high effector Treg cells. While naïve Treg cells do not express CD15s when isolated ex vivo and while only a minority of the latter upregulated CD15s after activation even in the presence of rapamycin [21], we could observe that most of expanding nTreg cells expressed CD15s in the presence of RAV combination (Figure 5B). This result further indicates that the RAV combination enables the expansion of CD4+ T cells with phenotypic and functional properties that correspond to those observed on ex vivo isolated effector Treg cells i.e. they display high levels of FOXP3, are CD15s+ and are highly suppressive in vitro.
Finally, we evaluated the suppressive capacity of nTreg cells expanded in the presence of RAV combination
in vivo as their capacity to delay xeno GVHD in NOD
common gamma chain (-/-) SCID mice (NSG) mice. Irradiated NSG mice develop severe GVH disease within 3 weeks after the transfer of 2 million human PBMCs. In comparison, when the same amount of human PBMCs was co-transferred with 2 million nTreg cells expanded for 14 days under RAV condition in vitro, we observed that GVHD was significantly delayed. All mice injected
with PBMCs alone (n = 6) were dead 2 months after the infusion of PBMCs while at least half of the mice co-injected with PBMCs and expanded nTreg cells were alive. Some of surviving mice kept increasing weight in both ramamycin alone and RAV groups (supplementary Figure 3). The survival of mice co-transferred with PBMCs and nTreg cells cultured with RAV (RAV mice,
n = 6) was comparable to the survival of mice co-injected
with PBMCs and nTregs cells cultured with rapamycin (R mice, n = 6), indicating that RAV regimen is at least as efficient as rapamycin alone for the expansion of in vivo suppressive nTreg cells. Of note, the number of FOXP3+ Treg cells in the spleen of surviving mice at day 90 was significantly higher in RAV mice (Figure 5C).
Finally, we evaluated whether a second injection of expanded nTreg cells 10 days after the first injection could lead to better survival. No difference was observed in terms of survival in mice injected twice with nTreg cells expanded with RAV (n = 6) or rapamycin alone (n = 6) when compared to mice with a single injection (p = 0.23 for the comparision of 1 infusion of nTreg cells cultured with rapamycin vs 2 infusions and p = 0.87 for the corresponding comparison for nTreg cells cultured with the RAV regimen (Figure 5C).
While the overall survival was not statistically different when comparing R mice and RAV mice, we could observe that the lymphocytic infiltrates were milder in the liver at day 10 and in the lung at day 90 when Treg cells were expanded in the presence of RAV (Figure 5D).
Altogether, these results indicate that a 10 to 14 days culture with high dose IL-2 and the combination of rapamycin, histone deacetylase inhibitor vorinostat and DNA methyltransferase inhibitor azacytidin is optimal for the expansion of human CD45RA+ naïve Treg cells with sustained high expression of FOXP3 and potent suppression capacities in vitro and in vivo.
DISCUSSION
Because Treg cells are required for the maintenance of self tolerance in vivo, Treg-based cell therapy has been proposed as a novel strategy to treat autoimmune diseases or GVHD and to promote tolerance to allografts [2]. Because Treg cells represent a minority of CD4+ T cells, expansion steps are mandatory in order to infuse enough cells in patients [10, 14]. During the last years, several groups have proposed different strategies to expand human Treg cells in vitro leading to deceptive results in term of FOXP3 expression levels at the end of the process [22, 28, 29] .
Given that FOXP3 expressing CD4+ T cells are heterogeneous, inefficient Treg cells expansion can be the result of an inadequate choice of FOXP3+ subset(s) as starting material. Because human Treg cells have initially been described as CD4+CD25high cells, initial expansion strategies focused on the latter and did not take into
Figure 5: RAV combination preserves in vitro and in vivo suppressive nTreg cells function. A. nTreg cells cultured for 14 days in days in the presence of indicated combinations of R, A and V molecules were co-cultured with autologous CD25-CD45RA+CD4+T
responder cells labeled with CFSE in the presence of plate-bound anti-CD3 (0.5 microg/mL) and autologous irradiated B cells and monocytes. CFSE dilution was analyzed after 96 hours of culture on gated CD4+CFSE+ T cells. % of suppression are indicated. One
experiment representative out of 4 independent experiments is shown (left). Mean % suppression by nTreg cells cultured for 12-14 days in the presence of indicated combinations of R, A and V molecules (n = 4). Error bars indicate s.d (right). B. Expanding nTreg cells upregulate CD15s in vitro in the presence of RAV combination. nTreg cells were FACS isolated and cultured for 14 days in the presence of anti-CD3/ CD28 beads, IL-2 and R (left) or in the presence of R, A and V (right). Cells were then analyzed for the expression of CD15s and FOXP3. Data are representative of 3 independent experiments. C. nTreg cells (2x10^6 cells) cultured for 14 days under RAV regimen (n = 6, black line) or rapamycin (n = 6, red line) were co-transferred with 2x10^6 autologous PBMCs in NSG mice (top left). Expanded nTreg cells with RAV (n = 6, black line) or rapamycin (n = 6, red line) were re-injected 10 days after the cotransfer in other mice (top right). Survival of the mice were compared to NSG mice injected with 2x10^6 PBMCs alone (blue line, n = 6). Comparisons (purple arrow for R vs RAV comparison, red for R vs PBMCs alone and black for RAV vs PBMCs alone) were made using a Log-rank (Mantel-Cox) Test. p value < 0.05 is considered significant (top). Proportions of FOXP3 expressing cells among CD4+ T cells and absolute counts of FOXP3+CD4+ T
cells in the spleen of surviving mice at day 91. Of note, cells from 1 spleen from the rapamycin 1 injection group and from 1 spleen of the RAV 2 injections group could not be analyzed because these spleens were highly fibrotic (bottom). D. Histopathological analysis of liver and lung of mice injected with PBMCs, PBMCs and nTreg cells expanded in the presence of rapamycin alone (R) or rapamycin associated with vorinostat and azacytidin (RAV). Statistical comparisons were made using unpaired t test. vs < 0.05 are considered significant. **p < 0.01 ***p < 0.001 ns: not significant.
account more advanced definitions distinguishing between CD45RA+ and CD45RA- cells and between FOXP3high and FOXP3low cells [2, 9, 30]. The weak expansion rate, purity and intensity of expression of FOXP3 in expanded CD4+CD25high cells can be explained by (1) the presence within CD25high cells of FOXP3high cells with poor expansion potentiality, (2) the low proportion of nTreg cells and (3) the presence of contaminating FOXP3low non Treg cells. Other groups have focused on CD4+CD25+CD127low/- cells because this phenotypic definition indeed encompasses all FOXP3 expressing CD4+ T cells [31, 32]. However, the impossibility to expand a homogeneous FOXP3bright population starting from sorted CD4+CD25+CD127low/- underlines the inclusion of numerous FOXP3low non Tregs cells in this definition [33]. Indeed, most of the latter cannot maintain FOXP3 expression even in the presence of high dose IL-2 (Figure 1 and 2). Of note, a subset of FOXP3low non Treg cells displayed high levels of FOXP3 upon expansion indicating that some FOXP3low CD45RA- non Treg cells may have eTreg differentiation potentiality (Figure 1 and 2). This finding further indicates that FOXP3+ non Treg cells are heterogenous, not only in their ability to produce cytokines [20, 34] but also in their capacity to adopt an eTreg profile.
Hofmann et al. have therefore proposed that CD45RA+ nTreg cells would represent better candidates for in vitro expansion [28]. They nevertheless observed that repetitive stimulation of nTreg cells in vitro led to the FOXP3 downregulation [18]. We also observed that nTreg cells as well eTreg cells could lose FOXP3 expression, even in the absence of repetitive TCR engagement (Figure 1).
Here we show that the presently considered optimal Treg expansion protocol, that is, high dose IL-2 combined to rapamycin, a molecule widely known to enhance Treg purity by eliminating non Treg cells [22], was insufficient for the induction and/or maintenance of high FOXP3 levels in expanded nTreg cells (Figure 2).
Our objective was therefore to determine which other combination of drug candidates could allow expansion of pure Treg populations with preserved immunosuppressive function. Combination of IL-2 with rapamycin, histone deacetylase inhibitor vorinostat and DNA methyltransferase inhibitor azacytidin met these requirements. Indeed, we showed that nTreg cells expanded under this regimen expressed CD15s [21] and were potently suppressive in vitro. We have recently shown that CD15s is a surface marker specific for potently suppressive Treg cells with high expression of FOXP3. CD15s is involved in the transmigration of cells toward endothelial cells through interactions with P- and E-selectins [35]. Therefore, isolation of expanding Treg cells bearing CD15s using anti-CD15s antibodies may not be suitable for cell therapy as anti-CD15s antibodies might
impair their migration to target organs by neutralizing CD15s and thus prevent suppression in tissues in vivo.
Because it is not yet established that in vitro suppression is equivalent to in vivo Treg mediated suppression, we conducted experiments in NSG mice and could confirm that nTreg cells expanded in that way could indeed prevent GVH disease, although not completely (Figure 5). This is in line with previous results showing that purified Treg cells could not prevent xeno GVH lethality in the NSG mice [36]. Because the widely accepted reference regimen for the in vitro expansion of nTreg cells is based on the use of rapamycin, we compared the efficiency of nTreg cells expanded in the presence of RAV with those expanded in the presence of rapamycin in the prevention of GVH disease in mice. Because the survival rate of mice in both groups was similar, we conclude that RAV regimen is at least as efficient as rapamycin for the expansion of in vivo suppressive nTreg cells. Moreover, we observed a higher number of residual nTreg cells in the spleen of mice injected with nTreg cells expanded in the presence of RAV, milder lymphocytic infiltrates in the liver and the lung, indicating that cell therapy strategies based of the infusion of nTreg cells with RAV combination may have a better long term efficacy than nTregs expanded with rapamycin alone.
Expansion of pure Tregs populations free of contaminating non-Treg cells is presently obtained at the cost of culture yield. Indeed, the expansion rate of nTreg cells under this optimized condition remains relatively modest compared to other published strategies [28, 29]. We believe that this does not represent a limitation for clinical application since clinical grade strategies to isolate a large number of leukocytes through leukapheresis are already widely used. From 2.107 to 108 sorted cells, it can be expected to expand from 8 x 10⁸ to 4 x 10⁹ FOXP3high nTreg cells (i.e. 1.3x10⁷ to 6x10⁸ nTregs per kg for a standard 60 kg weight) after 14 days of culture.
We also showed that multiple sequential infusions of expanded nTreg cells were not necessary to control GHVD as a second infusion of expanded nTreg cells did not improve the survival of mice. This result brings further evidence that expanded nTreg cells are suited for the prevention of GVHD and may not be accurate to ameliorate an ongoing disease.
Since the present protocol was optimized using clinical grade reagents (X vivo culture media, AB human serum, cGMP antiCD3/anti-CD28 beads, clinical grade IL-2, rapamycin, azacytidin and vorinostat), RAV-expanded naïve Treg cells could be rapidly available for clinical evaluation. Whether infusion of nTreg cells cultured using this condition is safe in healthy volunteers and in patients is still yet to be determined in controlled clinical prospective studies.
MATERIAL AND METHODS
Cell isolation and flow cytometry
PBMCs were isolated through Ficoll gradient separation from freshly drawn blood. CD4+T cells were first magnetically isolated using a CD4 T cell separation kit (Miltenyi) and subsequently surface stained using a combination of flurochrome-conjugated mAbs: anti-CD4-PErCP 5.5, anti-CD25-PE, anti-CD127-AF647 and anti-CD45RA-FITC obtained from BD bioscience. CD25-CD45RA+CD4+, FOXP3low non Treg, naïve FOXP3lowCD45RA+ and effector FOXP3highCD45RA -Treg cells were flow isolated from PBMCs following flow isolation according to the gating strategy we validated previously using a FACSAria (BD bioscience) [20] (Supplementary FIGURE 1).
Expanded cells were counted and flow analyzed every week for the expression of FOXP3 and Ki-67 after fixation and permeabilization (eBioscience) on a FACSCanto (BDBioscience) cytometer and analyzed using FlowJo software (Treestar). Cells were stained with PerCP-anti CD4, PE-anti FOXP3 (259D/C7 clone), AF647-CD15s (CSLEX1) and FITC-anti Ki67-mAb (BDbiosciences).Because FOXP3 expression cut-off that differentiates positive cells from negative cells is different in cultured cells compared to ex vivo isolated cells, we also cultured CD4+CD25-CD45RA+ cells as control cells that were used to the determinate the right threshold for FOXP3 expression in expanded Treg cells and non Treg cells.
Cell culture
Isolated cells were immediately distributed into U or flat bottom well for culture and expansion. To analyze the effect of tested molecules or combination of molecules, 10 to 30 *103 evaluated cells were collected per U bottom. Cells were cultured in conditions suitable for clinical application that is, X-vivo 15 media, (Lonza) with 5% AB serum (Invitrogen Lifetech) and supplemendted with 2mM L-glutamin, 1mM sodium pyruvate,1% non essential amino acid MEM, 100U/mL penicillin, 100 µg/ml streptomycin and amphotericin B (all from Gibco) anti-CD3/anti-CD28 coated Treg expander beads (Invitrogen Lifetech). Cells evaluated for expansion were first polyclonally stimulated using anti-CD3/anti-CD28 beads (concentration: 40 000 beads/microL; 2 microL/ well) in the presence of 300 IU/mL IL-2 (Miltenyi Biotec) in culture media in the presence of a combination of Rapamycin (Sigma-Aldrich) diluted in culture medium (1 microg/mL), Azacytidin (Vidaza® from Celgene) first diluted in PBS and then in culture medium (5 microM) and Vorinostat (Selleck chem) first diluted in DMSO and
then in culture medium (1 microM). 300 to 1000 IU/mL IL-2 was added every 3-4 days. Cells were cultured for 7, 14 or 21 days in U or flat bottom wells. Cells were counted and analyzed for FOXP3 expression at day 7 and day 14.
In vitro suppressive assays
Expanded cells were assessed for suppressive function between 10 and 14 days of culture. 1 × 10⁴ CFSE (1µM Invitrogen)-labeled responder CD25 -CD45RA+CD4+ T cells were cocultured with 1 × 10⁴ unlabeled cells assessed for their suppressive capacity and 1 × 10⁵ irradiated autologous accessory cells containing B cells and monocytes. Cells were stimulated with 0.5 μg/mL plate-bound anti-CD3 (OKT3 mAb) in 96-well round-bottom plate in RPMI medium supplemented with 10% fetal bovin serum (Bio West), 2mM L-glutamin, 1mM sodium pyruvate,1% non essential amino acid MEM, 100U/mL penicillin, 100 µg/ml streptomycin and amphotericin B (all from Gibco). Proliferation of CFSE-labeled cells was assessed by flow cytometry after 84-90 hr of culture. Percent suppression was calculated as follows: [1 - (number of proliferating CFSE diluting responder cells in the presence of suppressor cells at a 1 to 1 ratio / number of proliferating responder cells when cultured alone)] x 100 .
Mice
NOD.Cg-Prkdcscid Il2rgtm1Wjl/SzJ (NSG) (stock ≠005557, The Jackson Laboratory) mice were bred in our own animal facilities in Specific Pathogen-Free conditions (accreditation number from the Veterinary services: A75-13-10) with an enriched fat regime and addition of Bactrim in drinking water every other week. The colony was regularly checked for γ-c deficiency by PCR according to the Jackson Laboratory protocol. All procedures were approved by the Regional Ethical Commitee on Animal Experimentation.
Induction of xeno-Graft vs. Host disease in NSG mice
Young adult NSG female mice (11 weeks old) were irradiated (2 Gy) and received 2x10⁶ PBMCs from a healthy donor with or without 2x10⁶ autologous Treg cells cultured in IL-2 + RAV conditions or rapamycin alone for 14 days. Some mice received a second infusion of 106 expanded cells 10 days after the first injection. Animals were euthanatized if their weight dropped below 80% of their initial weight or when the weight was stabilized or increased 90 days after the injection without signs of GVH disease.
Histological analysis
Liver and lungs were embedded in OCT and immediately frozen in liquid nitrogen. Organs were further sectioned (6µm thick) for hematoxylin-eosin staining. Slides were coded without reference to prior treatment and examined in a blinded fashion for quantification. For liver, localized infiltrates were numbered and normalized with vessel number. For lungs, degree of infiltrate was scored according to a scale going to 0 ( = no infiltrate) to 5 ( = covered field infiltrate 100%). Histological images were acquired with an Olympus CK2 microscope (Shinjuku, Tokyo, Japan) plus Moticam 2300 camera, and analysed with Motic Software (Motic Asia, Hong Kong).
ACKNOWLEDGMENTS
We thank the Flow Cytometry Core CyPS, Pierre & Marie Curie University, Pitie-Salpetriere Hospital, Paris, France for technical assistance.
CONFLICTS OF INTEREST
Robert Balderas and Noel Warner from Becton Dickinson Bioscience / Pharmingen (San Diego USA) provided some reagents.
GRANT SUPPORT
This work was supported by grant from the Institut National de la Santé et de la Recherche Médicale, from
the Centre d’Investigation Biologiques (C.I.B.) Pitié-Salpêtrière. The study was also supported by a grant from the European Union (ATTACK project LHS-CT-2005-018914). MM was successively supported by Association Lupus France and la Société Nationale Française de Médecine Interne. ZA was supported by a research grant by ARTHRITIS Fondation Courtin. Editorial note
This paper has been accepted based in part on peer-review conducted by another journal and the authors’ response and revisions as well as expedited peer-review in Oncotarget.
REFERENCES
1. Sakaguchi S, Yamaguchi T, Nomura T, Ono M. Regulatory T cells and immune tolerance. Cell. 2008; 133:775-787. 2. Miyara M, Wing K, Sakaguchi S. Therapeutic approaches
to allergy and autoimmunity based on FOXP3+ regulatory T-cell activation and expansion. The Journal of allergy and
clinical immunology. 2009; 123:749-755; quiz 756-747. 3. Sakaguchi S, Sakaguchi N, Asano M, Itoh M, Toda M.
Immunologic self-tolerance maintained by activated T cells expressing IL-2 receptor alpha-chains (CD25). Breakdown of a single mechanism of self-tolerance causes various autoimmune diseases. J Immunol. 1995; 155:1151-1164. 4. Hori S, Nomura T, Sakaguchi S. Control of regulatory
T cell development by the transcription factor FOXP3. Science. 2003; 299:1057-1061.
5. Khattri R, Cox T, Yasayko SA, Ramsdell F. An essential role for Scurfin in CD4+CD25+ T regulatory cells. Nat Immunol. 2003; 4:337-342.
6. Fontenot JD, Gavin MA, Rudensky AY. FOXP3 programs the development and function of CD4+CD25+ regulatory T cells. Nat Immunol. 2003; 4:330-336.
7. Miyara M, Gorochov G, Ehrenstein M, Musset L, Sakaguchi S, Amoura Z. Human FOXP3+ regulatory T cells in systemic autoimmune diseases. Autoimmun Rev. 2011; 10:744-755.
8. Miyara M, Sakaguchi S. Human FOXP3(+)CD4(+) regulatory T cells: their knowns and unknowns. Immunology and cell biology. 2011; 89:346-351.
9. Sakaguchi S, Miyara M, Costantino CM, Hafler DA. FOXP3+ regulatory T cells in the human immune system. Nature reviews Immunology. 2010; 10:490-500.
10. Riley JL, June CH, Blazar BR. Human T regulatory cell therapy: take a billion or so and call me in the morning. Immunity. 2009; 30:656-665.
11. Baecher-Allan C, Brown JA, Freeman GJ, Hafler DA. CD4+CD25high regulatory cells in human peripheral blood. J Immunol. 2001; 167:1245-1253.
12. Dieckmann D, Plottner H, Berchtold S, Berger T, Schuler G. Ex vivo isolation and characterization of CD4(+)CD25(+) T cells with regulatory properties from human blood. The Journal of experimental medicine. 2001; 193:1303-1310. 13. Jonuleit H, Schmitt E, Stassen M, Tuettenberg A, Knop J,
Enk AH. Identification and functional characterization of human CD4(+)CD25(+) T cells with regulatory properties isolated from peripheral blood. The Journal of experimental medicine. 2001; 193:1285-1294.
14. Levings MK, Sangregorio R, Roncarolo MG. Human cd25(+)cd4(+) t regulatory cells suppress naive and memory T cell proliferation and can be expanded in vitro without loss of function. The Journal of experimental medicine. 2001; 193:1295-1302.
15. Ng WF, Duggan PJ, Ponchel F, Matarese G, Lombardi G, Edwards AD, Isaacs JD, Lechler RI. Human CD4(+) CD25(+) cells: a naturally occurring population of regulatory T cells. Blood. 2001; 98:2736-2744.
16. Taams LS, Smith J, Rustin MH, Salmon M, Poulter LW, Akbar AN. Human anergic/suppressive CD4(+) CD25(+) T cells: a highly differentiated and apoptosis-prone population. European journal of immunology. 2001;
31:1122-1131.
17. Peters JH, Hilbrands LB, Koenen HJ, Joosten I. Ex vivo generation of human alloantigen-specific regulatory T cells from CD4(pos)CD25(high) T cells for immunotherapy. PloS one. 2008; 3:e2233.
18. Hoffmann P, Boeld TJ, Eder R, Huehn J, Floess S, Wieczorek G, Olek S, Dietmaier W, Andreesen R, Edinger M. Loss of FOXP3 expression in natural human CD4+CD25+ regulatory T cells upon repetitive in vitro
stimulation. Eur J Immunol. 2009; 39:1088-1097.
19. Allan SE, Alstad AN, Merindol N, Crellin NK, Amendola M, Bacchetta R, Naldini L, Roncarolo MG, Soudeyns H, Levings MK. Generation of potent and stable human CD4+ T regulatory cells by activation-independent expression of FOXP3. Mol Ther. 2008; 16:194-202.
20. Miyara M, Yoshioka Y, Kitoh A, Shima T, Wing K, Niwa A, Parizot C, Taflin C, Heike T, Valeyre D, Mathian A, Nakahata T, Yamaguchi T, et al. Functional delineation and differentiation dynamics of human CD4+ T cells expressing the FOXP3 transcription factor. Immunity. 2009; 30:899-911.
21. Miyara M, Chader D, Sage E, Sugiyama D, Nishikawa H, Bouvry D, Claer L, Hingorani R, Balderas R, Rohrer J, Warner N, Chapelier A, Valeyre D, et al. Sialyl Lewis x (CD15s) identifies highly differentiated and most suppressive FOXP3high regulatory T cells in humans. Proc Natl Acad Sci U S A. 2015; 112:7225-7230.
22. Battaglia M, Stabilini A, Migliavacca B, Horejs-Hoeck J, Kaupper T, Roncarolo MG. Rapamycin promotes expansion of functional CD4+CD25+FOXP3+ regulatory T cells of both healthy subjects and type 1 diabetic patients. J Immunol. 2006; 177:8338-8347.
23. Baron U, Floess S, Wieczorek G, Baumann K, Grutzkau A, Dong J, Thiel A, Boeld TJ, Hoffmann P, Edinger M, Turbachova I, Hamann A, Olek S, Huehn J. DNA demethylation in the human FOXP3 locus discriminates regulatory T cells from activated FOXP3(+) conventional T cells. Eur J Immunol. 2007; 37:2378-2389.
24. Floess S, Freyer J, Siewert C, Baron U, Olek S, Polansky J, Schlawe K, Chang HD, Bopp T, Schmitt E, Klein-Hessling S, Serfling E, Hamann A, et al. Epigenetic control of the FOXP3 locus in regulatory T cells. PLoS Biol. 2007; 5:e38. 25. Tao R, de Zoeten EF, Ozkaynak E, Chen C, Wang L,
Porrett PM, Li B, Turka LA, Olson EN, Greene MI, Wells AD, Hancock WW. Deacetylase inhibition promotes the generation and function of regulatory T cells. Nat Med. 2007; 13:1299-1307.
26. Koenen HJ, Smeets RL, Vink PM, van Rijssen E, Boots AM, Joosten I. Human CD25highFOXP3pos regulatory T cells differentiate into IL-17-producing cells. Blood. 2008; 112:2340-2352.
27. van Loosdregt J, Vercoulen Y, Guichelaar T, Gent YY, Beekman JM, van Beekum O, Brenkman AB, Hijnen DJ, Mutis T, Kalkhoven E, Prakken BJ, Coffer PJ. Regulation
of Treg functionality by acetylation-mediated FOXP3 protein stabilization. Blood. 2010; 115:965-974.
28. Hoffmann P, Eder R, Boeld TJ, Doser K, Piseshka B, Andreesen R, Edinger M. Only the CD45RA+ subpopulation of CD4+CD25high T cells gives rise to homogeneous regulatory T-cell lines upon in vitro
expansion. Blood. 2006; 108:4260-4267.
29. Hippen KL, Merkel SC, Schirm DK, Sieben CM, Sumstad D, Kadidlo DM, McKenna DH, Bromberg JS, Levine BL, Riley JL, June CH, Scheinberg P, Douek DC, et al. Massive ex vivo expansion of human natural regulatory T cells (T(regs)) with minimal loss of in vivo functional activity. Sci Transl Med. 2011; 3:83ra41.
30. Miyara M, Amoura Z, Parizot C, Badoual C, Dorgham K, Trad S, Kambouchner M, Valeyre D, Chapelon-Abric C, Debre P, Piette JC, Gorochov G. The immune paradox of sarcoidosis and regulatory T cells. J Exp Med. 2006; 203:359-370.
31. Seddiki N, Santner-Nanan B, Martinson J, Zaunders J, Sasson S, Landay A, Solomon M, Selby W, Alexander SI, Nanan R, Kelleher A, Fazekas de St Groth B. Expression of interleukin (IL)-2 and IL-7 receptors discriminates between human regulatory and activated T cells. The Journal of experimental medicine. 2006; 203:1693-1700.
32. Liu W, Putnam AL, Xu-Yu Z, Szot GL, Lee MR, Zhu S, Gottlieb PA, Kapranov P, Gingeras TR, Fazekas de St Groth B, Clayberger C, Soper DM, Ziegler SF, Bluestone JA. CD127 expression inversely correlates with FOXP3 and suppressive function of human CD4+ T reg cells. J Exp Med. 2006; 203:1701-1711.
33. Putnam AL, Brusko TM, Lee MR, Liu W, Szot GL, Ghosh T, Atkinson MA, Bluestone JA. Expansion of human regulatory T-cells from patients with type 1 diabetes. Diabetes. 2009; 58:652-662.
34. d’Hennezel E, Yurchenko E, Sgouroudis E, Hay V, Piccirillo CA. Single-Cell Analysis of the Human T Regulatory Population Uncovers Functional Heterogeneity and Instability within FOXP3+ Cells. J Immunol. 2011; 186:6788-6797.
35. Polley MJ, Phillips ML, Wayner E, Nudelman E, Singhal AK, Hakomori S, Paulson JC. CD62 and endothelial cell-leukocyte adhesion molecule 1 (ELAM-1) recognize the same carbohydrate ligand, sialyl-Lewis x. Proc Natl Acad Sci U S A. 1991; 88:6224-6228.
36. Lu L, Zhou X, Wang J, Zheng SG, Horwitz DA. Characterization of protective human CD4CD25 FOXP3 regulatory T cells generated with IL-2, TGF-beta and retinoic acid. PLoS One. 2010; 5:e15150.