HAL Id: inserm-00211161
https://www.hal.inserm.fr/inserm-00211161
Submitted on 4 Jul 2012
HAL is a multi-disciplinary open access archive for the deposit and dissemination of sci-entific research documents, whether they are pub-lished or not. The documents may come from teaching and research institutions in France or abroad, or from public or private research centers.
L’archive ouverte pluridisciplinaire HAL, est destinée au dépôt et à la diffusion de documents scientifiques de niveau recherche, publiés ou non, émanant des établissements d’enseignement et de recherche français ou étrangers, des laboratoires publics ou privés.
other interventions.
Louis Rachid Salmi, Samy Suissa, Geneviève Chêne, Roger Salamon
To cite this version:
Louis Rachid Salmi, Samy Suissa, Geneviève Chêne, Roger Salamon. Clinically informative measures of the effect of drugs or other interventions.: Measures of the effect of drugs. British Journal of Clinical Pharmacology, Wiley, 2008, 65 (6), pp.935-41. �10.1111/j.1365-2125.2008.03146.x�. �inserm-00211161�
Title Clinically informative measures of the effect of drugs or other interventions
Authors L. Rachid Salmi, Samy Suissa, Geneviève Chêne & Roger Salamon
Institutions Salmi, Chêne et Salamon: INSERM U593, Bordeaux, France; Université Victor Segalen Bordeaux 2, Institut de Santé publique, d’épidémiologie et de développement, Bordeaux, France; Centre Hospitalier Universitaire; Service d’Information Médicale, Bordeaux, France
Suissa: Division of Clinical Epidemiology, Royal Victoria Hospital; Department of Epidemiology and Biostatistics, McGill University, Montreal, Quebec, Canada.
Submitting and corresponding author
Prs. Salmi, ISPED, Université Victor Segalen Bordeaux 2, 146 rue Léo-Saignat, F-33076 Bordeaux cedex, France ; tel: +33 557 57 13 93; fax; +33 556 24 00 81; Mél:
rachid.salmi@isped.u-bordeaux2.fr
Running head Measures of the effect of drugs
Key words Randomized clinical trials; Cohort studies; Treatment outcome; Evaluation studies.
2676 words; 4 tables; no figure; one appendix. No competing interest.
What this paper adds?
What is already known about this subject?Several comparative measures (ratios, differences, or the number needed to treat) are used to express the effect of a drug or another intervention. These measures can vary in the way they are affected by the background risk measured from the reference group.
What this study adds?
This paper reviews the formulation, interpretation, and limitations of measures of effect. We describe a little-known parameter, the attained effect or clinical result ratio, a positive reformulation of the relative risk difference, and suggest how available parameters can be best use to summarize results of studies of effect of drugs.
Summary
Aim. Measures to compare two drugs are often affected by the background risk in the reference group; a ceiling effect results when the background risk is small. We review measures of effect of drugs, including a special formulation of the relative risk difference, the attained effect or clinical result ratio, that addresses background risk and ceiling effect. Methods. Existing measures are the risk and odds ratios, the absolute and relative risk differences, and the number needed to treat. The attained effect is defined as the observed gain in success (the difference of proportion of success between the two interventions), divided by the maximum attainable gain, the maximum proportion of success one can expect. We illustrate the relationship between these measures with published results of two meta-analyses.
Results. In studies of the effectiveness of cell salvage, the baseline risk ranged between 8 and 95% percent. This variability affected the risk difference and number needed to treat, while the attained effect, with a ceiling residual risk of 2%, showed that the gain in success
was half the maximum attainable gain. In studies of the effectiveness of therapy in patients infected by the human immunodeficiency virus, where the baseline risk was less variable, and there was no ceiling effect, the maximum attained effect indicated that the gain could be much smaller.
Conclusion. The attained effect, interpreted as the proportion of effectiveness that remains to gain for future interventions, can usefully complete the number needed to treat as a clinically informative effect measure.
Key-words: Randomized clinical trials; Cohort studies; Treatment outcome; Evaluation studies.
Introduction
Several comparative measures are used when assessing the effect of a drug or another form of intervention [1]. Whether the objective of the study is to assess the efficacy, the
individual effectiveness or the population effectiveness [2], these measures compare the rate or risk of an outcome of the disease in a group exposed to the new intervention to that in a comparison or reference group. The latter can be untreated, or receive a placebo or a reference intervention. These comparisons are usually based on the calculation of a ratio, a difference, or a more complex parameter, such as the number needed to treat [1, 3]. For example, in a paper on the efficacy of antiretroviral combination therapy [4], results were reported as odds ratios; in another paper on the effectiveness of cell salvage [5], results were reported as risk ratios. In both studies, several other measures of effect could easily be computed from results provided.
Often, existing measures are based on the analysis of failures. These measures, however, vary in the way they transform the same data on risk to reflect the usefulness of the new intervention. The resulting measure can convey information on the association between intervention and outcome (measure of association), or on its potential impact on the
population (measure of impact). These measures can also vary in the way they are affected by the background risk measured from the reference group. A related issue is that of the ceiling effect, by which the potential gain in effect cannot be as large in absolute terms for a treatment when the background risk is small than when it is large.
In this paper, we review the formulation, interpretation, and limitations of measures of effect based on risk reduction. Following the work of Babbs [6], we propose the attained effect or clinical result ratio, a more positive perspective in expressing the effect. This parameter is based on success, and addresses the issues of background risk and ceiling
effect. We submit that the attained effect, a reformulation of the relative risk difference, may provide a useful complement to existing measures.
Methods
Background and notations
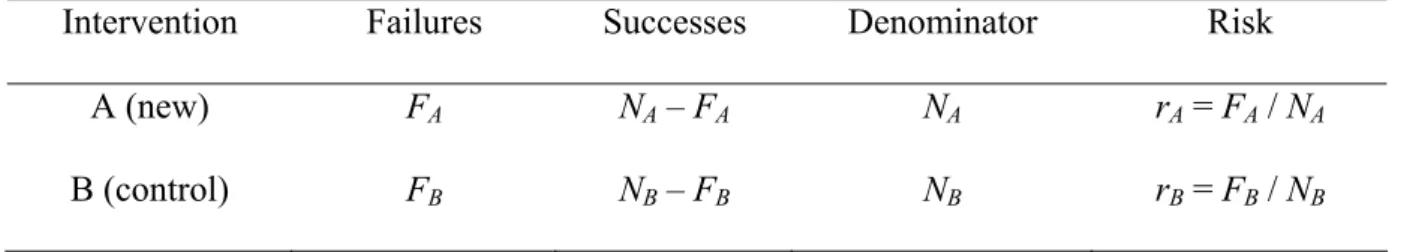
Consider a randomized controlled trial or cohort study designed to compare the risk of a given unwanted outcome under a new intervention A with that of a reference intervention B (Table 1). For simplicity, we assume that the time of follow-up is equal and complete for all patients in both groups, so that the risk is simply a proportion. Let rB be the proportion
of patients in group B who progress, during the time of follow-up, to the outcome,
hereafter referred to as failures, and rA the observed proportion of failures in group A; rB is usually referred to as the background risk. The complementary proportions of patients who did not progress to the outcome, hereafter referred to as successes, are sB = 1 - rB BB in group
B, and sA = 1 – rA in group A. We assume further that A is truly better than or equal to B. Under this assumption, and because rB, rB A, sB, and sB A are proportions, 0 ≤ sBB≤ sA ≤ 1, and 1
≥ rBB≥ rA≥0.
Commonly used measures of effect
The existing measures of effect are either measures of association between the intervention and the risk of failure, or measures of impact of the intervention on risk. All measures are based on comparisons of rA and rB. For each measure, we provide in Table 2 the formula of the parameter, its interpretation, and its possible values under the above-mentioned
assumptions. The variances of the estimators are provided in the Appendix.
B
Two existing measures of association are the risk ratio (RR) and the odds ratio (OR). These measures of effect reflect the strength of the association between type of treatment and risk
of failure (RR) or odds of failure (OR). Measuring the strength of association might be useful in assessing the causal relationship between the intervention and the observed effect [7]. The OR is often abusively considered as an estimator of the population RR, but will be further away from the null hypothesis value of 1 whenever the background risk is above 10%.
The absolute risk difference (ARD) is a measure of the absolute impact of the new treatment on the risk of failure during the time of follow-up. The ARD will vary with the baseline risk, depending on the choice of the reference intervention and the targeted population. To take into account the background risk, the impact can be measured as a relative risk difference (RRD). It is a measure of the relative impact of the new intervention on the risk of failure. For a given effect, the RRD is usually constant across populations with different background risks. Although formally negative, both the ARD and RRD are often expressed positively; they are then referred as absolute and relative risk reductions [8].
The number needed to treat (NNT) was proposed as a more direct way to convey to
clinicians the magnitude of impact of a treatment [3]. The NNT, which is the inverse of the absolute value of the ARD, is a measure of the average number of patients who would have to receive treatment A to prevent one failure in that group, compared to the number of failures prevented in group B during the time of followup. For example, if the ARD is 0.25, then the NNT is 1/0.25 = 4. The NNT varies with the baseline risk, and its
interpretation is only correct if A is actually better than B.
Measures of attained effect
Our initial objectives in seeking a new measure of effect were to focus on successes rather than failures, and to take into account the ceiling effect. This effect is related to the fact that, in some circumstances, proportions of successes cannot reach 1, and will be limited
by a ceiling, st, defined as the maximum proportion of successes that one can expect, given the characteristics of the population targeted by the intervention or the nature of the
outcome. This ceiling, st, defined by Babbs [6] as the “clinically optimal or ideal
outcome”, can vary from sB (no expected gain in effect) to 1 (all failures are expected, at least theoretically, to be avoidable). The gain in success of a treatment, consequently, is limited by the maximum attainable gain in success, i.e., the distance between s
B
BB and st.
Thus, an ideal measure of effect should take the ceiling effect in consideration, and compare the observed gain in success to this maximum attainable gain.
Consequently, we suggest the term “attained effect” (AE) to describe the parameter first defined as the “clinical result ratio” by Babbs [6] as (sA –sB)/(sB t –sBB). It is equal to the
(observed) absolute gain in success, or absolute success difference, divided by the
maximum attainable gain in success. In the best expected circumstances, where st = 1, the maximum AE (MAE) is (sA –sB)/(1B –sBB); its numerator is equal to 1 - ARD, and its
denominator to rB. In that special case, the MAE is simply the positive formulation of the RRD; it is also equal to the complement to 1 of the RR. Whatever is the value set for s
B
t, the range of the AE, 0 to 1, is a direct reflection of the direction and size of the effect. The AE can be expressed as a percentage, and is interpreted as the proportion of possible gain in success attained by the new intervention.
Illustration
To illustrate the interpretation and relationship between measures of effectiveness, we used data from studies included in the above-mentioned meta-analyses [4, 5]. These data were extracted from published randomized controlled trials of the effectiveness of cell salvage to minimize peri-operative blood transfusion in orthopaedic patients (Table 3) [5], or
comparing the effect of dual and triple therapy on progression of acquired
immunodeficiency syndrome or death in human immunodeficiency virus-infected patients (Table 4) [4].
Results
In Table 3, we assumed st could not be 1, because a small proportion of patients (2 percent) would always have abundant bleeding such that blood transfusion could not be avoided. With variations in the baseline risk of transfusion ranging between 8% and 95%, the possible gain by the evaluated treatment differed markedly from one study to the other. Indeed, there is little room for improvement with an 8% transfusion rate, while the possibilities of improvement are huge with the 95% transfusion rate. This variability is particularly reflected in the ARD and the NTT. On the other hand, the RR, the only measure reported in the meta-analysis [5] despite its lack of relevance, RRD, and AE were less affected by this variability. Moreover, the AE expresses in the simplest form the strong effectiveness of the assessed treatment. It indicates that the gain in successes, ranging from 52 to 92%, was at least half of the maximum attainable gain. Furthermore, the MAE, which should not be reported given the existence of a ceiling, was smaller than the AE in all studies, and could even be quite different in studies where the background risk was small. In Table 4, we assumed that st could be 1, as suggested by the results of one study.
Consequently, only the MAE needed to be reported. The variation in the baseline risk was less important in this group of trials (3 to 37.5%), and the possible gain by the evaluated treatment was consequently more stable. The MAE indicates that the gain in successes was, except for one study, less than half of the maximum attainable gain, i.e. that there is still much room for improvement.
Discussion
The formal definition of parameters and their variable sensitivity to ceiling and background risk illustrates that the choice to report a parameter rather than another should always be justified. For instance, although both the RR and OR can be easily calculated from the same 2-by-2 table, they are usually not considered informative when the focus is on positive effects of drugs, discussed in this paper. Their contribution to the assessment of causality is useful only when assessing negative effects of drugs in
pharmaco-epidemiology studies; the choice of the parameter, in such circumstances, depends on the study design (RR for cohort studies and randomized controlled trials, OR for case-control studies).
The choice between an absolute (ARD and NNT) or a relative measure of impact (RRD and AE) is more difficult as both report important information. Both the ARD and the NNT are useful as they provide an estimation of how many events can be avoided by the application of the new treatment, but have different advantages. The NNT has been proposed as a more clinically-oriented expression of the absolute impact, but the ARD is simpler to compute. Moreover, the interpretation of the NNT as a measure of effectiveness might be
counterintuitive to readers still unfamiliar with the concept, as its value is the highest when the effectiveness is the smallest. We believe, however, that the increased use of the NNT will eventually result in the dereliction of the ARD.
The RRD, AE and MAE can be adequately used to convey the relative impact of the new treatment. Thus, they can be used to compare the impact of treatments used for different diseases with different background risks. The MAE can be seen merely as a reformulation of the RRD. We believe, however, that the MAE, and the AE, carries some advantages over existing parameters. Firstly, the expression of results, as positive numbers, is the direct result of the definition of the estimator. Indeed, although the ARD and RRD are usually
expressed positively, as absolute and relative risk reductions, they are really negative values. For example, the RRD = - 0.78 in the study by Ayers et al. (Table 3) would be reported as a 78 percent reduction of the risk. From a mathematical point of view, this is worrisome, as both the ARD and RRD can be positive, for instance in randomized clinical trials or cohort studies with a two-sided null hypothesis, and results in favour of the reference intervention. This misconception of the mathematical meaning of the ARD and RRD is reflected, for instance, in some definitions of ARD, RRD and NNT—see for instance appendix 1 in [8], where the absolute risk reduction and the NNT would be negative, and the relative risk reduction is defined by two formulas, one positive and one negative.
Formally, a mathematical and statistical approach virtually similar to the AE has first been published by Babbs [6]. In his paper, Babbs proposed the use of the “clinical result ratio”, which is identical to the AE, and demonstrated how this parameter can be applied both to continuous and categorical outcomes, and integrated in a meta-analysis of randomized controlled trials. However, our paper goes beyond the original approach by Babbs by comparing the different risk measures and the relative strength and weaknesses of these alternative measures of treatment effects. Furthermore, we believe our proposed
terminology of attained effect is a better reflection of what the AE (or clinical result ratio) does reveal, i.e. the proportion of possible gain in success attained by the new intervention. From the users’ perspective, we believe the AE shares the advantage of the NNT of directly reflecting the potential benefit of the intervention for targeted individuals. It also shares the advantage of the RRD, when the latter is presented as a relative risk reduction, of having the range of a simple proportion, which can be less misleading than the ranges of the RR (a logarithmic scale), or of the ARD or NNT (ranges affected by the baseline risk). Compared with the relative risk reduction, however, the AE is based on success rather than risk, which
can be a more positive way to present the potential benefit, at least for some patients and health professionals.
The possibility to calculate a measure of potential benefit in circumstances where the maximum expected proportion of successes is limited provides a more generic measure of the effect of an intervention. Indeed, a ceiling of one can seem reasonable, at least
theoretically, in many studies, but becomes questionable when the individuals included have characteristics incompatible with a one hundred percent success or when the follow-up is long and the failures of interest include outcomes such as death. For example, studies of the effectiveness of trauma care will always be limited by the fact that up to two-thirds of prehospital deaths are not preventable [9]; in long-term follow-ups of patients treated for acquired immunodeficiency syndrome, the proportion of successes cannot be one hundred percent, given the high frequency of severe side effects [10]. In such context, one could compare two interventions and choose that with the highest MAE, or, if MAEs are the same, that with the least side effects. Finally, for researchers and decision-makers, we believe that providing an effectiveness result as a proportion—or percentage—of the maximum attainable effectiveness is a good reflection, not only of the gain in
effectiveness, but also of what remains to gain for future interventions.
One major difficulty in using the AE, however, is to justify and estimate the ceiling. In his paper [6], Babbs proposed that, for binary outcomes, the ceiling could be set to 1, or 100% successes, in most circumstances. Whenever success is measured by survival, but a 100% survival is not realistic, the ceiling could be the predicted survival of healthy persons over the same time period [6]. Estimations of the ceiling can also be provided, whenever possible, by large cohort studies of the natural history of the disease, or by pooling estimates of background risks in previously published meta-analyses. However, Babbs suggested in his paper’s discussion [6] that there could be abuse in the choice of the ceiling
value, as there is some latitude in deciding what the ideal response would be. Changes in dichotomous variables to 100% survival are often obvious choices, and any other value should always be clearly justified, so that readers would be able to judge and dispute the rational of the chosen ceiling [6]. Other points are that the ceiling is always estimated with a degree of uncertainty, and that the difference between the AE and the MAE, and therefore the RRD, will be small whenever the background risk is large, as illustrated in our first example. Consequently, estimations of the AE and related parameters should always be provided with confidence intervals, and the resulting conclusions submitted to robustness analyses.
Although the focus was on simple proportions, this review of effectiveness measures applies to all comparisons of parameters with a ceiling effect. The AE, therefore, might be an appropriate measure in cohort studies of protective factors [11], where cumulative incidences are compared, and in randomized trials with product-limit estimations of survival or event-free rates [1]. In conclusion, the AE is not meant to replace existing measures of effectiveness, nor is it formally different from the clinical result ratio proposed by Babbs [6]. It should be seen merely as a new formulation of existing ways to report results of randomized clinical trials and cohort studies. Nevertheless, we believe that all studies reporting drug effects could be limited to the NNT and either the RRD or AE, depending on the existence of a ceiling effect. An appropriate use of these parameters may improve our ability to take wise decisions regarding new drugs or other interventions.
Acknowledgements
Samy Suissa is the recipient of a Distinguished Investigator award from the Canadian Institutes of Health Research (CIHR).
References
[1] Meier P. Statistical analysis of clinical trials. In: Shapiro SH, Louis TA, eds. Clinical trials. Issued and approaches. New York, NY: Marcel Dekker, 1983: 155-89.
[2] Muñoz A, Gange SJ, Jacobson LP. Distinguishing efficacy, individual effectiveness and population effectiveness of therapies. AIDS 2000; 14: 754-6.
[3] Laupacis A, Sackett DL, Roberts RS. An assessment of clinically useful measures of the consequences of treatment. N Engl J Med 1988; 318: 1728-33.
[4] Yazdanpanah Y, Sissoko D, Egger M, Mouton Y, Zwahlen M, Chêne G. Clinical efficacy of antiretroviral combination therapy based on protease inhibitors or non-nucleoside analogue reverse transcriptase inhibitors: indirect comparison of controlled trials. BMJ 2004; 328: 249-55.
[5] Huët C, Salmi LR, Fergusson D, Koopman-van Gemert MM, Rubens F, Laupacis A, for the International Study of Perioperative Transfusion (ISPOT) investigators. meta-analysis of the effectiveness of cell salvage to minimize peri-operative allogenic blood transfusion in cardiac and orthopaedic surgery. Anesth Analg 1999; 89: 861-9.
[6] Babbs CF. Meta-analysis of 2-treatment clinical trials including both continuous and dichotomous results. Med Decis Making 2004; 24; 299-312.
[7] Rothman KJ, Greenland S, eds. Modern epidemiology. 2nd ed. Philadelphia, PA: Lippincott, Williams & Wilkins, 1998.
[8] Barratt A, Wyer PC, Hatala R, McGinn T, Dans AL, Keitz S, Moyer V, For GG, Evidence-Based Medicine Teaching Tips Working Group.Tips for learners of evidence-based medicine: 1. Relative risk reduction, absolute risk reduction and number needed to treat. Can Med Assoc J 2004; 171: 353-8.
[9] Coats TJ, Davies G. Prehospital care for road traffic casualties. BMJ 2002; 234: 1135-8.
[10] Weller IVD, Williams IG. ABC of AIDS: Antiretroviral drugs. BMJ 2001; 322: 1410-2.
[11] Rochon PA, Gurwitz JH, Sykora K, Mamdani M, Streiner DL, Garfinkel S, Normand SL, Anderson GM. Reader's guide to critical appraisal of cohort studies: 1. Role and design. BMJ 2005; 330: 895-8.
Appendix: Variances of effect parameters
Let X and Y two independent random variables with
μ
X =E( X), andσ
X2 =Var(X)) (Y E Y =
μ
, ; 2 Var(Y) Y =σ
for a given function f(X,Y), 2
2 2 2 ) , ( ) , ( )) , ( ( X Y Y X Y X y f x f Y X f Var
σ
δ
μ
μ
δ
σ
δ
μ
μ
δ
⎟⎟⎠ ⎞ ⎜⎜⎝ ⎛ + ⎟ ⎠ ⎞ ⎜ ⎝ ⎛ ≅ .In our case, where
μ
ˆX =rA,μ
ˆY =rB,A A A X N r r (1 ) ˆ2 − = σ , and B B B Y N r r (1 ) ˆ2 − = σ , the functions and resulting variances are:
1) for the RR f(X,Y)= X /Y; 4 2 2 2 2 Y Y X Y X Y X Var
μ
σ
μ
μ
σ
+ = ⎟ ⎠ ⎞ ⎜ ⎝ ⎛ ; 2) for the OR ) 1 ( ) 1 ( ) , ( X Y Y X Y X f −− = ; 2 4 2 2 2 4 2 2 ) 1 ( ) 1 ( ) 1 ( ) 1 ( ) 1 ( Y Y X X X X Y Y X Y Y X Varσ
μ
μ
μ
σ
μ
μ
−−μ
+ − = ⎟⎟⎠ ⎞ ⎜⎜⎝ ⎛ −− ;3) for the ARD f(X,Y)=X −Y ; ( ) 2 2;
Y X Y X Var − =
σ
+σ
4) for the RRD Y Y X Y X f( , )= − ; 4 2 2 2 2 Y Y X Y X Y X Var Y Y X Varμ
σ
μ
μ
σ
+ = ⎟ ⎠ ⎞ ⎜ ⎝ ⎛ = ⎟ ⎠ ⎞ ⎜ ⎝ ⎛ − ; 5) for the NNT Y X Y X f − = 1 ) , ( ;(
)
2 2 2 1 Y X Y X Y X Var μ μσ − σ + = ⎟ ⎠ ⎞ ⎜ ⎝ ⎛ − ; and 6) for the AE Y k Y X Y X f +− = ) , ( ; 4 2 2 2 2 ) ( ) ( ) ( Y Y X Y X k k k Y k Y X Varσ
μ
μ
μ
σ
+ + + + = ⎟ ⎠ ⎞ ⎜ ⎝ ⎛ +− .TABLE 1. Typical display and notation for a randomized controlled trial with two interventions
Intervention Failures Successes Denominator Risk A (new) FA NA – FA NA rA = FA / NA B (control) FBB NB – FB BB NBB rB = FB BB / NBB
TABLE 2. Formulas and range of commonly used measures of effect, and the attained effects
Measure Abbreviation Estimatora Interpretation Estimate when effectiveness of A is
nil maximum
of association
Risk ratio RR rA/rB Reflects the strength of the association between intervention and outcome, might be useful for causality assessment, when risks can be directly estimated (in cohorts and trials); usually not useful for expressing the positive effect of drugs
1 0
Odds ratio OR (rAsB)/(sArB) Reflects the strength of the association between intervention and outcome; considered inadequate when risks can be directly estimated; not useful for expressing the positive effect of drugs
1 0
of impact
Absolute risk difference ARD rA – rB Reflects the absolute impact of the new intervention; more informative when
expressed as the number needed to treat (see below)
0 – rB
Relative risk difference RRD (rA – rB)/rB Reflects the relative impact of the new intervention; preferred parameter in the absence of a ceiling effect, especially when expressed as a percent relative risk reduction
0 – 1
Number needed to treat NNT 1/|rA – rB| Reflects the absolute impact of the new intervention, expressed as a number of patients to treat with the new intervention to avoid one failure above what the reference intervention does; preferred expression of the clinical usefulness of a drug
+ ∞ 1/rB
Attained effect AE (sA – sB)/(st – sB) Proportion of possible gain in success attained 0 1
by the new intervention; useful in the presence of a ceiling effect
Maximum attained effect MAE (sA – sB)/(1 – sB) Proportion of possible gain in success attained by the new intervention; equivalent to the RRD in the absence of ceiling effect
0 1
a
see Table I and text for notation and definitions.
TABLE 3. Data from randomized controlled trial of the effectiveness of cell salvage to minimize perioperative allogeneic transfusion in orthopedic surgery (Data extracted from figure 1 in [5]), and corresponding measures of effectiveness
Intervention group Control group Measure of effectivenessb
Studya Failure Total % Failure Total % RR ARD RRD NNT AE MAE
(FA) (NA) (rA × 1 00) (FB) (NB) (rB × 1 00) Majkowski et al. 7 20 35.0 19 20 95.0 0.37 -0.60 -0.63 1.7 0.65 0.63 Heddle et al. 10 40 25.0 27 41 65.9 0.38 -0.41 -0.62 2.4 0.64 0.62 Healy et al. 14 84 16.7 15 44 34.1 0.49 -0.17 -0.51 5.7 0.54 0.51 Riou et al. 1 25 4.0 2 25 8.0 0.50 -0.04 -0.50 25.0 0.67 0.50 Rosencher et al. 6 20 30.0 6 10 60.0 0.50 -0.30 -0.50 3.3 0.52 0.50 Ayers et al. 5 103 4.9 29 129 22.5 0.22 -0.18 -0.78 5.7 0.86 0.78 Newman et al. 3 35 8.6 28 35 80.0 0.11 -0.71 -0.89 1.4 0.92 0.89 a
See [5] for original references, definition of abbreviations, and final results of the meta-analysis; b Attained effect calculated assuming that the maximum attainable proportion of successes (st) would be 0.98; RR, Risk ratio; ARD, absolute risk difference; RRD, Relative risk difference; NNT, Number needed to treat; AE, Attained effect; MAE, Maximum attained effect.
TABLE 4. Data from randomized controlled trial of the effectiveness of triple therapy to decrease progression to acquired immunodeficiency syndrome and death in human immunodeficiency virus-infected patients (data extracted from figure 2 in [4]), and corresponding measures of effectiveness
Intervention group Control group Measure of effectivenessb
Studya Failure Total % Failure Total % RR ARD RRD NNT MAE
(FA) (NA) (rA × 1 00)
(FB) (NB) (rB × 1 00)
(=AE)
AIDS clinical trial group 229 3 98 3.1 6 100 6.0 0.51 -0.03 -0.49 34.0 0.49 AIDS clinical trial group 320 33 577 5.7 63 579 10.9 0.53 -0.05 -0.47 19.4 0.47 Merck 035 0 33 0.0 1 33 3.0 0.00 -0.03 -1.00 33.0 1.00 RTV Study Group. 119 543 21.9 205 547 37.5 0.58 -0.16 -0.42 6.4 0.42 Merck 039 11 108 8.3 16 105 15,2 0.55 -0.07 -0.45 14,5 0.45 Spanish Earth-1 1 33 3.0 1 33 3.0 1.00 -0.00 -0.00 + ∞ 0.00
PISCES 76 955 8.0 142 942 15.1 0.53 -0.07 -0.47 14.1 0.47
a
See [4] for original references, definition of study abbreviations and final results of the meta-analysis; b Attained effect (AE) calculated assuming that the maximum attainable proportion of successes (st) could be 1, i.e. AE = MAE; RR, Risk ratio; ARD, absolute risk difference; RRD, Relative risk difference; NNT, Number needed to treat; MAE, Maximum attained effect.
![TABLE 3. Data from randomized controlled trial of the effectiveness of cell salvage to minimize perioperative allogeneic transfusion in orthopedic surgery (Data extracted from figure 1 in [5]), and corresponding measures of effectiveness](https://thumb-eu.123doks.com/thumbv2/123doknet/14550599.536878/21.1262.123.1190.190.634/randomized-controlled-effectiveness-perioperative-allogeneic-transfusion-corresponding-effectiveness.webp)
![TABLE 4. Data from randomized controlled trial of the effectiveness of triple therapy to decrease progression to acquired immunodeficiency syndrome and death in human immunodeficiency virus-infected patients (data extracted from figure 2 in [4]), and corr](https://thumb-eu.123doks.com/thumbv2/123doknet/14550599.536878/22.1262.131.1149.230.689/randomized-controlled-effectiveness-decrease-progression-immunodeficiency-immunodeficiency-extracted.webp)
