HAL Id: insu-03251258
https://hal-insu.archives-ouvertes.fr/insu-03251258
Submitted on 7 Jun 2021
HAL is a multi-disciplinary open access
archive for the deposit and dissemination of
sci-entific research documents, whether they are
pub-lished or not. The documents may come from
teaching and research institutions in France or
abroad, or from public or private research centers.
L’archive ouverte pluridisciplinaire HAL, est
destinée au dépôt et à la diffusion de documents
scientifiques de niveau recherche, publiés ou non,
émanant des établissements d’enseignement et de
recherche français ou étrangers, des laboratoires
publics ou privés.
Copyright
Quantification of Gravitational Mass Wasting and
Controls on Submarine Scarp Morphology Along the
Roseau Fault, Lesser Antilles
Alex Hughes, Javier Escartin, Jean-arthur Olive, Jeremy Billant, Christine
Deplus, Nathalie Feuillet, Frédérique Leclerc, Luca Malatesta
To cite this version:
Alex Hughes, Javier Escartin, Jean-arthur Olive, Jeremy Billant, Christine Deplus, et al..
Quan-tification of Gravitational Mass Wasting and Controls on Submarine Scarp Morphology Along the
Roseau Fault, Lesser Antilles. Journal of Geophysical Research: Earth Surface, American
Geophysi-cal Union/Wiley, 2021, 126 (4), �10.1029/2020JF005892�. �insu-03251258�
1. Introduction
Understanding how tectonics and erosion shape the landscape is fundamental to infer deformation from geomorphic observables (e.g., Crosby & Whipple, 2006; Kirby & Whipple, 2012; Wobus et al., 2006). This is well-documented in extensional settings where slip on normal faults uplifts the surface, which is simultane-ously or subsequently reworked by various erosive and sediment transport processes (e.g., Ellis et al., 1999; Jackson & White, 1989; Leeder & Gawthorpe, 1987). In terrestrial environments, first-order relationships that describe the changing morphology of the scarp during scarp growth have long been established (e.g., Wallace, 1977, 1978). Terrestrial scarp morphology is controlled by factors such as fluvio-glacial erosion (Sanchez et al., 2010; Tucker et al., 2011), hillslope diffusion (Pelletier et al., 2006; Petit & Mouthereau, 2012; Tucker et al., 2020), and landslides (Densmore et al., 1997, 1998). These different factors are routinely pa-rameterized and incorporated into landscape evolution models that can be used to infer tectonic parameters such as scarp age and fault slip rate (Avouac, 1993; Petit et al., 2009; Phillips et al., 2003; Tucker et al., 2011). For submarine environments, the factors that control scarp morphology are not well quantified because of a paucity of data that results from the challenging nature of collecting high-resolution (<2 m/pixel) ba-thymetric data from the seafloor. Collecting rock samples from the seafloor is also challenging and sparse sampling often hinders the construction of a high-resolution geochronology that can be used to constrain rates of tectonic or erosion processes. As a result, there are few data sets on fundamental metrics such as submarine scarp morphology (Armijo et al., 2005; Escartín et al., 2016; Hilley et al., 2020) and erosion rates (Marlow et al., 2000; Mitchell et al., 2003). Several factors that lead to continuous degradation of subaerial fault scarps, such as climatic weathering (e.g., freeze-thaw), rain splash, or overland flow do not
Abstract
Due to challenges involved in mapping the seafloor at high-resolution (e.g., <2 m), data are lacking to understand processes that control the evolution of submarine normal fault scarps, which cover large parts of the global seafloor. Here, we use data from autonomous deep-sea vehicles to quantify local erosion and deposition associated with a pronounced tectonic surface scarp formed by slip on the submarine Roseau normal fault (Lesser Antilles). We use high-resolution video imagery, photomosaics, and high-resolution bathymetric data (0.1–10 m/pixel) to identify active erosional features on the scarp including channels, steep gullies, small scarps, and debris cones. We compare volumes of erosion and deposition and find that under certain depositional conditions, debris cones effectively record the erosion signal of mass wasting from the footwall with a ratio of hanging wall deposition to footwall erosion of 0.80. We use eroded volumes to estimate earthquake-induced landslide erosion rates for the Roseau fault of 14–46 m Myr−1. Assuming mass wasting of the Roseau fault scarp is mostly coseismic, the erosion ratesfor the Roseau fault imply that submarine earthquake induced mass-wasting can occur at similar rates to various terrestrial lithological and tectonic settings. We present a process-based model of submarine scarp degradation via retrogressive erosion in basement lithology where scarps have a gravitational stability threshold height of 20–40 m and a long-term average slope of 30°–40°. More generally, the results presented here may be applicable to develop models of submarine landscape evolution based on degradation of normal fault scarps on the seafloor.
© 2021. American Geophysical Union. All Rights Reserved.
Roseau Fault, Lesser Antilles
Alex Hughes1 , Javier Escartín1,2 , Jean-Arthur Olive2 , Jeremy Billant3,
Christine Deplus1, Nathalie Feuillet2, Frédérique Leclerc3 , and Luca Malatesta4
1Institut de physique du globe de Paris, CNRS, Université de Paris, Paris, France, 2Laboratoire de Géologie, Ecole Normale Supérieure (CNRS UMR, ), PSL Research University, Paris 8538, France, 3Université Côte d'Azur, CNRS, Observatoire de la Côte d'Azur, IRD, Valbonne, France, 4GFZ German Research Center for Geosciences, Potsdam, Germany
Key Points:
• Comprehensive documentation of erosion and deposition along an active submarine normal fault scarp from the meter to submeter-scale • Submarine erosion via
earthquake-induced mass wasting may occur at similar rates to a variety of subaerial settings
• Process-based model for submarine scarp evolution with a threshold stability height of 20–40 m and a long-term average slope of 30°–40°
Supporting Information:
Supporting Information may be found in the online version of this article.
Correspondence to:
A. Hughes,
Hughes@ipgp.fr
Citation:
Hughes, A., Escartín, J., Olive, J.-A., Billant, J., Deplus, C., Feuillet, N., et al. (2021). Quantification of gravitational mass wasting and controls on submarine scarp morphology along the Roseau fault, Lesser Antilles. Journal of Geophysical Research: Earth Surface, 126, e2020JF005892. https://doi. org/10.1029/2020JF005892
Received 17 SEP 2020 Accepted 29 DEC 2020
Journal of Geophysical Research: Earth Surface
affect submarine fault scarps. Therefore, previous submarine erosion rates indicate that submarine erosion occurs either at slower rates than in subaerial settings (Marlow et al., 2000) or at rates similar to slowly eroding subaerial lowlands (Mitchell et al., 2003). The recent application of unmanned deep-sea vehicles, equipped with advanced acoustic and optical imaging technology, has provided researchers with the means to conduct bathymetric surveys at meter-scale resolutions. High-resolution bathymetric data sets are the key starting point from which to quantify parameters such as submarine erosion rates and to understand how tectonics, lithology, and erosion influence the evolution of submarine normal fault scarps. Quantifica-tion of the various parameters that control submarine normal fault scarp development is important because normal faults control topographic development for a large part of the global seafloor on abyssal plains. Mass wasting is thought to be a key mechanism for erosion in submarine landscapes. A large body of work has focused on the mechanisms of submarine mass wasting and landslides in sediments on continental slopes (Coleman & Prior, 1988; Contreras-Reyes et al., 2016; Katz et al., 2015; Leynaud et al., 2009; Migeon et al., 2011; Mitchell, 2005; Mosher et al., 2004), in rift settings (Bilal et al., 2018; Elliott et al., 2012; Hen-stra et al., 2016; McLeod & Underhill, 1999; Stewart & Reeds, 2003), and in lacustrine settings (Moernaut et al., 2014; Strasser et al., 2006; Van Daele et al., 2015). At mid-ocean ridges, topographic development is mainly controlled by normal faults that expose basalt, gabbro, or ultramafic rocks on their footwall (Mitch-ell et al., 2000; Searle & Escartín, 2004) and submarine landslides or debris flows have been mapped at var-ious scales from kilometers to the submeter scale (Cannat et al., 2013; Goff & Tucholke, 1997; McAllister & Cann, 1996; Tucholke, 1992; Tucholke et al., 1997). However, the role of surface processes, especially mass wasting, in the evolution of abyssal topography is poorly quantified. Few researchers (Cannat et al., 2013; Mitchell et al., 2000; Olive et al., 2019) have attempted to (1) quantitatively relate mass wasting and seismic activity at the scale of an individual submarine fault and (2) characterize the role of long-term fault slip rate, exposed lithology, chemical alteration, or magnitude-frequency distribution of earthquakes in the evolution of submarine fault scarp morphology. Consequently, we lack data on basic processes of erosion and deposi-tion for a large pordeposi-tion of the global seafloor.
High-resolution bathymetric data have previously been used to study the fine morphology of active sub-marine fault scarps (e.g., Hilley et al., 2020), with some studies aiming to map the extent of recent co-seismic ruptures (Armijo et al., 2005; Escartín et al., 2016). A link between footwall scarp degradation and fault growth has been suggested in rift-related sediments, whereby fault throw is thought to be the primary control on the size of erosional catchments in normal fault footwalls (Elliott et al., 2012). On trans-form faults in the Gulf of California, sediment fans and corresponding erosional features were identified in high-resolution bathymetric data and were interpreted to have formed synchronously during seismic shak-ing (Hilley et al., 2020). Furthermore, features such as rockslides (Cannat et al., 2013) and debris cones (Es-cartín et al., 2016) have previously been identified at the base of active submarine normal faults in volcanic bedrock. While these studies identified mass-wasted depositional features near the scarp, the precise link between mass wasting and scarp morphology on the scale of an individual submarine fault scarp remains understudied, especially in volcanic bedrock.
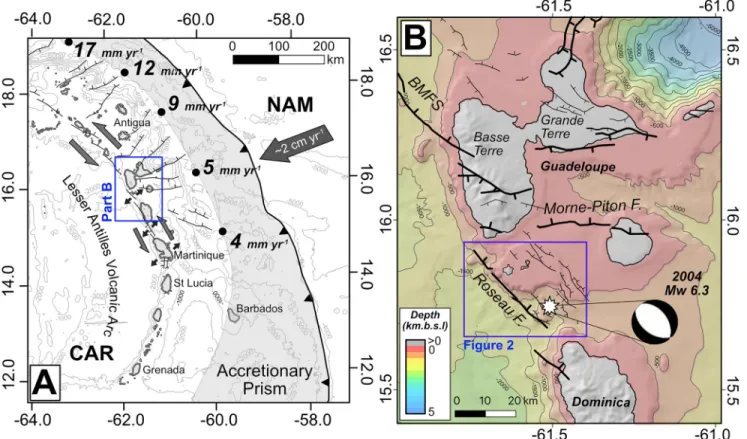
In this work, we use multiple high-resolution bathymetric and video-imagery data sets collected using un-derwater vehicles to describe the meter-scale morphology of a pronounced scarp associated with the Rose-au normal fRose-ault in the Lesser Antilles volcanic arc (Figure 1). The Roseau fault flanks Les Saintes Islands (Figure 1) to the southwest. The fault is active and was the source of the 2004 Mw 6.3 Les Saintes earthquake
(e.g., Bazin et al., 2010; Feuillet et al., 2011) that exhumed a ∼1 m high coseismic band of fresh scarp (Es-cartin et al., 2016). A largely volcanic sequence is uplifting along the 160 m high (cumulative) Roseau fault scarp. The Roseau fault scarp dips to the N–NE and in the opposite direction to the regional slope, which deepens to the S–SW away from Les Saintes islands (Figure 2). These combined arguments make the Roseau fault scarp an excellent location to study small-scale mass wasting of submarine volcanic bedrock. Here, we quantify along-strike variations in the height, slope, and erosion of the scarp and assess the extent and vol-umes of a series of footwall catchments and associated debris cones to track spatial patterns of erosion and deposition. The detailed characterization of mass redistribution on an active submarine fault scarp informs our understanding of mass wasting processes and their impact on tectonic seascapes.
1.1. Tectonic Setting and Morphology of the Roseau Fault System
Oblique, NE–SW directed plate convergence at rates of ∼2 cm yr−1 causes subduction of the North
Amer-ican and South AmerAmer-ican plates beneath the Caribbean plate and is responsible for the formation of the Lesser Antilles volcanic arc (Figure 1a; Deng & Sykes, 1995; Feuillet et al., 2002, 2011; Jordan, 1975; Weber et al., 2001). Left-lateral transtensional deformation along the inner arc is partially accommodated by a right-stepping series of trench-parallel, en-échelon, oblique faults that generally trend between 130 and 160 degrees (Figure 1b; Feuillet et al., 2010, 2011). One such fault is the Roseau normal fault, which was the source of the damaging 2004 Mw 6.3 Les Saintes earthquake and associated tsunami (Figure 1b; Bazin
et al., 2010; Escartín et al., 2016; Feuillet et al., 2011; Le Friant et al., 2008; Salichon et al., 2009).
The ∼40 km long Roseau fault system forms the western boundary of the Les Saintes graben (Figure 2a). The Roseau fault system dips northeast and trends N140°E, crosscutting the seafloor along the southwest flank of the shallow Les Saintes reef plateau and the deeper Les Saintes Channel (Figure 2). The Roseau fault system has five individual segments (Sec Pâté, Canyon, Roseau, Le Havre, and Colibri), with pronounced scarps at the seafloor (Leclerc et al., 2016). The Canyon segment runs parallel to the southwestern edge of the Les Saintes reef plateau (Figure 2) and has a semi-continuous surface trace because the scarp is totally eroded within the main canyons carved into the western slope of the reef plateau (Leclerc et al., 2016). The left-stepping Le Havre and Colibri segments mostly uplift volcanic deposits on the southern flank of the Roseau volcano (Figure 2). For both segments, deformation is distributed among multiple scarps that vary in length from 100 m up to ∼2 km and reach heights approaching ∼100 m.
Figure 1. Tectonic and geographic setting of Les Saintes. Solid black lines are faults. (a) Tectonic setting of the Lesser Antilles volcanic arc adapted from
Feuillet et al. (2011). The large arrow represents 2 cm yr−1 plate convergence between the North American plate (NAM) and the Caribbean plate (CAR)
(DeMets et al., 2000; Dixon et al., 1998). Smaller gray arrows denote trench parallel shear which increases in magnitude north-westward (black dots and numbers) (López et al., 2006). Small black arrows denote extension. The light gray shaded area shows the extent of the accretionary prism. (b) Tectonic setting of Les Saintes and the Roseau fault adapted from Leclerc et al. (2016). Bathymetry is from the GEBCO grid (Weatherall et al., 2015). The white star and the beachball show the location and sense of slip for the 2004 Mw 6.3 Les Saintes earthquake (Bazin et al., 2010; Feuillet et al., 2011). BMFS: Bouillante-Montserrat Fault System, k.m.b.s.l = kilometers below sea level.
Journal of Geophysical Research: Earth Surface
The surface expression of the Roseau segment generally has a simple plan view morphology where defor-mation is focused on single fault strands with moderate scarp dip of around 30°–50° (Leclerc et al., 2016). In places, relay zones are formed by the overlapping sections at the ends of individual, left-stepping, en-ech-elon fault strands (Figure 3) and seismicity data indicate that the individual strands join to form a single fault plane at depth (Bazin et al., 2010). Along the Roseau segment, footwall erosion has incised a series of gullies and catchments in the highest sections of the footwall scarp, with debris cones forming at the mouth of individual gullies (Escartín et al., 2016).
Along the eastern side of the Les Saintes graben, west-dipping antithetic faults including the Souffleur, Redonde, and Rodrigues faults reach lengths up to 10 km and have maximum reliefs of ∼150 m (Figure 2) (Leclerc et al., 2016). The Souffleur fault has a complex surface morphology with multiple steep lenses, slumps, and relays (Figure 2), which can approach slopes of 90° (Leclerc et al., 2016).
10.1029/2020JF005892
Figure 2. (a) Map of faults and volcanoes in the Les Saintes channel. Bathymetry data and shaded relief map are from the 10 m/pixel digital terrain model
(DTM) (Leclerc et al., 2016). Normal fault traces (solid black lines) after Leclerc et al. (2016). Faults with the highest scarps are in bold and faults with thinner lines have lower scarp heights. The thin blue lines are the regional turbiditic channel network extracted from the 10 m/pixel DTM using TopoToolbox (Schwanghart & Scherler, 2014). The orange arrow shows the facing direction of B. (b) Three-dimensional block model showing sediment ponding in the Roseau trough due to uplift of the Roseau fault scarp (after Leclerc et al., 2016). Black triangles and white arrows show sediment transport directions.
2. Data Sets
To document the decameter to submeter scale morphology of the Roseau fault and understand the extent to which mass-wasting processes control submarine scarp morphology, we conducted a comprehensive series of near-bottom high-resolution geophysical surveys at multiple scales (Figure 4). The main bathymetric and photographic data sets analyzed for this study were collected during the 2017 SUBSAINTES cruise (PI: J. Escartin, 2017; https://doi.org/10.17600/17001000) onboard the research vessel L'Atalante. We collected near-bottom high-resolution bathymetry data using the autonomous underwater vehicle (AUV) Asterx
(IF-REMER, France) and we collected rock samples, still electronic images, and high-resolution video imagery using the remotely operated vehicle (ROV) Victor6000 (IFREMER, France). Data from the SUBSAINTES cruise were supplemented by previous shipboard multibeam bathymetric data obtained during the 2010 BATHYSAINTES cruise (PI: C. Deplus, 2010; https://doi.org/10.17600/10030020) conducted onboard the research vessel Pourquoi pas?. In 2013, the ODEMAR cruise (PI: Escartin and Andreani, 2013; https://doi. org/10.17600/13030070, research vessel: Pourquoi pas?) acquired high-resolution bathymetry and seafloor imagery with the AUV Abyss (GEOMAR, Germany) and ROV Victor6000. Additional details on these differ-ent data sets and their processing are provided in the supplemdiffer-entary material (Table S1).
Figure 3. Surface morphology of the Roseau fault system. Figure located in Figure 2. (a) Shaded relief map of the Roseau fault system. (b) Same map as A with interpretation and the locations of areas A, B, and C referred to in the text (green boxes). (c) Backscatter map of the same area as part A showing the distribution of low reflectivity seafloor that we interpret to be sediments. We interpret dark, high-reflectivity seafloor to indicate volcanic basement, steep slopes, or rough seafloor resulting from either debris cones, rippled sediments, or scours from regional turbidity flows (Leclerc et al., 2016). (d) Same image as C with interpretation.
Journal of Geophysical Research: Earth Surface
2.1. High-Resolution Bathymetry
We used various bathymetric data sets to investigate scarp morphology across the Les Saintes graben (Fig-ure 4). A 10 m/pixel digital terrain model (DTM) and a backscatter map (Figure 3c) were gridded from shipboard multibeam bathymetric data acquired during the BATHYSAINTES cruise (see details in Leclerc et al., 2014, 2016). We used the 10 m/pixel data to provide continuous bathymetric coverage across the Les Saintes graben (Figure 2). During the 2013 ODEMAR cruise, AUV multibeam bathymetric data was acquired covering ∼10 km2 of the Roseau segment and gridded at 2 m/pixel (Figure 4). Complementing the
AUV surveys, during the ODEMAR cruise, an ROV was used to collect multibeam bathymetric data closer to the seafloor along sections of the Roseau fault and bathymetric data was gridded at 50 and 10 cm/pixel (Figure 4) (see details in Escartín et al., 2016).
10.1029/2020JF005892
Figure 4. Data sets used to characterize the surface morphology of the western edge of Les Saintes graben. The extent
of high-resolution bathymetry data is shown with the colored polygons overlain above a shaded relief map from the 10 m/pixel digital terrain model. The location of rock samples collected using a remotely operated vehicle (ROV) are shown with the colored circles. Inset (a) and part (b) Close up views showing the extent of bathymetry data gridded at 50 cm/pixel (part B) and 10 cm/pixel (inset A). ROV tracks are indicated with purple lines.
To improve the coverage of the existing bathymetry data, we conducted ROV and AUV surveys during the SUBSAINTES cruise, the latter at ∼70 m above the seafloor using a Kongsberg Reson SMF EM2040 multibeam system. After processing, we gridded the SUBSAINTES AUV data at 1 m/pixel to produce very high-resolution DTMs covering an area of ∼100 km2 across multiple faults within the Les Saintes graben
(Figure 4).
2.2. Three-Dimensional Terrain Models From Video Imagery
We collected video imagery at multiple locations along strike using the ROV's high-definition video camera during the SUBSAINTES cruise (ROV tracks are shown in Figure 4b). We processed this imagery to obtain three-dimensional terrain models at more than 40 locations across the Les Saintes graben (Figures 4b and S1). The imagery was corrected to improve the illumination, equalization, and color shift and we employed structure from motion techniques to create three-dimensional terrain models of each outcrop at ∼1 cm resolution (e.g., Campos et al., 2015). We used texture-mapped models to facilitate visualization of features visible at the outcrop scale, while providing proper scaling for quantitative studies (Campos et al., 2015; Istenič et al., 2019, 2020). The data used in this study is a subset of 14 out the 41 three-dimensional models from the Roseau fault system (Figures 4b and S1; Table S2).
2.3. Seafloor Photomosaics
We used still-camera vertical images of the seafloor to complement the ROV video imagery. The vertical images from the ODEMAR cruise are in black-and-white and images from the SUBSAINTES cruise are in color. We processed imagery and ROV navigation to construct seafloor photomosaics for each of the dives using standard methods (e.g., Gracias et al., 2009) with a resolution of ∼1 cm. These photomosaics provide visual ground truthing on the nature of the seafloor and various seafloor structures.
2.4. Rock Samples
In total, 201 rock samples were collected across the entire area of the Les Saintes graben using the ROV (Figure 4a). Around 65 samples from the Roseau fault reveal that the fault cuts across a range of extrusive volcanic and volcaniclastic deposits including andesitic lava, ferro-magnesian rich lavas, ignimbrites, and pyroclastics, which are often overlain by a thin drape of calcareous sediment that is generally less than 1 m thick (Table S3).
3. Observations of Seafloor Morphology
3.1. Regional Channel NetworkThe first order and largest-scale erosional features in the Les Saintes graben are the regional submarine drainage networks (Figure 2). The southwest flank of the Les Saintes reef plateau has an average slope of ∼10° and a subdued topography with drainages that have up to 200 m relief from crest to thalweg. Fault scarps up to ∼160 m high and dipping in the general uphill direction (i.e., to the northeast) interrupt the slope and pond sediments (Figure 2b). For example, channels that drain the southwest edge of the Les Saintes reef plateau predominantly trend to the southwest while channels draining the southern border of the reef plateau run in a southeasterly direction along the Roseau fault scarp so that sediments eroded from the southern edge of the reef plateau pond in the Roseau trough (Figure 2; Leclerc et al., 2016). The extent of ponded sediment is visible in the backscatter data where we interpret pale areas with low reflectivity to represent sedimentary cover (Figures 3c and 3d; Leclerc et al., 2016). Locally, channels that were probably initially connected to the reef plateau are now uplifted and cut from their initial source by uplift of the Rose-au fRose-ault scarp (Figures 2 and 5; Leclerc et al., 2016). Consequently, the surface morphology of the northeast dipping Roseau fault scarp, presented below, is a product of local erosion processes but still influenced to some extent by the regional drainage network.
Journal of Geophysical Research: Earth Surface
3.2. Surface Morphology of the Roseau Fault System
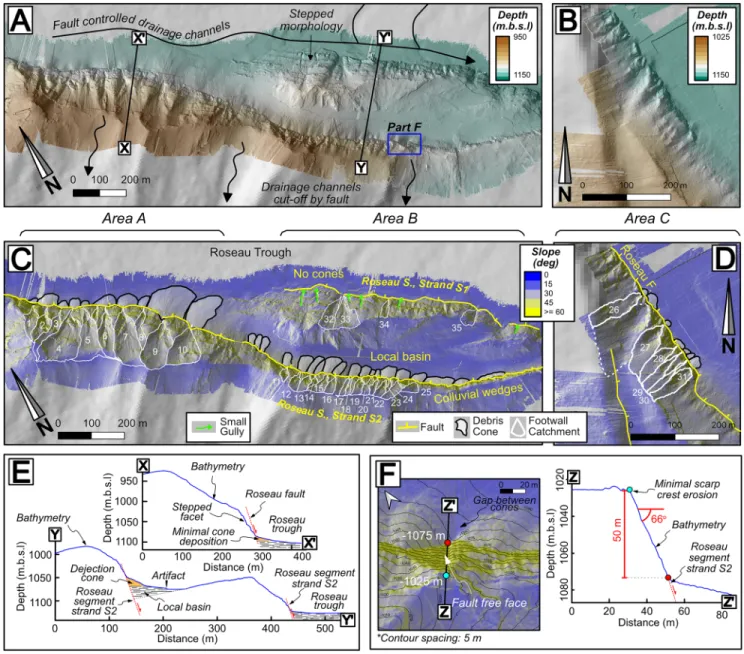
The Roseau fault scarp shows varying morphologies along strike (Figures 3, 5, and S2). For the northwest-ern part of the Roseau segment and the Canyon segment, the scarp is discontinuous and is only identifiable along the shoulders separating regional drainage channels, which postdate and, therefore, incise the scarp (Figure 2). In this area, the scarp reaches a maximum height of ∼100 m and has slopes >40° in some places. Along the southern border of the Roseau trough, scarp morphology becomes more pronounced as scarp height increases. The 1 m/pixel bathymetric data reveal that the Roseau segment is itself segmented and composed of three sub-segments separated from each other by relay zones with varying degrees of develop-ment (Figures 3 and 5). In particular, near the depocenter of the Roseau trough, a northern strand (herein
10.1029/2020JF005892
Figure 5. Footwall catchments and debris cones in areas A, B, and C of the Roseau segment. Figure locations are shown in Figure 3d. (a and b) Shaded relief maps derived from the 1 m/pixel digital terrain model (DTM). The black arrows show the approximate path of regional turbiditic drainage channels and demonstrate how uplift of the Roseau fault scarp has redirected regional drainage parallel to the fault. (c and d) Hillslope maps from the 1 m/pixel DTM showing the interpreted footwall catchment and debris cones. The numbers associated with the catchments refer to the data in Table S4. (e) Bathymetric section along the lines X–X′ and Y–Y′ (see part A for lines of section) showing the development of an uplifted local basin in the relay zone in area B (f) Enlarged hillslope map highlighting a 50 m high section of steep, relatively uneroded, fault free face along with bathymetric section Z–Z′ showing the steep scarp in cross section. The blue (top) and red (base) dots show corresponding points on the section and the map.
referred to as strand S1) and a southern strand (herein referred to as strand S2) overlap for 1.7 km and are spaced ∼300 m apart (Figures 3 and 5).
Footwall morphology of the Roseau segment varies from planar, high-slope (>60°) surfaces up to 50 m tall (Figure 5f), to sections with well-developed erosional footwall catchments, debris cones, and reduced high-slope surfaces in areas where scarp height approaches ∼100 m (Figure 5). In places, the scarp surface has a stepped morphology with individual steps occasionally >10 m in vertical height but are generally around 2–5 m in height. The stepped morphology is thought to reflect a succession of coseismic scarps, distributed faulting, and/or lithological layering (Leclerc et al., 2016), which, for the latter, could be enhanced by ero-sion from regional turbidity flows.
On the flanks of the Roseau volcano, which is cut by the Le Havre and Colibri segments, the seafloor ap-pears rougher in shaded relief maps than on the other slopes off the Les Saintes islands. Accordingly, scarps associated with the Le Havre and Colibri segments are less well-defined and have relatively few identifiable erosional gullies, catchments, and debris cones. The Le Havre and Colibri segments are themselves seg-mented into a series of scarps with the exception of the northwestern end of the Le Havre segment, which is located in the Roseau trough and resembles the morphology of the Roseau segment with a series of ero-sional footwall catchments and debris cones (Figure S2).
In sediments on the continental slope, erosional valleys are often referred to as submarine canyons (e.g., Brothers et al., 2013; Mountjoy et al., 2018). Here, we refer to erosional valleys on the footwall of the scarp as footwall catchments. The term catchment is preferred because we interpret the most-developed catch-ments to be cirque-like amphitheaters that capture mass-wasted material from their flanks and funnel the eroded material off the scarp (see section 6.3). Catchments in the footwall of the Roseau fault are mapped along the Roseau, Le Havre, and the Colibri segments and generally occur where steep (>60°) surfaces are preserved at the base of the scarp (Figure S3). The footwall of strand S1 has a combination of well-developed footwall catchments along with small chutes and gullies, and the catchments drain directly into the Roseau trough (Figure 5). By contrast, well-developed footwall catchments present on the footwall of strand S2 of the Roseau segment drain into a small local basin of ∼ 0.2 km2 within a relay zone (Figures 5c and 5e). The
local basin is uplifted by 40–60 m relative to seafloor in the Roseau trough due to its location in the footwall of strand S1 (Figures 2b, 3, 5c and 5e).
3.3. Submeter-scale Observations
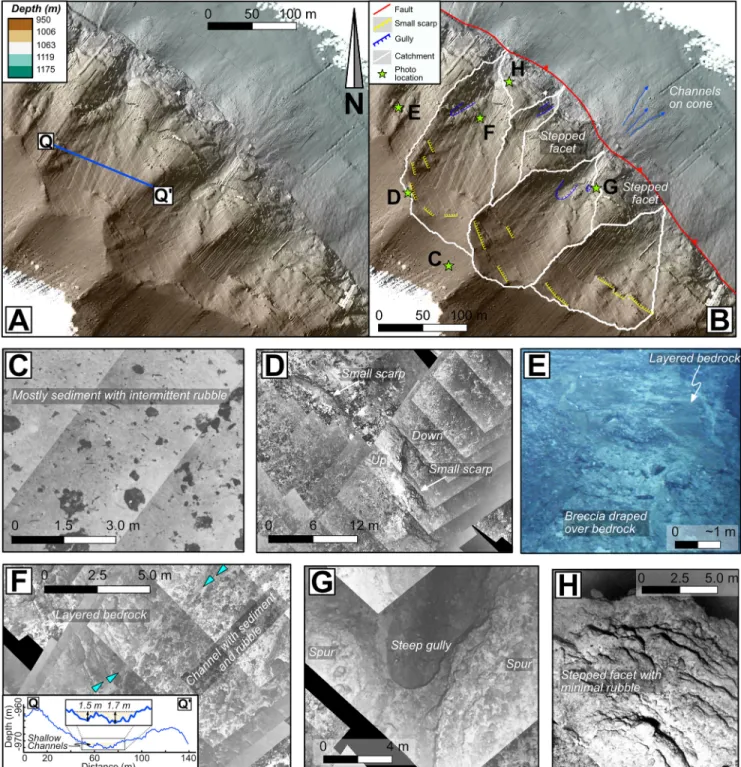
Various data sets characterize the submeter scale of the Roseau fault, including three-dimensional fault models, high-definition videos, photomosaics, and a 10 cm/pixel DTM that covers the surface area of three debris cones along the Roseau segment (Figures 6 and 7). The photomosaics provide semi-continuous im-ages of the entire footwall surface covering three catchments along the Roseau segment (see ROV tracks in Figure 4a inset). At the top of the scarp, outside the catchment, the seafloor is largely covered by sediment with intermittent rubble (Figure 6c). The transition into the catchment is visible as a transition from mostly fine grained (drapes of silt to sand) to coarse grained (blocky rubble) sediment (respectively, pale and dark in Figures 6c and 6d). In the upper catchment, several small escarpments are visible both in the 0.5 m/ pixel shaded relief map (Figures 6a and 6b) and in the photomosaics (Figure 6d). These small escarpments are located at the upper termination of sediment-filled channels that appear to funnel material out of the catchments and can be identified by pale streaks of sediment deposits oriented parallel to the thalweg and separated by abundant rubble deposited on top of layered bedrock (Figure 6f). At their maximum incision these shallow erosional channels are ∼1.5 m deep (Figure 6f). On the faces of the small escarpments in the upper catchment, brecciated deposits appear to have been draped over layered volcanic deposits providing evidence of active erosion in the upper catchment (Figure 6e). Lower down the slope of the catchment, the catchments narrow and the channels often lead into steep-sided erosional gullies near the catchment outlet (Figure 6g). Catchment outlets are separated by stepped facets (Figure 6b), which appear to be comprised of layers of in-situ breccia with minimal rubble cover (Figure 6h).
Along large sections of the Roseau fault, the lower section of the scarp is composed of a steep (60°–80°) plane, which at its base exhibits a relatively pale band of fresh bedrock up to ∼2.5 m high (Figure 7) that represents coseismic slip from the Mw 6.3 2004 Les Saintes earthquake (Escartín et al., 2016). We interpret
Journal of Geophysical Research: Earth Surface
10.1029/2020JF005892
Figure 6. Erosional features throughout the footwall of the Roseau fault scarp. (a) Uninterpreted shaded relief map derived from the 50 and 10 cm/pixel
digital terrain models. Part A is located in Figure 4a. (b) Interpreted map from part A showing the location of small escarpments and steep gullies along with the location of photos in parts C–H. (c) Photomosaic showing mostly sediment on the uneroded seafloor in the footwall. (d) A small escarpment in the upper catchment. (e) Screen shot from video imagery showing eroded breccia draped over layered bedrock. (f) A channel on the catchment surface which is filled with rubble and sediment and overlaps layered bedrock. The contact between deposited rubble and bedrock is highlighted by the blue arrows. Inset is bathymetric profile Q-Q' (located in part A) showing the channels in cross section. (g) Steep-sided gullies in the lower catchment. The gully in the photomosaic is ∼2–4 m deep. (h) Stepped bedrock with minimal sediment or rubble on a steep facet that separates catchment outlets. All photos are oriented with north toward the top.
the full steep plane to represent the fault free face (e.g., Wallace, 1977). The free face is visible at a range of resolutions from the 1 m/pixel DTM (Figure 5a) to the submeter scale (Figure 7) and can reach up to 50 m tall (Figure 5f). In three-dimensional outcrop models and video footage, the free face is clearly visible as a smooth surface which is occasionally interrupted at catchments outlets and debris cones (Figures 7c
and 7g). Striations, possibly slickensides, are visible on the free face in some of the three-dimensional mod-els (Figure 7d) and above the free face, the scarp is eroded with a rougher and uneven surface. The base of the free face is hidden by sediments deposited on the hanging wall (Figure 7g). Occasional ripples are visible in the fine-grained sediments at the base of the scarp and indicate a transport direction parallel to Figure 7. Submeter-scale morphology of depositional features associated with the Roseau fault scarp. (a) 10 cm/pixel digital terrain model (DTM) showing
features of the cone surface. Part A is located in Figure 4a. (b) Bathymetric profile parallel to fault strike showing the dome shaped profile of the cones and channels on cone surface. VE = Vertical exaggeration. (c) Enlarged view of the 10 cm/pixel DTM overlain by video imagery-derived, three-dimensional outcrop models of the fault free face. The dashed yellow boxes are the location of the photos in G and the yellow arrows show photo directions. (d) Video imagery-derived, three-dimensional models with possible slickensides and corrugations on the fault free face. (e) Still imagery-derived photomosaics of boulders and rubble on the cone surface. (f) Video imagery-derived three-dimensional outcrop model of a ∼10 m high uneroded section of steep scarp. The location of this model is shown in the inset of Figure 4a. (g) Screenshots from the video imagery showing various depositional features at the base of the fault slip plane and at catchment outlets. The white dashed line is the base of the scarp and the red dashed line is the top of recently exposed fault slip plane resulting from the Mw 6.3 Les Saintes earthquake (Escartín et al., 2016). HW = Hanging wall.
Journal of Geophysical Research: Earth Surface
the fault trace (Figures 7f and 7g). Where the free face is truncated by the outlet channels of the footwall catchments, rubble and angular boulders have been deposited on the hanging wall surface at the base of the scarp (Figure 7). The largest boulders are located near to catchment outlets and are well in excess of 1 m, with boulder size decreasing away from the catchment outlets (Figure 7c). The presence of such large boulders near the outlet suggest locally derived, gravity driven, mass-wasting depos-its. The surfaces of the debris cones are also littered with large boulders surrounded by fine grained, mobile sediment that can be reworked by currents (Figures 7c, 7e, 7g). The 0.1 m/pixel DTM also shows channels on up to ∼5 m wide and ∼1 m deep incised on the surface of the largest debris cone (Figures 6b and 7b). In contrast, a three-dimensional model taken from a ∼10 m high, subvertical, uneroded section of the fault free face has no boulders or rubble deposited on top of sediments in the hang-ing wall (Figure 7f).
4. Quantification of Scarp Morphology and Erosion
The meter-scale morphological features of the Roseau fault described above clearly result from the interaction between tectonics, erosion by mass wasting, and sedimentation. To parameterize this interaction we performed various measurements using the methodology described below.
4.1. Methods
4.1.1. Scarp Mapping and Characterization
We extracted shaded relief, slope, and aspect maps from the 1 m/pixel DTM and used the maps to outline the extent and characterize the sur-face morphology of the Roseau fault system. An example of how we used the various maps to parameterize the scarp is included in Figure S4. We focused on the Roseau fault system for our quantitative analysis because it has the tallest exposed fault scarp (>150 m) within the Les Saintes graben. Additionally, constraints on the amount of erosion in the catch-ments and deposition in the debris cones of the Roseau segment allow a first-order estimate of the erosional volume balance between footwall and hanging wall.
To characterize empirical relationships between scarp morphology, erosion, and deposition during scarp development, we calculated scarp average slope and apparent scarp height from bathymetric profiles (Fig-ure 8) for specific sections of the Canyon, Roseau, Le Havre, and Colibri segments of the Roseau fault system (yellow outlines in Figure 2). Scarp sections were selected based on availability of the 1 m/pixel DTM over most of the scarp and/or unambiguous identification of the base of the scarp identifiable in the 1 m/pixel DTM. The total distance measured along strike was ∼11.5 km. We also plotted scarp average slope, appar-ent scarp height, and cumulative scarp height (i.e., the sum of the height from strands S1 and S2 plus the height of talus in the hanging wall) along a continuous ∼7 km section of the Roseau segment (Figure 9, extracted from blue fault trace in Figure 2).
We measured apparent scarp height from the top of the scarp (point 1 in Figure 8b) to the hanging wall cut-off (point 3 in Figure 8b). We did not measure total scarp height from the top of the scarp to the base of hanging wall talus because the base of talus in the hanging wall (point 6 in Figure 8b) is often ambiguous
10.1029/2020JF005892
Figure 8. Parameters used to quantify the surface morphology of the
Roseau fault. (a) Three-dimensional schematic view. (b) Schematic cross section along the line X–X′ showing a section through the scarp at a catchment outlet. The numbers in the boxes denote points referred to in the text to describe how we quantified scarp morphology, which is described in detail in the supplement. (c) Cross section view along the line Y–Y′ showing a transect through a section of scarp with exposed fault free face and the parameters used to quantify uncertainty in erosion measurements. The blue area outlines how scarp average slope may vary from the actual surface slope at a given point along the footwall.
(Figure S5), whereas the hanging wall cut-off (point 3 in Figure 8b) is easier to identify in slope and/or shad-ed relief maps. The 1 m/pixel DTM does not provide continuous along-strike coverage for the entire footwall of the Roseau segment. Therefore, for our continuous along-strike plot, we supplemented the 1 m/pixel data with the 10 m/pixel data in areas of the footwall not covered by the 1 m/pixel data. We also measured the slope of the fault free face at 39 locations in 14 three-dimensional models using the software MESHLAB (Figure S1). The parameters used to quantify scarp morphology are shown schematically in Figure 8 and described in detail in the supporting information S1.
Figure 9. Along strike morphology of the Roseau segment based on blue fault trace in Figure 2. The blue lines correspond to the main Roseau segment (including strand S2) the yellow lines correspond to strand S1 where the faults overlap in the relay zone. (a) Bathymetry along strike. The blue and yellow lines represent bathymetry along the top of the scarp and the gray lines are bathymetry along the base of the scarp. The heads of major footwall drainage channels (thin triangles) correspond to local bathymetric lows along the top of the scarp. (b) Apparent scarp height along strike showing the location of footwall catchments and debris cones and the amount of scarp burial by debris cones. (c) Cumulative scarp height calculated by summing the heights of the two fault strands in area B. (d) Scarp average slope.
Journal of Geophysical Research: Earth Surface
4.1.2. Footwall Catchment and Debris-Cone Mapping
We performed volume-balancing calculations for 34 erosional footwall catchments and/or debris cones along the Roseau segment to compare volumes eroded from the footwall to volumes deposited in the hanging wall. Catchments in the footwall of the Roseau segment were extract-ed from the 1 m/pixel DTM with TopoToolbox (Schwanghart & Scherl-er, 2014). To quantify the volume eroded from footwall catchments (VFW),
we used bathymetric profiles spaced 1-m apart and oriented perpendicu-lar to the direction of mean fault strike at the catchment outlet. We took the sum of eroded volumes from each profile along strike within the foot-print of the catchment to be the catchment volume. The parameters used to quantify eroded volumes are included in Figure 8 and described in detail in the supplement.
We also calculated debris-cone volumes (VHW) using bathymetric profiles
spaced every meter and oriented normal to fault strike at the catchment outlet using the parameters shown in Figure 8. Due to variations in the dip of the seafloor in the hanging wall (i.e., toward the fault in places or away from the fault in others), debris-cone volumes were calculat-ed assuming deposition on a flat surface similar to the calculations of Jayko (2005) (see discussion in Section 6.1.2). Variations in possible ge-ometry of the seafloor in the hanging wall were incorporated into the un-certainty for the cone volumes (Figure 8c). Further details on the meth-odology and parameters employed to calculate cone volumes is provided in the supporting information S2.
4.2. Results
4.2.1. Scarp Slope, Height, and Erosion
We plotted the along-strike bathymetry, apparent scarp height, cumulative scarp height, and scarp average slope along strike for the Roseau segment (Figure 9) and we identified three areas (areas A, B, and C; Fig-ure 3b) that have footwall catchments and/or debris cones. Along-strike bathymetry, apparent scarp height, and cumulative scarp height show considerable variability along strike and have maximum values located in areas A and B (Figure 9). Local lows in along-strike bathymetry and scarp height generally correspond to major drainage channels in the footwall (Figure 9a). Apparent scarp height ranges from <10 m to a maximum value of 164 m in area A (Figure 9b), but cumulative scarp height reaches a maximum value of ∼170 m in the relay zone in area B (Figure 9c). Well-developed footwall catchments are generally only ob-served where scarp height is >50 m in maps derived from the 1 m/pixel or the 50 cm/pixel DTM (Figure 9c). Debris cones radiate from catchment outlets into the hanging wall in areas A, B and C. However, along strand S1 in area B, we note some large footwall catchments with no associated debris cones (Figure 5b). In area B, where apparent scarp height is ∼20 m, a colluvial wedge is present in the hanging wall with several small channels or erosive ruts rather than well-developed catchments on the adjacent footwall (Figure S6). In the same area, an elongate fan is deposited in the hanging wall and protrudes out from the scarp much farther than the colluvial wedges to either side (Figure S6).
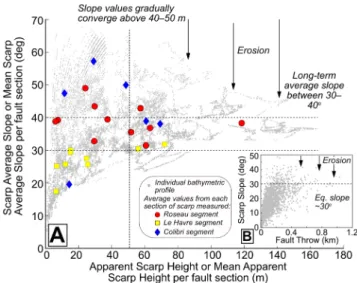
Scarp average slope for the Roseau segment exhibits significant variability along strike with values between 20°–40° and local highs of >70° located where scarp height is < 50 m at 2.5–3 km and 4.5–5 km along strike (Figure 9d). Footwall catchments and/or debris cones are generally mapped where scarp average slope is between 30° and 40° in areas A, B and C, although some cones toward the southeast end of area B corre-spond to higher slopes. The colluvial wedge occurs where scarp average slope increases above 60° in area B. We also investigated the relationship between apparent scarp height and scarp average slope for selected sections of the Roseau, Le Havre, and Colibri segments of the Roseau fault. The plot of apparent scarp height versus scarp average slope shows that for apparent scarp heights below 40–50 m, scarp average slope can reach values approaching 70° (Figure 10a), which is similar to a ∼72° mean dip of the fault free face
10.1029/2020JF005892
Figure 10. Morphological parameters for the Roseau fault. The data in
A are based on the fault sections outlined in yellow in Figure 2. The gray dots are data points from each individual bathymetric profile whereas the colored shapes are the mean values for each section of fault measured. (a) Plot of scarp average slope vs. apparent scarp height for the Roseau fault. (b) Plot of fault throw versus scarp slope from the Chile Ridge taken from Howell et al. (2016).
measured three-dimensional fault models (Figure S1c). The Roseau fault at depth is thought to dip 50° NE based on the distribution of aftershocks from the 2004 Les Saintes earthquake (Bazin et al., 2010). There-fore, we suggest that the Roseau fault must increase in dip as it approaches the surface as is commonly ob-served for normal fault systems (e.g., Jackson & McKenzie, 1983). As apparent scarp height increases above ∼40–50 m, the envelope defined by apparent scarp height and scarp average slope for each individual profile narrows (gray dots, Figure 10a). Additionally, above apparent scarp height of ∼60 m, the mean values of average scarp slope for each section of scarp measured (colored shapes, Figure 10a), all lie within the range of 30–40° (Figure 10a).
4.2.2. Footwall Catchments, Debris Cones, and Volume Balancing
Well-developed footwall catchments are generally found where the exposed scarp is higher than ∼50 m along sections of the Roseau, Le Havre, and Colibri segments of the Roseau fault system and along the Coche fault (Figure 2). Our analysis focused mainly on the Roseau segment because the 1 m/pixel DTM has the most complete coverage of the footwall scarp in this area. The catchments' long axes are oriented sub-perpendicular to fault strike, and the catchment outlines are generally elongated with width to length ratios that range from ∼0.15 to 0.60. Individual catchments are often separated between outlets by a steep fault free face and/or facets similar to a classical facet and spur morphology commonly documented in terrestrial catchments (e.g., Armijo et al., 1986; Bahrami, 2012; Wallace, 1978). Outlet spacings range from 50 to 100 m in area A and from 10 to 90 m in areas B and C. At its maximum extent in area A, headward erosion extends ∼200 m into the footwall but headward erosion only extends ∼10 m into the footwall for the steepest sections of the fault in area B (Figure 5).
Catchment area (a proxy for erosion) increases with catchment relief in a manner consistent with a pow-er-law relationship of exponent of 2.3 (Figures 11a). For catchment areas below 4,000 m2, mean catchment
gradients range from ∼25° to 50° but as catchment area increases above 10,000 m2 mean catchment
gra-dients plot in the range of 30°–40° (Figures 11b). The range of 30°–40° is the same as the range of mean values above ∼60 m on the plot of apparent scarp height versus average scarp slope (Figure 10). Full details of catchment area, maximum catchment relief, and mean catchment gradients are included in Table S4. Debris cones take the form of fan-shaped depositional features that radiate outwards from catchment outlets from the base of the scarp into the hanging wall. Average cone surface slopes are greatest in area B, where the mean of the average cone slopes is 29° and maximum slope values of 40° are recorded on two colluvial wedges. Cone surface slopes in areas A and C are lower with mean values of 18° and 20°, respectively (Fig-ures 11c). The largest cones are mapped in area A, where cone volumes ranged from 1.3 x 10³–2.1 × 10⁵ m3
and the ratio of footwall erosion to hanging wall deposition (VHW/VFW) is 0.18 (Figures 11c). In area B, debris
cone volumes ranged from 1.8 × 10³–3.7 × 10⁴ m3 and the cones in area B have a high V
HW/VFW of 0.80
(Fig-ures 11c). The cones in area C have the smallest volume, with a range in volume from 110 to 1,900 m3 and
a low VHW/VFW of 0.01 (Figures 11c). Full details of catchment and cone volumes are included in Table S5.
5. Discussion and Implications
The high-resolution data set from the Roseau fault has enabled us to characterize the morphology of the Ro-seau fault scarp at various scales and provides the framework to quantify relationships between scarp deg-radation and the evolution of scarp morphology with wider implications for erosion of the global seafloor.
5.1. Long-Term Rates of Landscape Evolution 5.1.1. Scarp Erosion Rate
The eroded volumes from the footwall of the Roseau segment (Figures 11c) enable us to estimate long-term erosion rates for the Roseau fault (Erf) using the following equation:
Journal of Geophysical Research: Earth Surface
fw fw rf rf V A E t (1)Equation 1 requires time constraints on the age of surface uplift related to the Roseau fault (trf).
Seismic-re-flection profiles imaging the relation between the Roseau volcano and the Roseau fault indicate that fault-ing postdates the emplacement of the volcano (Leclerc et al., 2016). There are no dates presently available for the youngest deposits from the Roseau volcano but terrestrial volcanism on the Les Saintes islands is thought to have occurred between 0.9 and 3.0 Ma (Zami et al., 2014). Using minimum trf = 0.9 Myr and
maximum trf = 3.0 Myr, an average value for eroded volume in the highest section of the Roseau segment
10.1029/2020JF005892
Figure 11. Catchment morphology and volume-balancing calculations. (a) Log-log plot of catchment area vs.
catchment maximum relief. (b) Plot of mean catchment gradient vs. catchment area. (c) Volume comparison between footwall catchment erosion (downward pointing triangles) and hanging wall deposition in debris cones (upward pointing triangles). Debris cones are color coded based on the average slope of the cone surface. Note that the y-axis is logarithmic.
in area A (Vfw) of ∼357,000 m3, and an average corresponding catchment area (Afw) of 8,700 m2, we
approx-imate a range of Erf of 14–46 m Myr−1.
For comparison, a minimum slip rate estimate for the Roseau fault based on the maximum age of terrestrial volcanism on Les Saintes of 3 Ma and 450 m of fault offset from seismic profiles is 0.15 mm yr−1 (or 150 m
Myr−1) (Leclerc et al., 2016). The minimum slip rate is between roughly three and 11 times larger than the
minimum erosion rate. There are few estimates of erosion rates for submarine landscapes in the published literature, but erosion rates in submarine channels incised in a mixture of sediments and volcanic deposits on the flanks of the Canary Islands are 17–50 m Myr−1 (Mitchell et al., 2003). Average denudation rates for
the period 4–24 Ma estimated from canyon cutting in volcanic bedrock with thin sedimentary cover at the Mid-Atlantic ridge are estimated at 10–20 m Myr−1 (Tucholke et al., 1997). Both of these ranges overlap with
the erosion rate for the Roseau fault.
5.1.2. Earthquake-Induced Mass Wasting
While the data presented here provides little constraints on whether mass wasting primarily occurs in the coseismic, postseismic, or interseismic period, a comparison of seismicity data with further observations from three-dimensional outcrop models, photomosaics, and ROV video imagery indicates strong evidence for coseismic mass wasting with some minor postseismic erosion (Escartín et al., 2016, 2020). Elsewhere in the Lesser Antilles, evidence for coseismic triggered mass wasting of sediments has previously been identi-fied from sediment cores and seismic data between Guadeloupe and Nevis (Beck et al., 2012).
Accordingly, we compare the erosion rate for the Roseau fault to earthquake-induced landslide erosion rates from subaerial settings. The range of 14–46 m Myr−1 for the Roseau fault overlaps with mean erosion
rates from coseismic forcing in the Sierra Nevada, USA (18.2 m Myr−1), Turkey (29.6 m Myr−1), and central
Japan (17.0–37.2 m Myr−1), all of which are derived from regional landslide inventories and earthquake
frequency-magnitude relationships (Keefer, 1994). Amongst other factors, the absence of water runoff and temperature fluctuations reduce the number and efficiency of denudational processes for the Roseau fault scarp compared to subaerial environments, yet it is noteworthy that the erosion rate from coseismic forcing at the submarine Roseau fault overlaps with terrestrial earthquake-induced landslide erosion rates across a range of tectonic, lithologic, and geographic settings. This suggests that earthquake-induced mass wasting may occur at comparable rates in the submarine and subaerial domains.
5.2. Erosion and Deposition at Both Regional and Local Scales
The regional drainage network around Les Saintes is an important large-scale erosion system that interacts with depositional features associated with local mass redistribution, such as debris cones. On the kilometer scale, pronounced fluctuations in height along the strike of the Roseau fault scarp (Figure 9) result from a two-way interaction between scarp growth and sedimentation, encompassing turbiditic sediment flows sourced from the Les Saintes reef plateau and pelagic or hemiplegic sediments, which bury parts of the scarp (Leclerc et al., 2016). The data in Figure 9b also demonstrate that exposed scarp height oscillates along strike on the decameter scale. This small-scale variation may partly result from another two-way interaction where the scarp grows during an earthquake but is simultaneously buried by the products of coseismic and/ or postseismic mass-wasting (Escartín et al., 2016). Further evidence for simultaneous uplift and partial burial is provided in Figure 7g where the coseismically exposed rock toward the base of the scarp at the catchment outlet is buried by rubble clearly sourced from within the catchment.
Regional turbiditic erosion is also an important consideration when interpreting the results of the volume balancing. The absence of debris cones in the hanging wall of strand S1 of area B, coupled with the low VHW/
VFW in areas A and C (Figures 11c), probably results from partial or complete burial of the debris cones by
sedimentation in the Roseau trough or possible removal of sediments via strong regional turbidity currents. Up to 300 m of sediment infill in the Roseau trough, identified in seismic profiles (Leclerc et al., 2016), is sourced from the Les Saintes reef plateau, the northern Savane trough, and the Roseau volcano (Figure 2). The hanging wall of area C is located in deepest part of the Roseau trough where sediment should be thick-est and is also located ∼50 m downslope of the hanging wall of area A (Figure 9a). The difference in VHW/
VFW between area A (0.18) and area C (0.01) could reflect greater burial of the debris cones by sedimentation
Journal of Geophysical Research: Earth Surface
B are located in an isolated local basin where strand S1 forms a barrier and cuts off the hanging wall of strand S2 from external sediment sources within the relay zone (Figure 5). In this area, the VHW/VFW of 0.80
is higher because sources of sedimentation to bury the cones are limited to pelagic and hemipelagic sedi-mentation, or to sediment sourced from footwall of strand S2. Therefore, the volume of the debris cones in the hanging wall of strand S2 in area B may effectively embed the erosion signal from the footwall because there are fewer external sources of sediment to bury the cones.
Our debris-cone volumes assume deposition on a flat surface. The current seafloor geometry in the hanging wall along most of the Roseau segment is relatively flat but results from sedimentation into the Roseau trough or pelagic and hemipelagic sediment in the uplifted basin in the relay zone, both of which postdate uplift of the Roseau fault scarp. The seafloor in the footwall of strand S1 (effectively the initial seafloor in the hanging wall of strand S2) dips ∼10° toward the fault (Figure 5e), so the geometry of the seafloor at the onset of cone deposition depends on the rate of pelagic and hemipelagic sedimentation and how much pelagic sediment was present in the isolated basin at the onset of cone deposition. Unfortunately, we have no constraints on sedimentation rates and no high-resolution subsurface data to characterize the subsurface structure of the debris cones (e.g., chirp sonar). Regardless, possible variations in the seafloor are included in the uncertainty of the cone volumes and comparing either the maximum or minimum cone volumes in area B with the volumes of the associated catchments, still indicates that the cones in area B effectively record the erosion signal from the associated catchments. The variation in VHW/VFW between the individual
catchments and cones probably results from interactions between the cones and burial of some parts of the cone flanks via eroded material from neighboring catchments.
5.3. Long-Term Scarp Evolution
Subaerial landscape erosion is driven to a large extent by water and ice runoff focused along valleys (e.g., Herman et al., 2015; Howard, 1994; Whipple & Tucker, 1999). On hillslopes, mass wasting processes play a more important role and are primarily driven by the gravitational force acting on the soil or rock itself (e.g., Densmore et al., 1997; Fernandes & Dietrich, 1997; Roering et al., 1999; Rosenbloom & Anderson, 1994). In uplifting extensional settings, these processes combine to alter the morphology of subaerial normal fault scarps where valleys carved in the footwall are separated by spurs and triangular facets, which may have a steeply dipping section of fault free face at their base as previously documented in the Basin and Range, USA (Wallace, 1977, 1978). Other classic examples of this morphology are documented in the Hellenic Arc, Greece (Armijo et al., 1991, 1992) and in southern Tibet (Armijo et al., 1986). In submarine environments, sediment gravity flows fed by mass wasting of unstable sediment deposits lead to the formation of subma-rine drainages on the continental slope that superficially resemble subaerial drainages despite differences in weathering and sediment transport processes (e.g., Brothers et al., 2013, Dobbs et al., 2019).
The Roseau segment scarp has a faceted spur morphology that is similar to classical examples of terres-trial normal fault scarps but is carved in submarine volcanic and volcaniclastic bedrock (Figures 5 and 6). Various contributing factors that trigger mass wasting in subaerial catchments or in submarine sediment dominated catchments on the continental slope are absent from the Roseau fault. Examples include: large volumes of unstable sediment deposits (Figure 6), physical weathering driven by temperature fluctuations (Eppes & Keanini, 2017), and production and transport of regolith on hillslopes (Densmore et al., 1998; Tucker et al., 2020). At mid-ocean ridges, fault scarps are thought to undergo gradual weathering via hy-drothermal circulation in cracks and fissures and low-temperature alteration (Alt et al., 1986; Tucholke et al., 1997). The Roseau fault scarp surface shows both surface weathering and deposition of manganese coating, which indicates a degree of low-temperature alteration. However, we have no data on the extent to which possible low-temperature alteration weakens bedrock during scarp growth. Therefore, we speculate that erosion along the Roseau fault scarp should primarily result from the failure of more or less altered bedrock facilitated by coseismic shaking from earthquakes on either the Roseau fault or other regional faults, as observed along fault scarps at mid-ocean ridges (Allerton et al., 1995; Cannat et al., 2013; Goff & Tucholke, 1997; McAllister & Cann, 1996; Tucholke et al., 1997).
5.3.1. Scarp Evolution Model
The observations of seafloor morphology (Figures 6 and 7) along with the slope, height, and erosion data for the Roseau fault scarp (Figures 9–11) provide the framework for a process-based model for the evolu-tion of active submarine normal fault scarps developing on basement or hard substrate (Figure 12). Over the timescale of scarp development, the model can be viewed as a continuous process where mass wasting maintains a critical scarp slope.
After the onset of surface uplift, submarine scarps develop as high-slope surfaces (the fault free face), which reflect the geometry of the fault plane in the shallow subsurface (Figure 12a). Relatively uneroded sec-tions of the fault free face up to 50 m tall are observed along the Roseau (Figure 5f) and Colibri segments (Figure S2) but, in general, scarps become unstable and mass wasting begins when scarp height reaches 20–40 m (Figures 10 and 12b). We note that while we model the relationship between catchment maximum relief and catchment mean slope as a power-law fit (Figures 11a), the data also shows a good correlation using an exponential fit with an exponent of 0.02 (Figure S7). An exponential fit implies the existence of a characteristic relief, which using the exponent of 0.02 would be 50 m, and this is consistent with the maximum height of preserved free face of 50 m recorded in the study area. From the data presented here, it is unclear whether the threshold stability height of 20–40 m represents a time-threshold resulting from gradual weathering of the fault scarp due to low-temperature alteration or a stress threshold resulting from gravitational instability due to tectonic scarp growth. Regardless, at this early stage of scarp growth, deposi-tion is not focused on the outlets of well-developed catchments but at several small chutes and gullies along strike (Figure 12b). The depositional product of the early erosion is a colluvial wedge with steep slopes that approach 40° in places (Figures 5c, 11c, and 12b).
The incipient steep gullies and head scars observed in the footwall catchments (Figure 6) are similar to larg-er-scale features recorded in slope-confined submarine canyons on the continental slope of northeastern Figure 12. Schematic block models that outline the process-based model for submarine normal fault scarp evolution in volcanic basement lithologies. The
fault free face is shaded light blue. Small blue arrows represent mass-wasting via rockfalls from the catchments into the debris cones. See text for full description of processes.
Journal of Geophysical Research: Earth Surface
Australia (Puga-Bernabéu et al., 2011). Such features recorded in sediments are evidence of slope failure and upslope retrogressive erosion (Elliott et al., 2006; Green et al., 2007; Orange et al., 1997). In general, footwall catchments are associated with a section of critically steep scarp or fault free-face near the base of the scarp and catchments are less well developed in areas where there is a gradual decrease in slope from the footwall to the hanging wall (Figure S3). Accordingly, we suggest that above a certain height, that in our study area is ∼20–40 m, gullies begin to erode into the free face via upslope retrogressive erosion (Fig-ures 12b and S6). With further scarp growth above 40–50 m (such as in area B), the gullies begin to interact and form catchments that funnel mass-wasted material off the scarp and focus deposition into radial debris cones (Figure 12c). With scarp growth above ∼100 m (such as in area A), catchments begin to expand and interact and the fault free face may become buried by hanging wall deposition while the slope of the foot-wall scarp evolves to between 30° and 40° (Figures 10a, 11b, and 12d).
Terrestrial catchments tend to follow Hack's Law where the length of a stream is related to the upstream drainage area by a power-law with exponent of 0.6 (Hack, 1957). Catchment erosion in the footwall of the Roseau fault is not driven by local stream incision but via mass wasting on the critically steep “hillslopes” of the fault scarp. Channels play a secondary role funneling material downslope which likely erodes the channel bed by plucking and abrasion. For the Roseau fault, we show that catchment area increases with catchment relief in a manner consistent with a power-law relationship of exponent of 2.3 (Figures 11a). This power-law relationship may point to a Hack's law-type relationship for submarine catchments where drainage area is a function of scarp height. However, further examples of submarine catchments from dif-ferent lithological and geographic locations are needed to test the robustness of this relationship.
Rockfalls and possibly small rockslides are the most likely mechanisms for mass wasting along the Ro-seau fault scarp (Hungr et al., 2014; Varnes, 1978). Rockslides have previously been proposed as the key mechanism for mass wasting for submarine normal fault scarps in basaltic bedrock at the Mid-Atlantic ridge (Cannat et al., 2013). Evidence for rockfall is present in the abundant angular rubble and boulders on the surface of the debris cones and the footwall catchments (Figures 6 and 7). Turbidity flows are a key mass-wasting process associated with eroding sediments in submarine canyons on the continental slope (e.g., Hampton et al., 1996; Locat & Lee, 2002; Masson et al., 2006). For the Roseau fault, the small amount of fine sedimentary cover on the eroding footwall (Figures 6 and 7) could minimize the potential for en-trainment of large volumes of fine sediment in turbidity currents. However, the small channels visible on the surface of the largest debris cone (Figure 7) appear to indicate some turbidity flows do initiate in the larger catchments. These turbidity flows likely entrain the thin layer of pelagic and hemipelagic sediments present on the catchment surface or fine sediments in the channels (Figure 6f). Additionally, we speculate that the elongate fan in area B (Figure S6) could result from mass wasting of a localized deposit of increased sediment thickness within the adjacent footwall.
The mechanics of submarine rockfall are similar to a subaerial environment except that grain disintegration is lessened by slower transport velocity and resulting lower energy grain impacts due to transport in water versus air (Mazzanti & De Blasio, 2013). Limited grain disintegration may explain the numerous angular boulders >1 m that are mapped on the cone surface (Figure 7c). Furthermore, headward erosion within the catchments has a maximum of ∼200 m (Figure 5) and maximum catchment relief is 160 m (Table S4). The short potential transport distance and relatively low relief may also limit abrasion and grain disintegration during transport, which in turn will limit the production of fine-grained sediment within the catchments. Accordingly, we suggest the majority of fine sediment observed on the footwall and on the cone surfaces (Figures 6 and 7) is a mixture of pelagic and hemipelagic sediment, and mobile turbidite sediment sourced from the regional drainage network.
5.4. Implications for Submarine Landscape Evolution in Active Tectonics Settings
While the Roseau fault is situated in the Lesser Antilles volcanic arc (Figure 1), the underlying basement li-thology and extensional tectonic setting make for a good approximation of normal faults at mid-ocean ridg-es. The mid-ocean ridge system is >65,000 km in length and plays a significant role in shaping topography for a large portion of the global seafloor. Previous studies of active submarine fault scarps at mid-ocean ridg-es have identified mass wasting as a significant erosional procridg-ess (Allerton et al., 1995; Cannat et al., 2013; Goff & Tucholke, 1997; McAllister & Cann, 1996; Olive et al., 2019; Tucholke et al., 1997).