HAL Id: halshs-00551770
https://halshs.archives-ouvertes.fr/halshs-00551770
Preprint submitted on 4 Jan 2011
HAL is a multi-disciplinary open access archive for the deposit and dissemination of sci-entific research documents, whether they are pub-lished or not. The documents may come from teaching and research institutions in France or abroad, or from public or private research centers.
L’archive ouverte pluridisciplinaire HAL, est destinée au dépôt et à la diffusion de documents scientifiques de niveau recherche, publiés ou non, émanant des établissements d’enseignement et de recherche français ou étrangers, des laboratoires publics ou privés.
Global Burden of Disease and Economic Growth
Martine Audibert, Pascale Combes Motel, Alassane Drabo
To cite this version:
Martine Audibert, Pascale Combes Motel, Alassane Drabo. Global Burden of Disease and Economic Growth. 2011. �halshs-00551770�
CERDI, Etudes et Documents, E 2010.36
C E N T R E D'E T U D E S E T D E R E C H E R C H E S S U R L E D E V E L O P P E M E N T I N T E R N A T I O N A L
Document de travail de la série Etudes et Documents
E 2010.36
Global Burden of Disease and Economic Growth
Martine Audibert1, Pascale Combes Motel, Alassane Drabo
Centre d’Etudes et de Recherches sur le Développement International (CERDI), Clermont Université – 65, bd François Mitterrand, 63000 Clermont-Ferrand, France
décembre 2010
1
2
Abstract
Relationships between health and economic prosperity or economic growth are difficult to assess. The direction of the causality is often questioned and the subject of a vigorous debate. For some authors, diseases or poor health had contributed to poor growth performances especially in low-income countries. For other authors, the effect of health on growth is relatively small, even if one considers that investments which could improve health should be done. It is argued in this paper that commonly used health indicators in macroeconomic studies (e. g. life expectancy, infant mortality or prevalence rates for specific diseases such as malaria or HIV/AIDS) imperfectly represent the global health status of population. Health is rather a complex notion and includes several dimensions which concern fatal (deaths) and non-fatal issues (prevalence and severity of cases) of illness. The reported effects of health on economic growth vary accordingly with health indicators and countries included in the analyses. The purpose of the paper is to assess the effect of a global health indicator on growth, the so-called disability-adjusted life year (DALY) that was proposed by the World Bank and the WHO in 1993. Growth convergence equations are run on 159 countries over the 1999-2004’s period, where the potential endogeneity of the health indicator is dealt for. The negative effect of poor health on economic growth is not rejected thus reinforcing the importance of achieving MDGs.
Keywords: Disease Global Burden, DALYs, economic growth, macroeconomic health impact, cross-country analysis
3
1.
Introduction
Sen’s works on human capabilities and the emergence of AIDS have renewed the interest given to the link between health, welfare, and prosperity. In 2001, the Commission on Macroeconomics and Health (2001) concluded that diseases raise barriers to economic growth and that countries have to invest in health. Theoretical arguments can also be found in growth theory where capital accumulation is meant to drive growth. Human capital investments are known for a long time as basic candidates explaining growth performances (e. g. Schultz, 1961; Mankiw et al. 1992). Recent studies stress either the role of education on income per capita growth in Asian emerging countries (Chi, 2008; Kwack and Lee, 2006; Kang, 2006) or the effect of health status on growth through its effect on education (Li and Huang, 2009).
At a microeconomic level2, several studies found that poor health has negative effects on economic prosperity and living conditions. A great variety of health indicators are used and concern either one specific communicable disease such as Guinea worm, schistosomiasis or malaria (Weisbrod and Helminiak, 1977; Audibert, 1986; Audibert, 1997a and 1997b; Audibert and Etard, 1998; Girardin et al., 2004), or self-assessed health status relied to activities of daily living and to general health (Schultz and Tansel, 1997; Gertler and Gruber, 2002; Christiaensen, Hoffmann and Sarris, 2007; Liu et al., 2008).
At a macroeconomic level, several authors consider that communicable diseases, among others, had contributed to slow down economic development of low income countries. Nevertheless, their affirmation on this negative macroeconomic effect is still hotly debated as some methodological issues are not satisfactorily addressed (see the comprehensive and critical review of Packard, 2009). Moreover, several studies argue that the negative effect of health on growth is not so obvious. Acemoglu and Johnson (2006), using international data from the epidemiological transition period, find that an increase in life expectancy generated by a decrease in mortality rates had a small positive effect which grows over the post epidemiological transition. The latter was not enough important to compensate for increases in population. Consequently, life expectancy increases do not lead to a significant increase in per capita economic growth. This study makes reminiscent previous results of Barlow (1968) with regard to malaria eradication and of Over (1992) with regard to economic effects of
2
The literature on links between health and economic well-being or prosperity at microeconomic level is abundant. Strauss and Thomas (2007) recently did an exhaustive literature review of this topic at microeconomic level.
4
AIDS as well. Indeed, Bell, Bruhns and Gersbach (2006), using an overlapping generations model simulate relaxed effects of AIDS on economic growth in Kenya by 2050.
There are at least three reasons that could explain difficulties to accurately assess health impacts at the macroeconomic level. First, links between health and development or growth are complex and health effects could also be channelled by education, the environment, and cultural behaviours as well. When, due to missing adequate indicators, these behaviours are not included in the model, the estimated health effects will be biased or hidden by unobserved heterogeneity (Thomas, 2009; Strauss and Thomas, 2007). Second, health is subject to random measurement errors either due to poor measurement facilities (lack of good equipment for setting appropriate diagnosis, low human resource training, lack of good registration), measurement variability over the day (e.g. blood pressure) or the year (e. g. malaria indicators). Third, health status is a rather complex notion that includes several dimensions.
Despite these difficulties of measuring multiple dimensions of health and therefore global health status, macroeconomic effects of health have been more often studied using health indicators such as life expectancy at birth, infant mortality rates, or anthropometric measures. Studies results can be questioned. For instance, life expectancy at birth is closely related to infant mortality or high adult mortality rates, due to AIDS and alcoholism, which is a specific and partial aspect of health status. Anthropometric measures focus mainly on nutritional status of children which is not representative of overall health status. Our purpose in this article is to study the relationship between health and development at the macroeconomic level, by using the global health status indicator provided by the World Health Organisation and the World Bank, namely the Disability Adjusted Life Years (DALY).
The rest of the paper is organized as follows. Section 2 is devoted to health measurement issues. Different measures of health indicators used in the growth literature are discussed before presenting exploring the more global one which is focused on in this study. Section 3 reviews the theoretical and empirical literature on the link between health outcomes and economic performances. The empirical setting and the results are presented in section 4 and 5. Section 6 concludes.
5
2.
Looking for a global health indicator
Health measurement is a hard task since, contrary to economic indicators, health is multi-dimensional3, and measured with errors. Moreover, researchers, either in a perspective of public health, health research, or economic health research, have developed a battery of health indicators, among which few however are satisfactorily measured (Murray and Frenk, 2008; Murray, 2007)4. If it is crucial to understand what each indicator measures (Strauss and Thomas, 2008), it is also important to assure that the health indicator used fits the purpose of the study.
The most-used indicators of health conditions at the macroeconomic level are life expectancy at birth and infant mortality rates (Strauss and Thomas, 2008). Those indicators are considered reflecting the general health conditions and supposed to be positively associated with economic growth. It is true that life expectancy is higher and infant mortality lower in richer countries than in poorer countries. Indeed, the correlation between life expectancy at birth and GDP per capita is not systematic as life expectancy is in some countries lower (or higher) than expected given GDP per capita (Southern Africa, Gabon or Indonesia, for examples, Strauss and Thomas, 2008). Over time, per capita incomes have diverged while life expectancy and infant mortality have converged (Deaton, 2006; Jack and Lewis, 2009). Life expectancy and infant mortality are inadequate indicators of the population’s health in high income countries and for some upper middle income countries as life expectancy is high and infant mortality very low or low. For low and lower middle income countries, those indicators are more adequate due to their poor levels. For that reason, studying the relationships between health and economic development or growth in cross-country studies using infant mortality or life expectancy at birth is not really appropriate.
The emergence of HIV/AIDS and the highly prevalence (more than 15%) in some southern African countries (Botswana, Lesotho, Namibia, South Africa, Swaziland, Zambia, and Zimbabwe, UNAIDS5), has motivated several studies focusing on their economic effects. But, little evidence of a correlation between HIV/AIDS and GDP per capita was found (Strauss and Thomas, 2008). With the renewal interest for malaria, some authors (Sachs and Malaney,
3
Whatever the approach chosen (medical, self-assessment or functional) for measuring health, poor health is considering as a deviation between the observed health and a norm. This deviation may occur into either, physical, mental, or social well-being dimension.
4
For a discussion on the issue and challenge of health measurement, see Mwabu, 2007; Strauss and Thomas, 2008; Murray and Frenk, 2008; Audibert, 2009).
5
6
2002; McCarthy, Wolf and Wu) focused on the effect of that disease on African countries growth.
As underlined by Jack and Lewis (2009), the effect of a population’s health status on national income varies accordingly with the health indicator used. Most health indicators used in the literature capture one dimension of the population health. They either relate to fatal issues, underlying the rule of rescue (life expectancy6, mortality indicators), or to non-fatal ones (morbidity indicators) issue of illness (Audibert, 2009). Those indicators neither take into account other dimensions of health, such as invalidity, handicap or social consequences, nor multidimensional characteristics of health.
3.
Relationship between health and growth
The implicit question of the connections between health and growth is twofold: Do investments in health boost economic growth; do economic opportunities help to improve health? Directions of the causality between health and economic growth are still the subject of discussions as well as its bidirectional causality (Jack and Lewis, 2009; Duncan, 2009; Weil, 2010). Nevertheless, estimating those relations is difficult, specifically in cross-country analyses. Several authors like Schultz (2008), argue that there is a need “for a more conceptual hypotheses refinement and empirical testing and comprehensive study of specific pathways which could improve our knowledge about those causal connections”. Those pathways may concern life styles, the environment (social, economic and physical) and health services (Aguayo-Rico et al. 2005).
3.1.
Theoretical background
This paper builds on the idea of health being a capital: people are endowed an initial stock which can depreciate through time with age but which is the subject of investments (Grossman, 1972; see Mwabu, 2007 for a literature review on the concept of health capital). From such a perspective, Van Zon and Muysken (2005) mention two positive effects of health on economic growth. First, the health status of population increases the efficiency of labour; second, human capital accumulation requires “health hours”. These effects add to those of Bloom and Canning (2000) who argue that improvements in longevity increase savings and in turn investments; moreover there exists a demographic dividend generated by a decline in
6
In low income countries, life expectancy is mainly determined by infant mortality, and also in countries where AIDS prevalence is high, by AIDS mortality.
7
child mortality. The effect of health on economic growth has also been the subject of theoretical investigations. One may refer to the augmented Solow model developed and tested by Mankiw et al. (1992). Other authors have included health in optimal Cass-Koopmans like growth models and thereby justified its inclusion in conditional convergence analyses as well: the productivity in the health sector has a positive impact on all steady state variables (Muysken et al. 2003). At last, health investments are taken into account in endogenous growth models à la Lucas (1988) with two characteristics: health is produced with decreasing returns whereas human capital is built with increasing returns. Health can either be a complement or a substitute to growth when the effect of health on longevity is internalised (van Zon & Muysken, 2001). Neo-schumpeterian growth models also allow identifying several channels through which population health impacts their long run growth performance. One of these channels puts forward the ability of health improvements to stabilise the gap in living standards relatively to technology leaders (Howitt, 2005).
3.2.
Empirical estimation of the links between health and
economic growth or prosperity
The association between income level and population health has been extensively studied in the literature for several years. At the macro-level, the apparent link between those two variables has been highlighted by the Preston’s curb (1975) which establishes an upward shifting relationship between life expectancy and national income per capita between 1900 and 1960. This correlation however neither gives pieces information on the sense of the causality nor on the different channels through which health may impact economic growth.
These channels may be identified. The first is that healthier people are more productive and more efficiently supply labour. Indeed, they can work harder and longer, and think more clearly. Health status may also improve economic outcomes through its effect on education. Improvements in health raise the motivation to attend high level schooling, since the returns to investments in schooling are valuable over a longer working life. Healthier students also have more attendance and higher cognitive functioning, and thus receive a better education for a given level of schooling. Furthermore lower mortality rates and higher life expectancy encourage savings for retirement, and thus raise investment levels and capital per worker. Table A8 in Appendix A gives a synthesis of some of the main studies that explored the connection between health and economic prosperity. We discuss here some major results
8
Some scholars assess empirically how health indicators may influence economic returns in a specific region using individual or household data while others measure the same effect at more aggregated level, between countries or regions. All these studies could be divided according to the health indicators considered. Indeed, a number of studies utilize health inputs whereas others used health outcomes. Health inputs are the physical factors that influence an individual’s health and comprise nutrition variables, exposure to pathogens, and the availability of medical care (Weil, 2007). Health outcomes are related to the health status of an individual or a given population. These include health indicators broadly considered such as life expectancy, mortality indicators, the ability to work hard, and cognitive functioning as well as specific illness prevalence such as malaria, AIDS/HIV, Guinea worm, etc.
Researchers generally conclude that population health remains an important predictor of economic outcomes. Life expectancy at birth positively impact economic performances (Barro & Lee, 1994; Cuddington & Hancock, 1994; Barro & Sala-I-Martin, 1995; Barro, 1996; Sach & Warner, 1997; Bloom & Malaney, 1998; Bloom, Canning & Malaney, 2000; Arora, 2001; Bloom, Canning & Sevilla, 2005; Acemoglu & Johnson, 2007, 2009; Bloom, Canning & Fink, 2009). Bloom et al. (2004) show that life expectancy has a positive, sizable, and statistically significant effect on aggregate output even when experience of the workforce is controlled for. Sala-i-Martin et al. 2004 departing from the numerous potential explanatory variables in cross-country growth regressions, implement a model selection criterion. The set of explanatory variables which emerges from the analysis includes human capital variables and more especially life expectancy at birth. Acemoglu and Johnson’s results (2007) are less conclusive with results indicating that increases in life expectancy have no significant effect on output per capita. But their results are still questioned on the choice of an adequate health indicator, the limited content of their sample, and the quality of their instrumental variable (Acemoglu & Johnson, 2009).
Mortality or survival variables are also used in the literature as overall health outcome indicators that impact economic growth (Hamoudi & Sachs, 1999; Bhargava et al. 2001; Bloom & Canning, 2005; Weil, 2007; Lorentzen et al. 2008). Using cross-national and sub-national data, Lorentzen et al. (2008) argue that high adult mortality rates reduce economic growth by shortening time horizons since they favour riskier behaviours, higher fertility rates, and lower investments in physical capital. Other authors are also interested in the impact of specific diseases on economic returns. In fact, many diseases like HIV/AIDS and malaria are found to have a negative effect on the economy (Cuddington & Hancock, 1994; Gallup & al,
9
1999; Bonnel, 2000; Gallup & Sachs, 2001; Sachs, 2003; Bell, Devarajan and Gerbasch (2003); McDonald & Roberts, 2006; Audibert et al., 1998, 1999, 2003, 2006, 2009). McDonald & Roberts (2006) have calculated that the elasticity of economic growth to HIV/AIDS prevalence in Africa is -0.59. Carstensen & Gundlach (2006) found that malaria prevalence causes quantitatively important negative effects on income even after controlling for institutional quality. Wiping out malaria from sub-Saharan Africa could increase that continent’s per capita growth rate by as much as 2.6% a year (Gallup and Sachs, 2001).
A second strand of the literature assesses the importance of health inputs on development. Calories intakes and economic output are positively correlated since richer countries have more health inputs than poorer countries: hourly earnings, farm outputs and wages rise with increased per capita calorie and protein intakes. Using household-level data from Sierra Leone, Strauss (1986) demonstrate that caloric intakes have a highly significant effect on labour productivity while Sahn & Alderman (1988) show that calories impact wages. It is well-known that malnutrition is detrimental to physical and mental development while both have an effect on education, and then on future incomes. Using data on monozygotic twins in the USA, Behrman & Rosenzweig (2004) estimate the effect of intrauterine nutrient intake on adult health and earnings and thereby evaluate the effectiveness of programs focused on birth weights increase. They found that differences in birth weights between identical twins can be used to identify the life cycle consequences for physical attributes, schooling, and earnings from increasing foetal nutrient intake.
Another nutrition measurement largely used in the empirical literature is anthropometric indicators (Alderman and Behrman, 2006). Several studies show that low birth weights and a delay in childhood development (height) have an impact on future wages or labour productivity; that taller people tend to be more productive (Deolalikar, 1988; Sahn and Alderman, 1998; Strauss and Thomas, 1998; Huffman and Orazem, Berham, 1999; Chapoto and Jayne, 2008). A study conducted in rural Zimbabwe shows that improved pre-schooler nutritional status, as measured by height for age, is associated with increased height as a young adult, a greater number of grades of completed schooling, and an earlier age at which the child starts school (Alderman & al. 2006). Indonesian women who are 0.5 cm taller due to early-life rainfall shocks complete 0.32 more year of schooling; live in households with 10.4% higher per capita expenditures and 10.0% higher per capita assets (Maccini & Yang,
10
2005). Weil (2007) combines micro and macro data and demonstrates that population height is an important economic development predictor.7
Even though malnutrition indicators remain the most health input used in economic literature, others indicators are utilized such as treatment, life styles and health services. Bleakley (2007) found that areas that had higher levels of malaria or hookworm infection prior to eradication experienced greater increases in school attendance and literacy while Miguel and Kremer (2005) find that giving de-worming medicines to school children improves school participation in Kenya.
If at a micro-level, numerous studies found that poor health have an economic effect through several channels, this effect is less evident at a macro-level. The next section tries to deal with that bias.
4.
Empirical framework analysis
The analysis of the effect of health on economic growth is based on the augmented neoclassical growth equation, which includes the global health status variable as a regressor combined with initial GDP per capita as catch up variable and other exogenous variables.
i ik i
i Health X
y =α+β +δ +ε (1)
Where yi is the annual growth rate of GDP per capita with subscript i designating the 159
potential countries included in our sample (see Appendix A7 for the list of the countries);
Healthi is the global health indicator; Xik the matrix of the k control variables and εi is the
independently and identically distributed error terms; α, β and δ are parameters to be estimated. Moreover regional dummy variables are also included to control for regional specific effects.
Data and variables are presented first and then econometric specification.
4.1.
Data and variables
The data used in this paper are annual averages over the 1999-2004’s period, since our health data are not available apart from these years, and included about 160 WHO member states (see list Table A7). The main thesis of this paper is that macroeconomic effects of the
7
Body Mass Index (BMI measured by weight/height2 and expressed in kg/m2) can also be used. See Thomas & Frankenberg (2002) for more details.
11
global health status are accurately caught by the Disability-Adjusted Life Year (DALY) per capita calculated by the World Health Organization (WHO). This indicator is proposed by the World Bank and WHO since 1993 (the World Bank, 1993). Its represents “a one lost year of healthy life and extends the concept of potential years of life lost due to premature death to include equivalent years of healthy life lost by virtue of being in states of poor health or disability” (WHO, 2008)8. “The sum of these DALYs across the population represents the burden of disease and can be thought of as a measurement of the gap between current health status and an ideal health situation where the entire population lives to an advanced age, free of disease and disability” (WHO, http://www.who.int/healthinfo/global_burden disease/metrics_daly/en/). DALYs were calculated initially for about one hundred causes and diseases and over the whole word (World Bank, 1993) and were not updated since 1999. From1999 to 2004 however, DALYs are also available on a regional basis. DALY figures are commonly used in cost-effectiveness analyses but, to the best of our knowledge, have never been used in macroeconomic analyses since DALYs by country are only available for 2002 and 2004.
Any indicator, including DALYs, is amenable to criticism with a particular emphasis on weighting (namely age and disease severity) and discounting (e.g. Anand and Hanson, 1997). A large revision has been however implemented, mainly by the Institute of Health Metrics, which is in charge DALYs calculations updates and improvements (Lopez et al, 2006). This does not prevent however this indicator from being a serious candidate for representing population global health status, deriving from illness consequences which are taken into consideration in a single indicator.
DALYs are either available for each WHO 14 regions from 1999 to 2002 and 2004 (regional DALY) or for each WHO country (country DALY) only in 2002. Weighting the WHO regional data by the ratio of the country 2002 DALY to regional 2002 DALY allows generating DALY at the country level:9.
8
The DALYs for each health condition are the sum of the years of life lost (YLL) due to premature mortality and the years lost due to disability (YLD) for incident cases of the health condition. YLL are calculated from the number of deaths at each age multiplied by a global standard life expectancy for each age. YLD is the number of incident cases in a particular period × average duration of the disease × weight factor. The weight factor reflects the severity of the disease on a scale from 0 (perfect health) to 1 (death). See WHO (2008).
9 Corrected country DALY in t = regional DALY in t * ( 1 + (country 2002 DALY-regional 2002 DALY)/ regional 2002
12
Corrected Country DALY in t = regional DALY in t * (2002 country DALY / 2002 regional
DALY).
with t = 1999, 2000, 2001, 2002, 2004
This correction which increases the number of periods is valid under the hypothesis that the gap between the DALY per capita of a country and the DALY per capita of the WHO region in which it belongs is constant on the 1999-2004’ period. Such assumption seems rather strong but can be justified when one considers that a country’s health conditions can hardly evolve over a short period
The relation between health and growth is estimated either using Corrected Country DALYs (CCD) or regional DALYs. DALYs calculated with respect to communicable diseases are also considered since communicable diseases, and more specifically, malaria, constitute a large part of the disease burden in low and middle income countries.
We consider several control variablesXk, which are either assumed from the theoretical model or inferred from other cross-country analyses of Solow augmented growth regressions. Initial GDP per capita allows considering conditional convergence when it exhibits a negative effect on growth; annual growth rates of population and investment ratio to GDP have resp. a negative and positive effect on growth (e.g. Mankiw et al. 1992). In addition to the global health indicator, other human capital variables are included. Lagged female school enrollment rates are preferred to male school enrollment as it may also reflect the inequality level that has an impact on growth. Lagged variables may cope with endogeneity bias.
A second group of control variables includes the Government consumption ratio to GDP, openness and inflation rates. The government consumption does not have a clear-cut effect on growth (Barro, 1990). Openness and inflation allows taking economic policy variables with resp. a positive and a negative effect on growth. A variable taken from ICRG allows including institutional quality which positively affects growth.
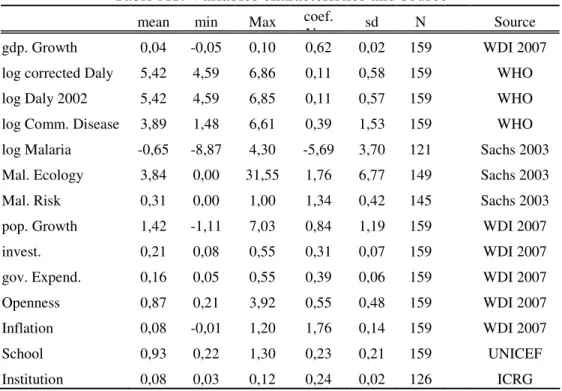
The characteristics of each variable are reported in Table A1, Appendix A. This table is completed by Table A2 in Appendix A which presents the correlations between important variables used in this paper.
13
4.2.
Econometric specification
OLS estimation of equation (1) is potentially biased. First there can be a simultaneity bias between global health status and growth (e.g. Bonnel 2000; Bloom, Canning and Malaney 2000; Sachs et al. 1999, 2003; Strauss and Thomas, 2008; Schultz, 2008). Measurement errors of the global health indicator may also induce biased estimators. To deal with these problems, we draw on instrumental variables techniques and therefore identify two instruments.
The first is malaria ecology developed by Kiszewski and Sachs et al. (2004) and first used for cross-country regressions by Sachs (2003) and Carstensen and Gundlach (2006). Malaria ecology is built upon climatic factors and specific biological properties of each regionally dominant malaria vector which only reflects the forces of biological evolution and is thus independent from present health interventions and economic conditions. Moreover germs likely to be affected by economic conditions or public health interventions (like mosquito abundance, for example) do not enter the calculation of the index (Kiszewski and Sachs et al. 2004; Carstensen and Gundlach 2006).
The other instrument used in this paper is the proportion of each country’s population threatened by a risk of malaria transmission in 1994. This indicator affects current economic growth only through health status and is unlikely affected by current economic conditions.
5.
Econometric results
Equation (1) is estimated with the heteroskedastic-efficient two-step generalized method of moments (IV-GMM) estimator which generates efficient coefficients as well as consistent standard errors estimates. (Hayashi 2000 pp.206-13 and 226-27; Baum et al. 2007).
5.1.
Main results
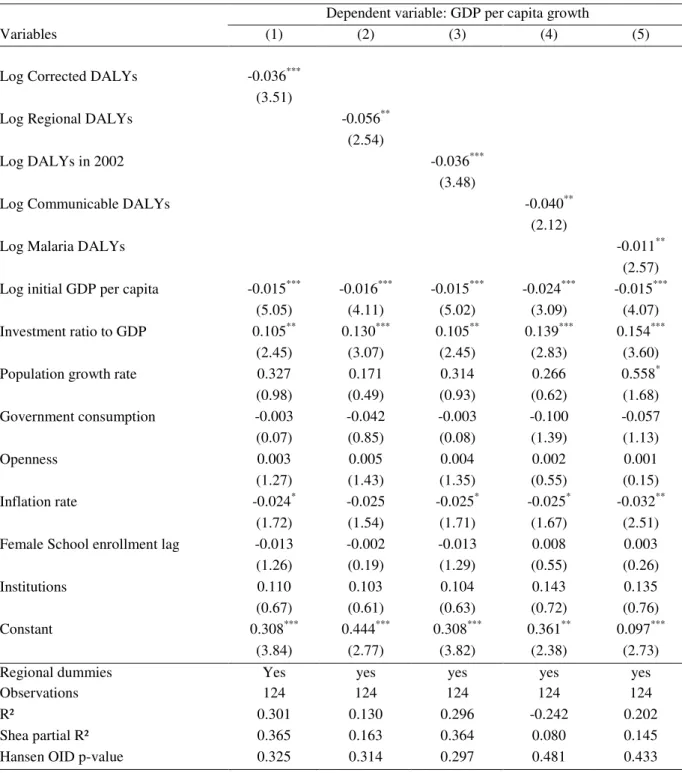
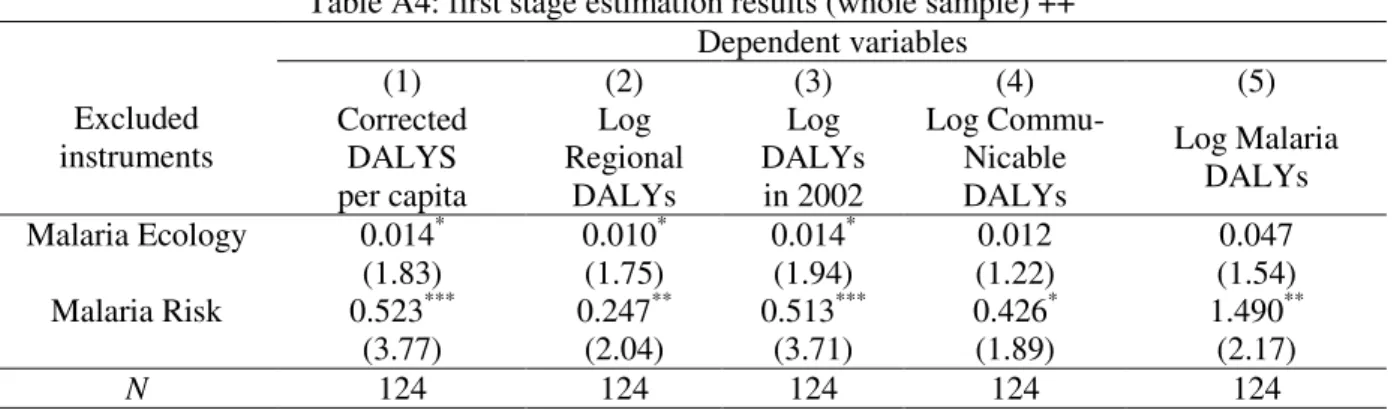
Results of GMM estimations are presented in Table 1 below. The first column reports estimates with corrected DALYs. Our instruments are either validated by the Shea R² and Hansen over-identification test or the first stage estimation results presented Table A4 (Appendix A). Contrary to OLS estimates,10 Health is found to have a negative and statistically significant effect on economic growth thus validating the attenuation bias. This result is robust to variants of DALYs (columns 2 to 4). The effect of communicable diseases DALYs (col. 4) may reflect the importance of communicable diseases in health status in the
10
14
world that are yet now the main causes of DALYs losses in developing and transitional countries. By contrast, the coefficient of DALYs for malaria is lower (-0,011), indicating that malaria is just one among other health main causes.
Table 1. Two-step GMM estimation of economic effects of DALYs per capita
Dependent variable: GDP per capita growth
Variables (1) (2) (3) (4) (5)
Log Corrected DALYs -0.036*** (3.51)
Log Regional DALYs -0.056**
(2.54)
Log DALYs in 2002 -0.036***
(3.48)
Log Communicable DALYs -0.040**
(2.12)
Log Malaria DALYs -0.011**
(2.57) Log initial GDP per capita -0.015*** -0.016*** -0.015*** -0.024*** -0.015***
(5.05) (4.11) (5.02) (3.09) (4.07)
Investment ratio to GDP 0.105** 0.130*** 0.105** 0.139*** 0.154***
(2.45) (3.07) (2.45) (2.83) (3.60)
Population growth rate 0.327 0.171 0.314 0.266 0.558*
(0.98) (0.49) (0.93) (0.62) (1.68) Government consumption -0.003 -0.042 -0.003 -0.100 -0.057 (0.07) (0.85) (0.08) (1.39) (1.13) Openness 0.003 0.005 0.004 0.002 0.001 (1.27) (1.43) (1.35) (0.55) (0.15) Inflation rate -0.024* -0.025 -0.025* -0.025* -0.032** (1.72) (1.54) (1.71) (1.67) (2.51)
Female School enrollment lag -0.013 -0.002 -0.013 0.008 0.003
(1.26) (0.19) (1.29) (0.55) (0.26)
Institutions 0.110 0.103 0.104 0.143 0.135
(0.67) (0.61) (0.63) (0.72) (0.76)
Constant 0.308*** 0.444*** 0.308*** 0.361** 0.097***
(3.84) (2.77) (3.82) (2.38) (2.73)
Regional dummies Yes yes yes yes yes
Observations 124 124 124 124 124
R² 0.301 0.130 0.296 -0.242 0.202
Shea partial R² 0.365 0.163 0.364 0.080 0.145
Hansen OID p-value 0.325 0.314 0.297 0.481 0.433
Note: Health variables are instrumented by Malaria Ecology and Malaria Risk.
***significant at 1%, **significant at 5%, *significant at 10%. Robust t-statistics enter parenthesis. The GMM estimator is preferred than 2SLS in the estimations of the parameters.
15
These results are in conformity with some important previous works (Bloom et al. 2004). They stress that a global health indicator is an important predictor of economic development on a large sample of poor and rich countries. They also underline the importance of the identification strategy in the assessment of the economic effect of health status.
One could argue that explanatory variables such as investment rate and Government expenditure are also endogenous. The endogeneity of these variables comes from the reverse causality since rich countries are able to invest and spend in consumption. To solve for this, we instrument these variables with their value in previous period. The results obtained are summarized in Table 2 and the first stage estimation results are presented in Table A6 Appendix A.
The effect of health indicators remains negative and statistically significant with very similar even though the coefficients.
16
Table 2. Two-step GMM estimation of economic effects of DALYs per capita, instrumenting Government expenditure
Dependent variable: GDP per capita growth gdpgrowth gdpgrowth
Variables (1) (2) (3) (4) (5)
Log Corrected DALYs -0.038***
(3.71)
Log Regional DALYs -0.056***
(2.64)
Log DALYs in 2002 -0.038***
(3.67)
Log Communicable DALYs -0.038**
(2.32)
Log Malaria DALYs -0.011***
(2.79) Log initial GDP per capita -0.016*** -0.017*** -0.016*** -0.024*** -0.016***
(5.26) (4.22) (5.21) (3.42) (4.49)
Investment ratio to GDP 0.058 0.100 0.059 0.149* 0.156**
(0.75) (1.38) (0.77) (1.76) (2.13)
Population growth rate 0.291 0.174 0.275 0.323 0.569*
(0.86) (0.49) (0.81) (0.77) (1.74) Government consumption 0.018 0.009 0.018 -0.044 -0.036 (0.41) (0.16) (0.42) (0.63) (0.66) Openness 0.004 0.006 0.004 0.002 0.001 (1.36) (1.53) (1.43) (0.52) (0.13) Inflation rate -0.025 -0.026 -0.025 -0.025 -0.030** (1.53) (1.51) (1.52) (1.53) (2.10) Female school enrollment lag -0.010 -0.001 -0.010 0.006 0.003 (0.98) (0.12) (1.02) (0.43) (0.23) Institution 0.148 0.113 0.142 0.138 0.154 (0.85) (0.64) (0.82) (0.67) (0.82) Constant 0.334*** 0.443*** 0.333*** 0.339*** 0.094*** (3.95) (2.92) (3.92) (2.64) (2.72) Observations 123 123 123 123 123 R² 0.279 0.126 0.275 -0.192 0.200
Shea partial R² of health variable 0.371 0.177 0.371 0.099 0.168 Shea partial R² of investment 0.440 0.453 0.440 0.452 0.447 Shea partial R² of Gov. Cons. 0.750 0.758 0.749 0.691 0.688
Hansen OID p-value 0.233 0.215 0.211 0.410 0.409
Note: Health variables are instrumented by Malaria Ecology and Malaria Risk. Investment ratio and Government Consumption are instrumented by their lag.
***significant at 1%, **significant at 5%, *significant at 10%. Robust t-statistics enter parenthesis. The GMM estimator is preferred than 2SLS in the estimations of the parameters.
17
5.2.
Robustness analyses
Our previous results relying on the IV technique may still be questioned. First, they may be due to the large health outcome gap between developed and developing countries, and may not satisfactorily explain development levels gaps between developing or developed countries. Secondly, it is relevant to investigate the role of health in the explanation of development differential within countries which share a common characteristic related to poor basic health infrastructures. Equation (1) is therefore estimated on a low and middle-income countries sub-sample of which results are presented in Table 3 and the first stage estimation results are presented in Table A6 Appendix A. They are similar to those obtained for the whole sample, namely, health remains an important determinant of economic growth, even coefficients are smaller than those previously obtained (0,021 against 0,0036 for Corrected DALYs; 0,006 against 0,011 for Malaria DALYs).
18
Table 3: Two-step GMM estimation of economic effects of DALYs per capita, developing countries
Dependent variable: GDP per capita growth
Variables (1) (2) (3) (4) (5)
Log Corrected DALYs -0.021** (2.08)
Log Regional DALYs -0.031*
(1.86)
Log DALYs in 2002 -0.020**
(2.07)
Log Communicable DALYs -0.018*
(1.91)
Log Malaria DALYs -0.006*
(1.72) Log initial GDP per capita -0.013*** -0.012*** -0.013*** -0.012*** -0.010***
(3.43) (3.41) (3.42) (3.31) (3.38) Investment ratio to GDP 0.115** 0.128*** 0.115** 0.139*** 0.150***
(2.51) (2.93) (2.50) (3.38) (3.71)
Population growth rate 0.243 0.251 0.235 0.355 0.414
(0.60) (0.61) (0.58) (0.87) (1.02) Government consumption 0.060 0.038 0.060 0.018 0.018 (1.17) (0.80) (1.16) (0.38) (0.40) Openness -0.009 -0.007 -0.009 -0.011* -0.009 (1.54) (1.13) (1.51) (1.66) (1.62) Inflation rate -0.032** -0.031** -0.032** -0.031** -0.033** (2.22) (2.05) (2.22) (2.26) (2.31) Female school enrollment lag -0.007 -0.002 -0.007 -0.000 -0.004 (0.76) (0.19) (0.78) (0.04) (0.42) Institution 0.147 0.175 0.143 0.212 0.207 (0.90) (1.07) (0.87) (1.31) (1.27) Constant 0.197** 0.251** 0.195** 0.156** 0.054 (2.39) (2.16) (2.37) (2.25) (1.52) Observations 87 87 87 87 87 R² 0.511 0.476 0.509 0.495 0.550 Shea partial R² 0.425 0.236 0.428 0.205 0.243
Hansen OID p-value 0.261 0.262 0.246 0.288 0.202
Note: Health variables are instrumented by Malaria Ecology and Malaria Risk.
***significant at 1%, **significant at 5%, *significant at 10%. Robust t-statistics enter parenthesis. The GMM estimator is preferred than 2SLS in the estimations of the parameters.
19
6.
Concluding remarks
This study contributes to the debate on the relationship between health outcomes and economic performance by paying a particular attention to global health status measurement issues. We argue that, traditional health indicators such as life expectancy and mortality rates are inadequate to explain the overall health status in a population since they present many drawbacks and are devoted to a particular health problem. An accurate health indicator must measure the gap between current health status and an ideal health situation where the entire population lives to an advanced age, free of diseases and disabilities. This aspect is specifically addressed by the disability-adjusted life year (DALY) proposed by the World Bank and WHO. Using this indicator in an augmented Solow growth model, the results show that global health outcomes as well as less aggregated health measurement (communicable diseases and malaria) remain important predictors of economic development. Our results are similar to those found in previous literature, even though they still contradict recent works such as Acemoglu and Robinson’s (2009).
Our results support the idea improving health status is a prerequisite for development, and will contribute to play a role in poverty reduction (Dodd and Cassels, 2006; WHO, 2004). Health issues represent a challenge rather than a handicap. For example reducing malaria prevalence and other communicable diseases by paying more attention to water and sanitation is an effective way to improve growth performances.
20
References
Abegunde D, Stanciole A., (2006), An estimation of the economic impact of chronic non-communicable diseases in selected countries, WHO Working Paper, CHP department. Acemoglu Daron, Johnson Simon, (2009), Disease and Development: The Effect of Life Expectancy on Economic Growth, In: Michael Spence and Maureen Lewis (Eds),
Health and Growth Chapter 4, Commission on Growth and Development.
Alderman, H., Behrman, J.R. (2006), Reducing the incidence of low birth weight in low income countries has substantial economic benefits, World Bank Research Observer, 21(1): 25-48.
Alderman, H., Hoddinott J., Kinsey, B. (2006). “Long-Term Consequences of Early Childhood Malnutrition,” Oxford Economic Papers LVIII (2006), 450-474.
Anand, S., Hanson, K. (1998), DALYs: efficiency versus equity, World Development, 26, 2, 307-310.
Andrés Aguayo-Rico, Iris A. Guerra-Turrubiates, (2005), Empirical Evidence of the Impact of Health on Economic Growth, Political Economy, Vol. 14
Arora, S (2001), Health, Human Productivity, and Long-Term Economic Growth, The
Journal of Economic History, 699-749.
Audibert M (1986), Agricultural non-wage production and health status: a case study in a tropical environment, Journal of Development Economics 24, 275-291.
Audibert M (1997a), La cohésion sociale est-elle un facteur de l’efficience technique des exploitations agricoles en économie de subsistance? Revue d’Economie du
Développement 3, 69-90.
Audibert M (1997b), Technical inefficiency effects among paddy farmers at the ‘Office du Niger’, Mali, West Africa, Journal of Productivity Analysis 8, 379-394.
Audibert M (2009), Issues and Challenges of Measurement of Health: Implications for Economic Research, Health Economic Growth Framework Paper, HEGPR_02, 29p. Audibert M, Etard J-F (1998), Impact of schistosomiasis on rice production and efficiency in
Mali. Journal of African Economies, 7 (2), 185-207.
Audibert, M., Brun, J-F., Mathonnat, J. & Henry, M-C., (2003), Malaria and Property Accumulation in Rice Production Systems in the Savannah Zone of Cote d'Ivoire,
Tropical Medicine and International Health, Vol. 8 , n° 5, p. 471-483
Audibert, M., Brun, J-F., Mathonnat, J. & Henry, M-C., (2006). Malaria, Production and Income of the Producers of Coffee and Cocoa: an Analysis from Survey Data in Côte d’Ivoire. Malaria, coffee and cocoa production and income, CERDI, études et documents, 2006 n° 31
Audibert, M., Brun, J-F., Mathonnat, J. & Henry, M-C., (2009), Effets économiques du paludisme sur les cultures de rente : l’exemple du café et du cacao en Côte d’Ivoire.
Revue d'Economie du Développement, Vol. 23 , n° 1-2, p. 145-166
Audibert, M., Nzeyimana, I., Mathonnat, J. & Henry, M-C., (1999), Rôle du paludisme dans l'efficience technique des producteurs de coton du nord de la Côte d'Ivoire, Revue
21
Barlow R., (1968), The economic effects of malaria eradication, Bureau of Public Health Economics, Research Series 15: 167p.
Barro R., (1992), Economic growth in a cross section of countries, The Quarterly Journal of
Economics, 106, 2, May, 407-443.
Barro R., (1996), Health and Economic Growth, Harvard University, Cambridge, MA.
Barro, R., Lee, J. (1994), Sources of economic growth, Carnegie-Rochester Conference Series on Public Policy 40, 1–46.
Barro, R., Sala-I-Martin X, (1995), Economic Growth. New York: McGraw-Hill.
Baum, C. F., Schaffer, M. E., and Stillman, S. 2007. Enhanced routines for instrumental variables/GMM estimation and testing. Unpublished working paper, forthcoming. Behrman, J. R., Rosenzweig M.R. (2004), The returns to birth weight, Review of Economics
and Statistics, LXXXVI, 586-601.
Bell C, Bruhns R, Gersbach H (2006), Economic growth, education, and AIDS in Kenya,
Policy Research Working Paper 4025, The World Bank, Development Economics.
Bell, C., Devarajan, S., Gersbach, H. (2003), The Long-run Economic Costs of AIDS: Theory and an Application to South Africa. World Bank Economic Review 20(1): 55-89. Berthélemy, J-C, Dessus, S., Varoudakis, A. 1997. Capital humain et croissance: le rôle du
régime commercial. Revue économique, Vol. 48, No. 3, P.P. 419-428.
Bhargava, Alok, Dean T. Jamison, Lawrence J. Lau and Christopher J.L. Murray (2001), Modeling the Effects of Health on Economic Growth, Journal of Health Economics, vol. 20, pp. 423-440.
Bleakley, H (2007), Disease and development: Evidence from hookworm eradication in the American South, Quarterly Journal of Economics, 122, 1, 72-117.
Bloom David E, Canning David, Sevilla Jaypee, (2001), The Effect of Health on Economic Growth: Theory and Evidence, Working Paper 8587.
Bloom David E., Canning David, (2000), Health and Economic Growth: Reconciling the Micro and Macro Evidence, CDDRL Working Paper.
Bloom, D. E., Canning, D., Malaney, P. N. (2000). Demographic change and economic growth in Asia, Population and Development Review, 26(supp.), 257– 290
Bloom, D. E., Williamson, J. G. (1998). Demographic transitions and economic miracles in emerging Asia. World Bank Economic Review, 12(3), 419–455.
Bloom, D., & Sachs, J. (1998). Geography, demography, and economic growth in Africa. Brookings Papers on Economic Activity, 2, 207–273.
Bloom, D., Malaney, P. (1998), Macroeconomic consequences of the Russian mortality crisis,
World Development, 26, 2073–2085.
Bloom, D.E., Canning, D., Sevilla, J (2004), The effect of health on economic growth: A production function approach, World Development, 32, 1, 1-13.
Bonnel, R. (2000). HIV/AIDS: Does it increase or decrease growth in Africa? World Bank,
22
Carstensen Kai and Gundlach Erich, (2006), The Primacy of Institutions Reconsidered: Direct Income Effects of Malaria Prevalence, The World Bank Economic Review, 20, 3. Caselli, F., G. Esquivel, and F. Lefort, (1996), Reopening the Convergence Debate: A New
Look at Cross-Country Growth Empirics. Journal of Economic Growth 1(3): 363–89. Chapoto A., Jayne T.S (2008), Impact of AIDS-Related Mortality on Farm Household
Welfare in Zambia, Economic Development and Cultural Change, 56, 2, 327-374. Chi, W (2008), The role of human capital in China's economic development: Review and new
evidence, China Economic Review, 19, 3, 2008, 421-436.
Christiaensen L, Hoffmann V, Sarris A (2007), Gauging the Welfare Effects of Shocks in Rural Tanzania, Policy Research Working Paper 4406, The World Bank, Africa Region
Commission on Macroeconomics and Health, (2001). Macroeconomics and health: investing in health for economic development. Geneva: WHO.
Cuddington John T. and Hancock John D., (1994), Assessing the Impact of AIDS on the Growth Path of the Malawian Economy, Journal of Development Economics 43, 363-368.
Cuddington, J.T, Hancock, J.D. (1994). Assessing the impact of AIDS on the growth of the Malawian economy, Journal of Development Economics, 43, 363-368.
Cutler. D, Deaton A., Lleras-Muney A. (2006), The Determinants Of Mortality, Journal of
Economic Perspectives, 20, 3, 97-120.
Deaton A. (2006), Global Patterns of Income and Health: Facts, Interpretations, and Policies, NBER Working Paper W12735, National Bureau of Economic Research, Cambridge. Deolalikar A.B (1988), Nutrition and labor productivity in agriculture: Estimates for rural
south India, Review of Economics and Statistics 70, 3, 406-413.
Dodd R. Cassels A (2006), Health, development and the Millennium development goals,
Annals of Tropical Medicine and Parasitology 100, 5&6, 379-387.
Dixion, S., McDonal, S., Roberts, J. (2001), AIDS and economic growth in Africa: a panel data analysis, Journal of International Development, 13, 411-426.
Gallup, J. L., Sachs, J.D. (2001), The economic burden of malaria, The American Journal of
Tropical Medicine and Hygiene, 85-96.
Gallup, J.L, Sachs J.D, Mellinger A.D (1999), Geography and Economic Development,
International Regional Science Review 22(2): 179–232.
Gertler P. and Gruber J. (2002), Insuring Consumption Against Illness, American Economic
Review, 92. 1, 51-70.
Girardin, O., Daoa,D., Koudou, B.G., Essé, C., et al.(2004), Opportunities and limiting factors of intensive vegetable farming in malaria endemic Côte d’Ivoire. Acta Tropica 89, 109–123.
Grossman, M., (1972). On the Concept of Health Capital and the Demand for Health. The
Journal of Political Economy, 80(2), 223-255.
Gupta, I., Mitra, A. (2004), Economic growth, health and poverty: an exploratory study for India, Development Policy Review, 22, 2, 193-206.
23
Hamoudi, A., and J. Sachs, (1999), Economic Consequences of Health Status: A Review of the Evidence. Working Paper no. 30. Harvard Center for International Development, Cambridge, MA.
Hayashi, F. Econometrics. 2000. Princeton: Princeton University Press.
Howitt, P., (2005), Health, Human Capital, and Economic Growth: A Schumpeterian Perspective. in G. López-Casasnovas, B. Rivera, & L. Currais, ed. Health and
economic growth: findings and policy implications. Cambridge MA: MIT Press, p. 19-40.
Jack W, Lewis M (2009), Health investments and economic growth: Macroeconomic evidence and microeconomic foundations, in Michael Spence and Maureen Lewis (Eds), Health and Growth Chapter 1, Commission on Growth and Development. Kang J.M (2006), An estimation of growth model for South Korea using human capital
Journal of Asian Economics 17, 5, 852-866.
Knowles, S. and Owen, P.D., 1994, Health Capital and Cross-country variation in income per capita in the Mankiw-Romer-Weil model, Economics Letter, vol. 48(1), 99-106
Kwack S.Y, Lee Y.S (2006), Analyzing the Korea's growth experience: The application of R&D and human capital based growth models with demography, Journal of Asian
Economics, 17, 5, 818-831.
Lains P (2003), Catching up to the European core: Portuguese economic growth, 1910–1990,
Explorations in Economic History 40, 369–386.
Li H, Huang L (2009), Health, education, and economic growth in China: Empirical findings and implications, China Economic Review, 20, 3, 374-387.
Liu GG., Dowb W.H., Fuc A.Z., Akin J., Lance P. (2008), Income productivity in China: On the role of health, Journal of Health Economics 27, 1, 27-44.
Lopez AD, Mathers CD, Ezzati M, Murray CJL, Jamison DT (2006), Global burden of disease and risk factors, New York, Oxford University Press, 2006.
Lorentzen, P., McMillan, J., & Wacziarg, R. (2005). Death and development. NBER Working Paper 11620.
Lucas, Robert, (1988). On the Mechanics of Economic Development, Journal of Monetary Economics, Vol. 22 (1), 3-42.
Maccini, Sharon, and Dean Yang, “Returns to Health: Evidence from Exogenous Height Variation in Indonesia,” Working Paper, Ford School of Public Policy, University of Michigan, 2005.
Mankiw, N.G., Romer, D. & Weil, D.N., (1992), A Contribution to the Empirics of Economic Growth. The Quarterly Journal of Economics, 107(2), 407-437.
Mayer, D. (2001). The Long term impact of health of economic growth. World Development, 1025-1031.
McCarthy FD, Wolf H, Wu Y (2000), Malaria and Growth, Policy Research Working Paper
2303, The World Bank.
McDonald S., Roberts J. (2006), AIDS and economic growth: A human capital approach,
24
Miguel, E., Kremer M (2004), Worms: Identifying Impacts on Education and Health in the Presence of Treatment Externalities, Econometrica, LXXII (2004), 159-217.
Murray C.J.L, Frenk J (2008), Health metrics and evaluation: strengthening the science, Lancet 371, 1191-1199.
Murray C.J.L. (2007), Good practices for health statistics: lessons from the Millennium Development Goal health indicators, Lancet 369, 862-873.
Muysken, J., Yetkiner, I.H. & Ziesemer, T., (2003). Health, labour productivity and growth. In H. Hagemann & S. Seiter, ed. Growth Theory and Growth Policy. Routledge Studies in International Business and the World Economy. London: Routlledge, p. 187–205.
Mwabu, G. (2007), Health Economics for Low-Income Countries, in T. P. Schultz & J. A. Strauss, ed. Handbook of Development Economics. Amsterdam: Elsevier North Holland, 3305-3374.
Over M (1992), The macroeconomic impact of AIDS in Sub-Saharan Africa, AFTPN Technical Working Paper, Population, Health and Nutrition Division, Africa Technical Department, Washington D.C, World Bank.
Packard, R. M. (2009), Roll back malaria, roll in development? Reassessing the economic burden of malaria, Population & Development Review, 35(1), 53-87.
Preston, S.H. (1975), The Changing Relation between Mortality and Level of Economic Development, Population Studies, 29, 2, 231-248.
Ranis, G., Stewart, F., Ramirez, A. (2000), Economic growth and human Development,
World Development, 28, 197-219.
Sachs J, Malaney P (2002), The economic and social burden of malaria, Nature, 415(6872), 680-685.
Sachs Jeffrey D., (2003), Institutions Don’t Rule: Direct Effects of Geography on Per Capita Income, Working Paper 9490.
Sachs, J., and A. Warner, (1997), Sources of Slow Growth in African Economies, Journal of
African Economics 6(3): 335—76.
Sahn D, Alderman H (1988), The effect of human capital on wages and the determinants of labor supply in a developing country, Journal of Development Economics, 29, 157-83. Sala-i-Martin, X., Doppelhofer, G. & Miller, R.I., (2004), Determinants of Long-Term
Growth: A Bayesian Averaging of Classical Estimates (BACE) Approach. The
American Economic Review, 94(4), 813-835.
Schultz T.P, (2008), Health Human Capital and Economic Development, Paper presented at the African Economic Research Consortium Biannual Workshop, Plenary session, November, Nairobi, Kenya.
Schultz T.P, Tansel A. (1997), Wage and labor supply effects of illness in Cote d'Ivoire and Ghana: instrumental variable estimates for days disabled, Journal of Development
Economics 53, 251-286.
Stokey N.L (1991), Human capital, product quality and growth, The Quarterly Journal of
25
Strauss J, Thomas D (2007), Health over the life course, in T. Paul Schultz and J Strauss (eds.), Handbook of Development Economics, vol 4, Chapter 54, Amsterdam: North Holland, 3375-3474.
Strauss J, Thomas D (2008), Health over the life course, in T.P Schultz and J. Strauss (Eds),
Handbook of Development Economics, Vol 4 of K.J. Arrow and M.D. Intriligator (Eds), Handbooks in Economics 9, 3378-3469.
Strauss J. (1986), Does better nutrition raise farm productivity? Journal of Political Economy 94, 297-320.
Thomas D (2009), The causal effect of health on social and economic prosperity: Methods and findings, Health Economic Growth Framework Paper, HEGPR_07.
Thomas & Frankenberg (2002), Health, Nutrition, and Prosperity: A Microeconomic Perspective, Bulletin of the World Health Organization LXXX, 106-113.
Van Zon, A. & Muysken, J., 2001. Health and endogenous growth. Journal of Health
Economics, 20(2), 169-185
Van Zon, A. & Muysken, J., 2005. Health as a principal determinant of economic growth. in G. López-Casasnovas, B. Rivera, & L. Currais, ed. Health and Economic Growth.
Findings and Policy Implications. Cambridge MA: MIT Press, p. 41–63.
Weil, D., (2010), Endemic Diseases and African Economic Growth: Challenges and Policy Responses, Journal of African Economies, 19, 3, 81-109.
Weil, D., (2007), Accounting for the Effect of Health on Economic Growth. The Quaterly Journal of Economics, vol. 122, N°3, 1265- 1306.
Weisbrod B.A, Helminiak T.W. (1977), Parasitic Diseases and Agricultural Labor Productivity Economic Development and Cultural Change, 25, 3, 505-522.
World Bank (1993), World development report: Investing in health, New York, Oxford University Press for the World Bank.
World Health Organization (WHO), (2008), The Global Burden of Disease, 2004 update. Geneva, Switzerland: World Health Organization.
World Health Organization (WHO), (2004), PRSPs: Their Significance for Health: second synthesis report, WHO/HDP/PRSP/04.1, 28p.
26
Appendix A
Table A1: Variables characteristics and source
mean min Max coef.
Var. sd N Source gdp. Growth 0,04 -0,05 0,10 0,62 0,02 159 WDI 2007 log corrected Daly 5,42 4,59 6,86 0,11 0,58 159 WHO log Daly 2002 5,42 4,59 6,85 0,11 0,57 159 WHO log Comm. Disease 3,89 1,48 6,61 0,39 1,53 159 WHO log Malaria -0,65 -8,87 4,30 -5,69 3,70 121 Sachs 2003 Mal. Ecology 3,84 0,00 31,55 1,76 6,77 149 Sachs 2003 Mal. Risk 0,31 0,00 1,00 1,34 0,42 145 Sachs 2003 pop. Growth 1,42 -1,11 7,03 0,84 1,19 159 WDI 2007
invest. 0,21 0,08 0,55 0,31 0,07 159 WDI 2007
gov. Expend. 0,16 0,05 0,55 0,39 0,06 159 WDI 2007 Openness 0,87 0,21 3,92 0,55 0,48 159 WDI 2007 Inflation 0,08 -0,01 1,20 1,76 0,14 159 WDI 2007
School 0,93 0,22 1,30 0,23 0,21 159 UNICEF
Institution 0,08 0,03 0,12 0,24 0,02 126 ICRG
Table A2: Correlation between the main variables
GDP growth
Corrected
Daly Investment Pop.growth
Gov.
Expend. Openness Inflation
Corrected Daly 0.04 1 fbcf 0.27*** -0.16** 1 pop.growth 0.03 0.47*** -0.18** 1 Gov. Expend. -0.24*** -0.21*** 0.12 -0.11 1 openness 0.11 -0.23*** 0.25*** -0.13* 0.19** 1 inflation -0.18** 0.24*** -0.16** -0.02 -0.06 -0.08 1 school -0.12 -0.55*** 0.15** -0.41*** 0.10 0.17** 0.02
27 Table A3: OLS estimation of the economic effects of health status
Dependent variable: GDP per capita growth
Variables (1) (2) (3) (4) (5)
Log Corrected DALYs -0.009
(1.39)
Log Regional DALYs -0.001
(0.15)
Log DALYs in 2002 -0.008
(1.29)
Log Communicable DALYs 0.001
(0.16)
Log Malaria DALYs -0.002
(1.34) Log initial GDP per capita -0.008*** -0.006*** -0.008*** -0.006** -0.008***
(3.42) (2.74) (3.35) (2.46) (3.56)
Investment ratio to GDP 0.130*** 0.141*** 0.131*** 0.141*** 0.142***
(3.25) (3.55) (3.26) (3.57) (3.61)
Population growth rate 0.282 0.259 0.277 0.257 0.324
(1.24) (1.14) (1.22) (1.12) (1.40) Government consumption -0.008 -0.013 -0.009 -0.012 -0.019 (0.21) (0.33) (0.22) (0.29) (0.47) Openness 0.004 0.004 0.004 0.004 0.003 (1.02) (1.10) (1.04) (1.12) (0.90) Inflation rate -0.032** -0.034*** -0.032** -0.035*** -0.034*** (2.46) (2.64) (2.48) (2.68) (2.65)
Female school enrollment lag -0.005 -0.004 -0.005 -0.004 -0.003
(0.49) (0.34) (0.48) (0.36) (0.24)
Institution 0.050 0.030 0.047 0.026 0.047
(0.36) (0.21) (0.34) (0.19) (0.34)
Constant 0.103* 0.045 0.099* 0.033 0.046*
(1.95) (0.76) (1.86) (0.94) (1.93)
Regional dummy yes yes yes yes yes
Observations 126 126 126 126 126
R² 0.394 0.384 0.393 0.384 0.393
***significant at 1%, **significant at 5%, *significant at 10%. Robust t-statistics enter parenthesis Health variable is represented by corrected DALYs (column 1), WHO regional level DALYs (columns 2), country level 2002 DALYs (columns 3), DALYs for communicable diseases (column 4) and DALYs for malaria (column 5).
28 Table A4: first stage estimation results (whole sample) ++
Dependent variables (1) (2) (3) (4) (5) Excluded instruments Corrected DALYS per capita Log Regional DALYs Log DALYs in 2002 Log Commu- Nicable DALYs Log Malaria DALYs Malaria Ecology 0.014* 0.010* 0.014* 0.012 0.047 (1.83) (1.75) (1.94) (1.22) (1.54) Malaria Risk 0.523*** 0.247** 0.513*** 0.426* 1.490** (3.77) (2.04) (3.71) (1.89) (2.17) N 124 124 124 124 124
Note: ***significant at 1%; **significant at 5%; *significant at 10%. t-statistics in parenthesis. ++ We show only the coefficients of the instruments, but all the exogenous variables are included in the regressions
Table A5: First stage estimation results (health, investment and Gover. Consump. variables instrumented) ++ Dependent variables (1) (4) (5) (6) (7) (2) (3) instruments Corrected DALYS per capita Log Regional DALYs Log DALYs in 2002 Log Communicable DALYs Log Malaria DALYs Investment ratio Government Consumption Malaria Ecology 0.012* 0.011* 0.013* 0.014 0.049 0.001 -0.001 (1.66) (1.77) (1.76) (1.36) (1.52) (0.82) (0.85) Malaria Risk 0.563*** 0.261** 0.554*** 0.468** 1.647** -0.016 0.010 (4.25) (2.13) (4.19) (2.04) (2.35) (0.96) (0.87) Investment lag -0.018 0.223 -0.028 1.390 5.326* 0.637*** 0.026 (0.04) (0.48) (0.06) (1.31) (1.82) (7.93) (0.53) Govern. Consump. lag 0.706 0.218 0.740 -0.836 -2.688 -0.011 0.831 *** (1.41) (0.42) (1.48) (0.70) (0.90) (0.15) (15.55) N 123 123 123 123 123 123 123
Note: ***significant at 1%; **significant at 5%; *significant at 10%. t-statistics in parenthesis.
29 Table A6: first stage estimation results (Developing countries) ++
(1) (2) (3) (4) (5) Instruments Corrected DALYS per capita Log Regional DALYs Log DALYs in 2002 Log Communicable DALYs Log Malaria DALYs Malaria_Ecology 0.009 0.008 0.010 0.012 0.056 (1.42) (1.26) (1.56) (1.06) (1.64) Malaria Risk 0.652*** 0.364*** 0.646*** 0.697*** 1.454** (5.85) (2.66) (5.87) (2.82) (2.15) Observations 87 87 87 87 87
Note: ***significant at 1%; **significant at 5%; *significant at 10%. t-statistic in parenthesis.
30
Table A7: List of countries
country list
Albania Ghana Panama
Algeria Greece Papua New Guinea
Argentina Grenada Paraguay
Armenia Guatemala Peru
Australia Guinea Philippines
Austria Guinea-Bissau Poland
Azerbaijan Guyana Portugal
Bahrain Haiti Romania
Bangladesh Honduras Russian Federation
Belarus Hungary Rwanda
Belgium Iceland Saudi Arabia
Belize India Senegal
Benin Indonesia Seychelles
Bhutan Iran, Islamic Rep. Sierra Leone
Bolivia Ireland Singapore
Bosnia and Herzegovina Israel Slovak Republic
Botswana Italy Slovenia
Brazil Jamaica Spain
Bulgaria Japan Sri Lanka
Burkina Faso Jordan St. Kitts and Nevis
Burundi Kazakhstan St. Lucia
Cambodia Kenya St. Vincent and the Grenadines
Cameroon Korea, Rep. Sudan
Canada Kuwait Suriname
Cape Verde Kyrgyz Republic Swaziland Central African Republic Latvia Sweden
Chad Lebanon Switzerland
Chile Lesotho Syrian Arab Republic
China Liberia Tajikistan
Colombia Lithuania Tanzania
Comoros Luxembourg Thailand
Congo, Dem. Rep. Macedonia, FYR Togo
Congo, Rep. Madagascar Tonga
Costa Rica Malawi Trinidad and Tobago
Cote d'Ivoire Malaysia Tunisia
Croatia Maldives Turkey
Cyprus Mali Uganda
Czech Republic Malta Ukraine
Denmark Mauritania United Arab Emirates
Djibouti Mauritius United Kingdom
Dominica Mexico United States
Dominican Republic Moldova Uruguay
Ecuador Mongolia Uzbekistan
Egypt, Arab Rep. Morocco Vanuatu El Salvador Mozambique Venezuela, RB
Eritrea Namibia Vietnam
Estonia Nepal Yemen, Rep.
Ethiopia Netherlands Zambia
Fiji New Zealand Zimbabwe
Finland Nicaragua
France Niger
Gabon Nigeria
Gambia, The Norway
Georgia Oman
31
Table A8: Literature review on the effect of health on economic growth
Study year Health measure
Coeffient (standard error)
data Estimator Journal Other covariates
Barro and Lee 1994 Life expectancy 0.073 (0.013) Two periods n=85 for 1965–75, n=95 for 1975–85
SUR with country random effects
Harvard University, Cambridge, MA
02138, USA
Male and female secondary schooling, I/GDP, G/GDP, log(1+black market premium), revolutions Cuddington John T. and Hancock John D. 1994 AIDS 0.2- 0.3% points lost in the medium case and 1.2- 1.5 in the lower case Each five year age cohort from 1985-2010 in Malawi simulation Journal of Development Economics 43, 363-368 Na Barro and Sala IMartin 1995 Life expectancy 0.058 (0.013) Two periods n=87 for 1965–75, n=97 for 1975–85
SUR with country random effects
New York: McGraw-Hill
Male and female secondary and higher education, log(GDP) · human capital, public spending on education/ GDP, investment/GDP, government consumption/GDP, log(1+black market premium), political instability, growth rate in terms of trade Barro 1996 Life expectancy 0.042 (0.014) Three periods 1965–75, n=80; 1975– 85, n=87; 1985–90, N=84 3SLS using lagged values of some regressions as instruments, period random effects NBER working paper series
Male secondary and higher schooling, log(GDP) · male schooling, log fertility rate, government consumption ratio, rule of law index, terms of trade change, democracy index, demo- cracy index squared, inflation rate, continental dummies Caselli, Esquivel, and Lefort 1996 Life expectancy -0.001 (0.032) 25-year panel at 5-year intervals, 1960–85, n=91 GMM (Arellano- Bond method) Journal of Economic Growth, 1, 363-389.
Male and female schooling, I/GDP, G/GDP, black market premium, revolutions Life expectancy 45.48 (2.60) Sachs and Warner 1997 life expectancy squared -5.40 (2.41) 25-year cross-section, N=79 OLS Journal of African Economies, December 1997, Volume 6, Number 3, pp. 335-376 Openness, openness xlog(GDP), land-locked, government saving, tropical climate, institutional quality, natural resource exports, growth in economically active population minus population growth