HAL Id: hal-03229735
https://hal.sorbonne-universite.fr/hal-03229735
Submitted on 19 May 2021
HAL is a multi-disciplinary open access
archive for the deposit and dissemination of
sci-entific research documents, whether they are
pub-lished or not. The documents may come from
teaching and research institutions in France or
abroad, or from public or private research centers.
L’archive ouverte pluridisciplinaire HAL, est
destinée au dépôt et à la diffusion de documents
scientifiques de niveau recherche, publiés ou non,
émanant des établissements d’enseignement et de
recherche français ou étrangers, des laboratoires
publics ou privés.
late-life depressive symptoms: cross-cohort variation and
moderation by urbanicity degree
Milagros Ruiz, Marielle Beenackers, Dany Doiron, Asli Gurer, Aliou Sarr,
Nazmul Sohel, Erik Timmermans, Rita Wissa, Basile Chaix, Martijn
Huisman, et al.
To cite this version:
Milagros Ruiz, Marielle Beenackers, Dany Doiron, Asli Gurer, Aliou Sarr, et al.. Gender, marital and
educational inequalities in mid- to late-life depressive symptoms: cross-cohort variation and
modera-tion by urbanicity degree. Journal of Epidemiology and Community Health, BMJ Publishing Group,
2021, 75 (5), pp.442-449. �10.1136/jech-2020-214241�. �hal-03229735�
Gender, marital and educational inequalities in mid- to
late-life depressive symptoms: cross-cohort variation
and moderation by urbanicity degree
Milagros A Ruiz
,
1Marielle A Beenackers,
2Dany Doiron,
3Asli Gurer,
3Aliou Sarr,
3Nazmul Sohel,
4,5Erik J Timmermans
,
6Rita Wissa,
3Basile Chaix,
7Martijn Huisman,
6,8Steinar Krokstad
,
9,10Ruzena Kubinova,
11So
fia Malyutina,
12,13Parminder Raina,
4,5Abdonas Tamosiunas,
14,15Frank J van Lenthe,
2,16Martin Bobak
1ABSTRACT
Background Although ageing populations are increasingly residing in cities, it is unknown whether depression inequalities are moderated by urbanicity degree. We estimated gender, marital and educational inequalities in depressive symptoms among older European and Canadian adults, and examined whether higher levels of urbanicity, captured by population density, heightened these inequalities.
Methods Harmonised cross-sectional data on 97 826 adults aged≥50 years from eight cohorts were used. Prevalence ratios (PRs) were calculated for probable depression, depressed affect and depressive symptom severity by gender, marital status and education within each cohort, and combined using random-effects meta-analysis. Using a subsample of 73 123 adults from six cohorts with available data on population density, we tested moderating effects measured by the number of residents per square kilometre.
Results The pooled PRs for probable depression by female gender, unmarried or non-cohabitating status and low education were 1.48 (95% CI 1.28 to 1.72), 1.44 (95% CI 1.29 to 1.61) and 1.29 (95% CI 1.18 to 1.41), respectively. PRs for depressed affect and high symptom severity were broadly similar. Except for one Dutch cohort withfindings in an unexpected direction, there was no evidence that population density modified depressive symptom inequalities.
Conclusions Despite cross-cohort variation in gender, marital status and educational inequalities in depressive symptoms, there was weak evidence that these inequalities differed by levels of population density.
INTRODUCTION
Globally, years lived with disability owing to depres-sive disorders increased by 38% from 1990 to 2010.1 2Major depressive disorder (MDD) occurs in 1–5% of adults aged ≥65 years worldwide; and clinically significant depressive symptoms, which fall below the diagnostic criteria for MDD, afflict 15% of adults aged ≥65 years.2 Being female, unmarried/divorced/widowed, and having low edu-cation are potent risk factors for depressive disor-ders in later life.3–5 Prior studies, however, have shown that these depression inequalities vary between countries,6–8which may be attributable to differences in social environments.
Parallel to the rise of mid- to late-life depression, the share of the global population living in cities rose from 43% to 54% from 1990 to 2014, and will reach 66% by 2050. As the pace of urbanisation has accelerated, mental disorders have increased among city dwellers.9Recent findings indicate that depression risk is 44% higher in older urban adults than in rural counterparts in developed countries.2 The impact of these urban–rural differences are con-siderable, since 43% of older adults from developed societies currently reside in cities.10
Gender, marital status and education, on the one hand,3–5and urban living,2on the other hand, have been extensively studied in relation to mid- to late-life depression. Despite the growing importance of the urbanised world for ageing populations, to our knowledge, no study has examined whether urba-nicity, defined as the presence of conditions specific to urban areas,9interacts with older adults’ posi-tion in society to influence their mental health. First, older people’s safety in cities, where injuries and crime are rampant,9is associated with psycho-logical distress, but effects appear twice as high in older women compared to older men.11 Second, social relationships, which protect against mid- to late-life depression, appear weaker at higher levels of population density. Social cohesion and collec-tive efficacy seem weaker in more dense commu-nities, and older adults living in these areas tend to have more numerous, but less intimate, personal relationships.12The social integration of older sin-gletons and widowers may be poorer in more urba-nised settings.8Third, although dense cities often have better service environments than smaller cities and non-urban areas,9 health and social services can often be overburdened, which could unequally affect socially disadvantaged adults.
Since mid- to late-life depression inequalities in different settings may vary by urbanicity degree, we measured cross-sectional associations of gender, marital status and education with depressive symp-toms among older adults in Europe and Canada, and tested whether population density, a marker of urbanicity,9modified the hypothesised inequalities. As urbanicity refers to the conditions which are far more predominant in urban areas than non-rural areas,9population density is often used to examine the impact of urban living on health.13
To cite: Ruiz MA,
Beenackers MA, Doiron D, et al. J Epidemiol Community Health 2021;75:442–449.
►Supplemental material is published online only. To view please visit the journal online (http://dx.doi.org/10.1136/ jech-2020-214241). For numbered affiliations see end of article.
Correspondence to
Milagros A Ruiz, Research Department of Epidemiology and Public Health, University College London, 1-19 Torrington Place, London WC1E 7HB, UK; m. a. ruiz@ ucl. ac. uk
Received 3 April 2020 Revised 13 July 2020 Accepted 28 July 2020 Published Online First 5 November 2020
© Author(s) (or their employer(s)) 2021. Re- use permitted under CC BY. Published by BMJ.
on May 19, 2021 by guest. Protected by copyright.
METHODS Study populations
Harmonised data from the Promoting Mental Well-being in the Ageing Population: Determinants, Policies and Interventions in European Cities (MINDMAP) project from eight cohort studies14were analysed (in descending analytic sample size): the Canadian Longitudinal Study on Aging15(CLSA, n=45 782); the Nord-Trøndelag Health Study16(HUNT, n=23 571); the Russian (HAPIEE-RU, n=7766), Czech (HAPIEE-CZ, n=6726) and Lithuanian (HAPIEE-LT, n=6239) cohorts from the Health, Alcohol and Psychosocial factors In Eastern Europe multi-country study17; the Residential Environment and CORonary
heart Disease study18 (RECORD, n=3706); and the
Longitudinal Aging Study Amsterdam19first (LASA-1, n=3041) and second (LASA-2, n=995) cohorts.
The analytic sample (n=97 826) comprised adults aged≥50 years with complete data on depressive symptoms, gender, mar-ital status and education plus covariates at Wave 1 for all cohorts except HUNT (Wave 2). An analytic subsample (n=73 123) also comprised adults aged≥50 years with the aforementioned data plus information on population density from six studies at Wave 1 (CLSA=45 782; RECORD=3706), Wave 2 (HAPIEE-CZ=1241; LASA-2=835), Wave 3 (HUNT=20 566) or Wave 5 (LASA-1=993). Selection criteria of both samples are depicted in flow diagrams (online supplemental figure S1).
Depressive symptoms
Four depression screening scales designed for general populations, including older adults, were administered across cohorts: the Center for Epidemiological Studies Depression (CES-D) scale —10-item version (CLSA-COP,20CLSA-TRA20and HAPIEE-LT21) and the CES-D 20-item version22(HAPIEE-RU, HAPIEE-CZ, LASA-1 and LASA-2), the 7-item depression sub-scale from the Hospital Anxiety and Depression Scale23(HADS-D) (HUNT) and the
13-item Questionnaire of Self-Evaluated Depressive
Symptomatology24 (QD2A) (RECORD). Depressive symptom
scores were used to derive study-specific measures of probable depression and depressive symptom severity. Probable depression was based on whether participants had elevated depressive symp-toms at or above the threshold for the specific CES-D 10,20 21 CES-D 20,25HADS-D23 26and QD2A24scores. Since higher scores are intended to reflect higher depression risk, scores were split into study-specific tertiles denoting low, moderate or high severity. Depressed affect was based on whether participants reported feel-ing sad, depressed or downhearted. Online supplemental table S1 reports the retrospective data harmonisation performed to derive these outcomes.
Covariates
Covariates included age, age squared, gender, marital or cohabita-tion status, and educacohabita-tion classified as high (postsecondary non-tertiary or higher, ISCED 4–8) or low (upper secondary or lower, ISCED 0–3), using the International Standard Classification of Education (ISCED 2011).27Self-rated health was also included as a confounder to control for potential country differences in report-ing behaviour.28 Population density of participants’ residence, defined as the number of residents per square kilometre, was matched the studies’ examination period as closely as feasibly pos-sible: 2016 data were linked to CLSA Wave 1 (2010–2015), 2011 data to HAPIEE-CZ Wave 2 (2006–2008), 2009 data to RECORD Wave 1 (2007–2008) and 2006 data to HUNT Wave 3 (2006–-2008) as well as LASA-1 Wave 5 and LASA-2 Wave 2 which were concurrently examined in 2005–2006. Population density data
were provided by Statistics Canada (CLSA), Statistics Netherlands (LASA-1 and LASA-2), Statistics Norway (HUNT), the Czech Statistical Office (HAPIEE-CZ) and the National Institute of Statistics and Economic Studies (RECORD), which were calculated at the census subdivision level (CLSA), municipality level (HUNT and RECORD) and neighbourhood level (in the remaining cohorts).
Statistical analyses
Prevalence proportions of depressive symptoms were directly age-standardised using the WHO 2013 European Standard Population, and estimated by gender, marital status and education in each cohort. Generalised linear models with a binomial family distribu-tion and log link funcdistribu-tion calculated prevalence ratios (PRs) for probable depression and depressed affect. Multinomial logistic regression calculated odds ratios for moderate and high versus low symptom severity, which were converted into PRs.29 For each outcome, cohort-specific PRs were calculated using a one-step approach that adjusted for gender, marital status, education, plus age, age squared and self-rated health. Cohort-specific PRs by gender, marital status and education were combined to calculate pooled PRs by each determinant using random-effects meta-analysis. The I2 statistic described the proportion of between-cohort heterogeneity in associations that are not attributable to sampling variation.
In addition, we tested whether population density modified the associations described earlier in the subsample of six cohorts using two-way interaction terms between each determinant and population density. Effects were assessed for every 1000 increase in residents per square kilometre in all cohorts except for HUNT, where effects were quantified for every 10 residents per square kilometre since the maximum population density was 32 resi-dents per square kilometre.
Cohort-specific analyses and meta-analyses were conducted using R Studio and Stata 15, respectively. CLSA analyses incor-porated sampling weights to reflect the Canadian population aged 45–85 years.15
RESULTS
Women comprised over half of the cohort samples, except in RECORD (36.2%) (table 1). The share of unmarried/non-cohabitating adults ranged from 16.2% (HUNT) to 36.3% (LASA-1). Adults having low education ranged from 29% in CLSA to 88% in LASA-1, reflecting generational differences in formal education as these cohorts were born in 1960 or earlier, and 1942 or earlier, respectively. Age-standardised prevalence of probable depression and depressed affect in the Lithuanian and Russian HAPIEE cohorts ranged from 29.1% to 32.3% and from 18.8% to 34.1%, respectively, compared to <5% in HUNT. Urbanicity was highest in RECORD as half of the sample lived in areas with 10 829 residents per square kilometre. Median population density ranged from 4700 to 5200 in the LASA cohorts, and fell to
2000 and 1000 km2 residents in HAPIEE-CZ and CLSA,
respectively. Population density was remarkably low in HUNT with a median of 13 residents per square kilometre.
Differences in age-standardised prevalence of depressive symptoms
Women, unmarried/non-cohabitating adults and adults with low educational attainment reported a greater prevalence of probable depression, depressed affect (table 2) and depressive symptom
on May 19, 2021 by guest. Protected by copyright.
severity (online supplemental table S2), although the differences in prevalence by gender, marital status and education varied between cohorts.
The exception was HUNT, where high symptom severity was slightly more prevalent in men than in women. Prevalence differ-ences among women relative to men were particularly high in HAPIEE-RU: 19% for probable depression and high symptom severity and 12% for depressed affect.
Prevalence differences between marital/cohabitating groups were again smallest in HUNT, and greatest at over 20% in HAPIEE-LT for probable depression and depressed affect. For high symptom severity, the differentials were high in the LASA cohorts (24–30%) and HAPIEE-LT (24%).
Educational inequalities were seen in all cohorts. For probable depression, prevalence differences by education were the largest in HAPIEE-LT at 20.76% in higher vs 34.91% in less educated adults.
PRs of depressive symptoms
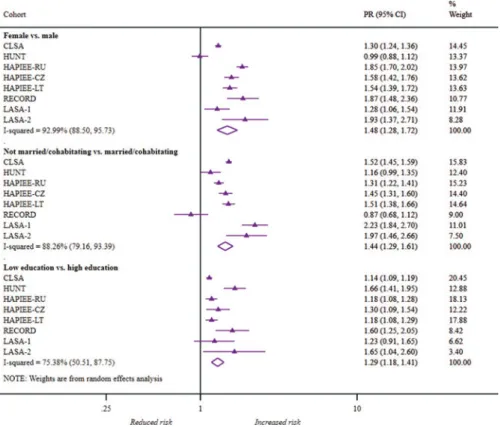
Cohort-specific and pooled PRs in probable depression (figure 1), depressed affect (figure 2) and depressive symptom severity (online supplemental figures S2 and S3) are displayed in forest plots. After mutually adjusting for gender, marital status and edu-cation plus age and self-rated health, the PRs of depressive
symptoms remained significantly higher in women, unmarried/ non-cohabitating adults and those with low education.
Overall, women were 1.48 times more likely to have probable depression than men. The pooled PRs among women were mar-ginally higher for affect and slightly lower for high symptom severity. Cohort-specific PRs were comparable across all settings except in HUNT for probable depression and symptom severity. Across cohorts, unmarried/non-cohabitating adults were 1.44 and 1.47 times more likely to have probable depression and depressed affect than married counterparts, respectively. The
PR for high symptom severity among
unmarried/non-cohabitating adults was somewhat lower at 1.33. However, mar-ital status was weakly associated with depression risk in RECORD and HUNT, compared to other cohorts.
The combined PRs by low education ranged from 1.16 for high symptom severity to 1.29 for probable depression. Compared to cohort-specific PRs by gender and marital status, cohort-specific PRs by education were greater than 1 in all eight studies for the three outcomes.
Depressive symptom associations with education were most consistent between cohorts. Although the I2percentage of 75.38 represented considerable cohort variation for probable depres-sion, there was weak evidence of substantial heterogeneity for depressed affect (65.64, 95% CI 26.97 to 83.83), as well as for moderate (23.58, 95% CI 0.00 to 65.02) and high (53.92, 95% Table 1 Study-specific characteristics of analytic cohort samples
Main analytic sample (n=97 826)
Country and cohort
CA NO RU CZ LT FR NL NL
CLSA HUNT HAPIEE HAPIEE HAPIEE RECORD LASA-1 LASA-2
Number of participants 45 782 23 571 7766 6726 6239 3706 3041 995
Data collection wave (year) Wave 1
(2010–2015) Wave 2(1995–1997) Wave 1(2002–2005) Wave 1(2002–2005) Wave 1(2006–2008) Wave 1(2007–2008) Wave 1(1992–1993) Wave 1(2002–2003) Mean years of age (SD) 62.4 (9.3) 64.3 (10.0) 59.8 (5.8) 59.7 (5.8) 62.2 (6.3) 59.7 (7.1) 70.2 (8.8) 59.4 (3.0)
Female, % 51.5 52.9 53.8 52.7 54.5 36.2 51.6 52.6
Unmarried/non-cohabitating, % 25.9 15.9 29.1 24.4 31.2 33.4 36.3 20.3
Low education, % 29.1 72.3 71.5 86.1 45.4 54.3 88.5 78.3
Fair/poor self-rated health, % 11.8 26.6 89.7 61.2 76.0 46.0 37.7 33.1
Age-standardised prevalence of probable depression, %
16.7 4.5 29.1 19.2 32.3 7.5 11.8 7.4
Age-standardised prevalence of depressed affect, %
8.5 2.4 18.8 8.2 34.1 14.1 5.0 2.1
Age-standardised prevalence of depressive symptom severity, % Low 31.2 23.1 41.3 31.4 43.0 47.6 38.8 28.1 Moderate 37.2 37.2 20.5 31.6 24.7 30.1 36.6 50.6 High 31.6 39.7 38.2 37.0 32.3 22.3 24.6 21.3 Analytic subsample (n=73 123) Number of participants 45 782 20 566 – 1241 – 3706 993 835
Data collection wave (year) Wave 1
(2010–2015) Wave 3(2006–2008) – Wave 2(2006–2008) – Wave 1(2007–2008) Wave 5(2005–2006) Wave 2(2005–2006) Number of residents per square kilometre
Mean (SD) 1056.8 (1358.8) 14.1 (8.7) – 2030.0 (1383.1) – 14 689.9 (11 332.6) 4723.9 (3972.5) 5185.3 (4845.1) 25th percentile 82 8 – 1030 – 5379 2686 2786 50th percentile 476 13 – 1435 – 10 829 4228 4494 75th percentile 1484 21 – 3251 – 25 459 6018 6126
CA, Canada; CLSA, Canadian Longitudinal Study on Aging; CZ, The Czech Republic; FR, France; HAPIEE, the Health, Alcohol and Psychosocial factors In Eastern Europe; HUNT, the Nord-Trøndelag Health Study; LASA-1, Longitudinal Aging Study Amsterdam—first cohort; LASA-2, Longitudinal Aging Study Amsterdam—second cohort; LT, Lithuania; NL, The Netherlands; NO, Norway; RECORD, the Residential Environment and CORonary heart Disease study, RU, Russia.
on May 19, 2021 by guest. Protected by copyright.
CI; 0.00, 79.22) symptom severity. I2and 95% CI percentages were well above 60% for gender and marital status, indicating extensive heterogeneity in these associations between cohorts. For probable depression, heterogeneity for gender and marital status was 92.99 (95% CI 88.50 to 95.73) and 88.26 (95% CI 79.16 to 93.39), respectively.
Effect modification by population density
Table 3reports the main effects of population density and its interactions with each determinant on probable depression and depressed affect in the subsample of six cohorts. Higher levels of population density were strongly associated with depression in CLSA. PRs of probable depression and depressed affect increased by 4% and 5% per 1000 increase in residents per square kilo-metre, respectively.
Higher population density modified gender and marital status inequalities in LASA-2 but not in the hypothesised direction. PRs for probable depression among women and unmarried persons decreased by 6% (PR: 0.94, 95% CI 0.90 to 0.98) and 4% (PR: 0.96, 95% CI 0.92 to 1.00) for every 1000 increase in residents per square kilometre. After stratifying by population density tertiles in LASA-2, PRs were highest among older women and unmarried persons living in low-density areas, compared to higher-density areas (online supplemental figure S4). Population density did not modify inequalities in other cohorts, including the elder cohort from the same Dutch region (LASA-1). Main and interaction effects for high symptom severity were similarly weak across the six cohorts (results available upon request).
DISCUSSION
This comparative study of eight European and Canadian cohorts found broadly consistent gender, marital and educational inequalities in mid- to late-life depressive symptoms. Despite our hypothesis, there was weak evidence that population density moderated these inequalities.
Strengths and limitations
Heterogeneity in measurement of depressive symptoms across cohorts is a major concern. Depressive symptoms were retro-spectively harmonised to create three indicators across cohorts using four depression scales (CES-D 20, CES-D 10, HADS-D and QD2A). Although each measured psychological, physical and social symptoms that characterise MDD,30overlap between indi-vidual symptoms was moderate. Where same symptoms were collected, scale differences in wording may result in under- or over-reporting of symptoms.31However, some experts have con-cluded that different depression scales measure depression risk in clinically meaningful ways, provided that they reliably assess the multiple dimensions that characterise depression.31 CES-D 10 has demonstrated very good prognostic accuracy in comparison to CES-D 2020which in turn has shown to perform similarly as HADS-D.32 Although QD2A has not been examined against HADS-D or the CES-D scales, QD2A has shown a strong-to-moderate correlation with the Zung Self-Rating Depression Scale,24which portrays a highly similar factor structure as the CES-D 20.33Yet, these comparisons were made on specific sam-ples, so the performance of these scales across MINDMAP cohorts is unknown. We addressed this uncertainty by testing associations using several indicators.
Probable depression is most clinically meaningful, but scale-specific thresholds for symptom scores, with different finite ranges, may have identified people with varying pathology or severity. Depressed affect has obvious face validity between stu-dies, but it remains unclear what feeling sad, depressed or down-hearted signifies. Comparing associations with a single symptom circumvents the issue that different symptoms may have different risk factors,34 and vary in their genetic background.35 Indeed, a European-wide study of older adults found that women reported a higher number of affective, but not motivational, symptoms than men.8 Nonetheless, depression is considered a latent construct, and its presence is inferred from multiple
symptom domains.31 Given similar gender, marital and
Table 2 Age-standardised study-specific prevalence of probable depression and depressed affect by gender, marital status and education Country and cohort Male Female Married/cohabitating Not married/cohabitating High education Low education Probable depression (%) CA CLSA 13.51 (12.76 to 14.27) 19.50 (18.65 to 20.36) 14.06 (13.37 to 14.75) 23.65 (22.52 to 24.78) 15.44 (14.77 to 16.11) 19.39 (18.26 to 20.51) NO HUNT 4.35 (3.94 to 4.76) 4.63 (4.23 to 5.03) 4.25 (3.94 to 4.56) 5.22 (4.49 to 5.95) 2.79 (2.29 to 3.28) 4.98 (4.64 to 5.33) RU HAPIEE 19.17 (16.91 to 21.42) 37.72 (35.20 to 40.23) 24.39 (22.39 to 26.38) 40.14 (36.91 to 43.37) 23.61 (20.48, 26.73) 31.10 (29.07, 33.14) CZ HAPIEE 13.85 (12.29 to 15.41) 24.69 (22.40 to 26.99) 16.30 (14.89 to 17.70) 27.67 (24.70 to 30.64) 13.82 (10.76 to 16.87) 20.11 (18.65, 21.58) LT HAPIEE 25.40 (24.18 to 26.63) 29.76 (28.19 to 31.33) 18.39 (17.19 to 19.58) 42.07 (40.10 to 44.04) 20.76 (19.36 to 22.16) 34.91 (33.39 to 36.42) FR RECORD 5.16 (4.12 to 6.20) 10.90 (9.10 to 12.70) 6.52 (5.45 to 7.60) 9.56 (7.51 to 11.61) 5.44 (4.13 to 6.74) 9.05 (7.66 to 10.44) NL LASA-1 8.95 (7.39 to 10.51) 14.33 (12.63 to 16.02) 8.66 (7.00 to 10.33) 23.27 (20.19 to 26.36) 10.48 (7.17 to 13.79) 11.89 (10.65 to 13.13) NL LASA-2 5.75 (4.09 to 7.42) 9.97 (8.26 to 11.68) 6.02 (4.88 to 7.15) 25.32 (19.32 to 31.33) 5.66 (3.21 to 8.11) 8.20 (6.90 to 9.51) Depressed affect (%) CA CLSA 7.01 (6.47 to 7.56) 9.79 (9.13 to 10.46) 7.33 (6.83 to 7.82) 11.62 (10.76 to 12.49) 7.88 (7.37 to 8.39) 9.90 (9.04 to 10.76) NO HUNT 1.99 (1.73 to 2.25) 2.82 (2.51 to 3.12) 2.29 (2.06 to 2.53) 3.48 (2.84 to 4.11) 1.73 (1.39 to 2.07) 2.70 (2.45 to 2.96) RU HAPIEE 12.39 (10.34 to 14.44) 24.41 (22.08 to 26.74) 15.55 (13.78 to 17.33) 26.69 (23.62 to 29.75) 13.25 (10.72, 15.77) 20.88 (18.99 to 22.77) CZ HAPIEE 5.60 (4.49 to 6.71) 10.63 (9.19 to 12.08) 6.60 (5.67 to 7.53) 13.10 (10.94 to 15.25) 4.73 (3.46 to 6.00) 8.84 (7.81 to 9.88) LT HAPIEE 27.04 (25.76 to 28.32) 31.87 (30.27 to 33.48) 20.61 (19.36 to 21.85) 43.15 (41.17 to 45.14) 22.81 (21.36 to 24.27) 36.43 (34.90 to 37.97) FR RECORD 10.05 (8.72 to 11.39) 20.14 (17.86 to 22.41) 13.38 (11.93 to 14.84) 15.72 (13.31 to 18.13) 11.25 (9.53 to 12.97) 16.26 (14.51, 18.02) NL LASA-1 2.65 (1.91 to 3.40) 7.07 (5.78 to 8.36) 2.88 (2.23 to 3.53) 11.31 (8.95 to 13.67) 2.39 (0.93 to 3.84) 5.31 (4.44 to 6.18) NL LASA-2 1.38 (0.53 to 2.23) 2.98 (1.98 to 3.99) 1.51 (0.91 to 2.11) 8.60 (4.78 to 12.41) 0.60 (−0.23 to 1.43) 2.53 (1.77 to 3.30) CA, Canada; CLSA, Canadian Longitudinal Study on Aging; CZ, The Czech Republic; FR, France; HAPIEE, the Health, Alcohol and Psychosocial factors In Eastern Europe; HUNT, the Nord-Trøndelag Health Study; LASA-1, Longitudinal Aging Study Amsterdam—first cohort; LASA-2, Longitudinal Aging Study Amsterdam—second cohort; LT, Lithuania; NL, The Netherlands; NO, Norway; PR, prevalence ratio; RECORD, the Residential Environment and CORonary heart Disease study, RU, Russia.
on May 19, 2021 by guest. Protected by copyright.
Figure 1 Forest plot of study-specific and pooled prevalence ratios (95% CIs) for probable depression by gender, marital status and education. CLSA, Canadian Longitudinal Study on Aging; CZ, The Czech Republic; HAPIEE, the Health, Alcohol and Psychosocial factors In Eastern Europe; HUNT, the Nord-Trøndelag Health Study; LASA-1, Longitudinal Aging Study Amsterdam—first cohort; LASA-2, Longitudinal Aging Study Amsterdam—second cohort; LT, Lithuania; PR, prevalence ratio; RECORD, the Residential Environment and CORonary heart Disease study, RU, Russia.
Figure 2 Forest plot of study-specific and pooled prevalence ratios (95% CIs) for depressed affect by gender, marital status and education. CLSA, Canadian Longitudinal Study on Aging; CZ, The Czech Republic; HAPIEE, the Health, Alcohol and Psychosocial factors In Eastern Europe; HUNT, the Nord-Trøndelag Health Study; LASA-1, Longitudinal Aging Study Amsterdam—first cohort; LASA-2, Longitudinal Aging Study Amsterdam—second cohort; LT, Lithuania; PR, prevalence ratio; RECORD, the Residential Environment and CORonary heart Disease study, RU, Russia.
on May 19, 2021 by guest. Protected by copyright.
educational inequalities across outcomes, these contentious issues may be waived aside for the present study.
Since population density data at the area level were unavailable for HAPIEE-LTand HAPIEE-RU, we could not explore the mod-erating hypothesis across the full range of urban settings captured by MINDMAP. Population density appears to have limited capa-city to capture important aspects of the urban environment, which may be important for depression. Indeed, health research-ers have urged the development of urbanicity scales drawing on a range of reliable measures.13 Unfortunately, more nuanced urbanicity measures were unavailable across cohorts at this stage of the project. Furthermore, cross-cohort findings may be influenced by cohort and period effects since participants were
studied from 1992–1993 (LASA-1) to 2010–2015 (CLSA).
Despite this time span, the magnitude of cross-cohort inequalities aligns with several European reports which used concurrent data between countries,6–8suggesting that depression inequalities may be robust to broad secular changes.
Consistency with existing evidence
The magnitude of depression inequalities found across MINDMAP studies is remarkably consistent with high-quality evidence from several reviews.3–5 A meta-analysis of five prospective studies reported that community-dwelling women aged≥50 years have a 1.4 higher odds of depression than men, but stated weaker pooled
ORs of 1.0 (95% CI 0.8 to 1.3) and 1.5 (95% CI 0.8 to 2.8) by marital status and education, respectively.3 Larger systematic reviews and meta-analyses of cross-sectional and prospective stu-dies on adults aged ≥55 years, however, found increased risks associated with never married (relative risk (RR) 1.32) and widowed (RR 1.49) statuses4as well as with low education (OR 1.58) on prevalent depression.5Although we analysed self-reported symptoms in the absence of clinically diagnosed cases, considered to be more valid measures of depressive disorders,36our findings demonstrate that the MINDMAP-harmonised data set is a solid resource for comparative ageing and mental well-being research.14 In a study of adults aged≥50 years from Northern, Western and Southern Europe, PRs for probable depression, measured by the European Depression (EURO-D) scale, risks among females were lowest in Denmark (1.91) and higher in Spain (3.89). PRs comparing low to high educational groups varied widely from 1.70 (Greece) to 3.02 (France).7Among adults aged≥65 years from similar parts of Europe, never married, widowed and divorced/separated adults reported a higher number of depres-sive symptoms than married adults, but only in 9 of 13 sites.8Few European studies on mid- to late-life depression included Central and Eastern Europe (CEE), but larger gender6and educational37 inequalities have been reported in CEE than in Northern coun-tries including Norway, among adults aged 18–756 and 60–80 years,37 respectively. Altogether, these comparative findings6–8 37align with the cross-cohort variation of depression Table 3 Study-specific main effects of population density and interactions with gender, marital status and education on the risk of probable depression and depressed affect
Country and cohort
PR (95% CI) per 1000 residents per square kilometre*
Interaction between gender and population density†
Interaction between marital status and population density†
Interaction between education and population density† PRs for probable depression (95% CI)
CA CLSA 1.04 (1.02 to 1.05) 0.99 (0.96 to 1.02) p=0.36 1.01 (0.98 to 1.04) p=0.55 1.02 (0.99 to 1.05) p=0.15 NO HUNT‡ 0.76 (0.68 to 0.85) 0.97 (0.78 to 1.20) p=0.76 1.05 (0.81 to 1.35) p=0.73 0.95 (0.76 to 1.19) p=0.68 CZ HAPIEE 0.93 (0.82 to 1.06) 0.99 (0.73 to 1.34) p=0.96 0.88 (0.66 to 1.17) p=0.39 1.20 (0.78 to 1.84)p=0.40 FR RECORD 1.00 (0.99 to 1.01) 0.9 (0.97 to 1.02) p=0.63 1.00 (0.98 to 1.02) p=0.82 0.99 (0.97 to 1.02) p=0.55 NL LASA-1 1.00 (0.97 to 1.03) 0.98 (0.91 to 1.05) p=0.51 1.04 (0.98 to 1.12) p=0.20 1.05 (0.93 to 1.19) p=0.44 NL LASA-2 1.02 (0.99 to 1.05) 0.94 (0.90 to 0.98) p<0.01 0.96 (0.92 to 1.00) p=0.07 0.98 (0.92 to 1.05) p=0.57 PRs for depressed affect (95% CI)
CA CLSA 1.05 (1.03 to 1.08) 0.98 (0.93 to 1.02) p=0.34 0.99 (0.95 to 1.04) p=0.76 1.02 (0.97 to 1.07) p=0.42 NO HUNT‡ 0.96 (0.88 to 1.04) 1.05 (0.88 to 1.24) p=0.59 0.95 (0.78 to 1.17) p=0.66 1.08 (0.91 to 1.27) p=0.40 CZ HAPIEE 0.95 (0.85 to 1.06) 1.12 (0.86 to 1.46) p=0.41 0.89 (0.69 to 1.16)p=0.40 1.08 (0.75 to 1.57)p=0.66 FR RECORD 1.00 (0.99 to 1.01) 1.00 (0.99 to 1.02) p=0.64 1.00 (0.98 to 1.01) p=0.71 1.00 (0.99 to 1.01) p=0.98 NL LASA-1 1.00 (0.94 to 1.06) 0.97 (0.86 to 1.11) p=0.69 1.04 (0.93 to 1.17) p=0.48 1.01 (0.84 to 1.21) p=0.94 NL LASA-2 0.95 (0.87 to 1.03) 1.01 (0.84 to 1.22) p=0.93 0.99 (0.82 to 1.20) p=0.94 0.90 (0.76 to 1.06) p=0.20 *The main effect of population density (per 1000 residents per square kilometre) was adjusted for all three determinants plus age, age squared and self-rated health. †Interaction effects between population density and each exposure were adjusted for the other two exposures plus age, age squared and self-rated health.
‡The HUNT analyses were based on 10 residents per square kilometre because the maximum population density value was 32 residents per square kilometre in the analytic sample. CA, Canada; CLSA, Canadian Longitudinal Study on Aging; CZ, The Czech Republic; FR, France; HAPIEE, the Health, Alcohol and Psychosocial factors In Eastern Europe; HUNT, the Nord-Trøndelag Health Study; LASA-1, Longitudinal Aging Study Amsterdam—first cohort; LASA-2, Longitudinal Aging Study Amsterdam—second cohort; LT, Lithuania; NL, The Netherlands; NO, Norway; PR, prevalence ratio; RECORD, the Residential Environment and CORonary heart Disease study, RU, Russia.
on May 19, 2021 by guest. Protected by copyright.
inequalities reported in our study. Since these studies measured depressive symptoms using a single scale across countries,6–8 37 this provides further support that cross-cohort variation in MINDMAP is not driven by the abovementioned measurement issues.
Our study found that population density was weakly associated with depression, and consequently did not modify the strong effects of gender, marital status and education on depression. Although the higher depression risk among older adults in urban versus rural areas is well established,2there is limited and mixed evidence of a graded increase in depression by increasing population density.38 39Probable depression risk among women and unmarried/non-cohabitating adults decreased in higher-density areas in LASA-2. This could indicate greater convergence within private or social life between men and women6 and greater social integration of older single persons8with higher levels of urbanicity. Since these results were not replicated in other cohorts, including LASA-1, which consisted of adults born decades earlier from the same regions, the LASA-2 results may be due to confounding or selection biases. Despite some ecological correlation between population density and depres-sion inequalities, both of which were lower in HUNT than in other cohorts, inequalities within cohorts were unmodified by densification, suggesting that people’s position in society are ‘fundamental causes’ of inequalities irrespective of the social context.40
CONCLUSION
Given strong mid- to late-life depression inequalities amidst increasing rates of urbanicity in Europe and Canada, future work should assess the interplay between putative risk factors and specific urban municipal-level determinants and living conditions,9which may influence older adults’ mental health.
Author affiliations
1Research Department of Epidemiology and Public Health, University College London,
London, UK
2Department of Public Health, Erasmus University Medical Center, Rotterdam,
Netherlands
3Research Institute of the McGill University Health Centre, Montreal, Canada 4Department of Health Research Methods, Evidence and Impact, McMaster University,
Hamilton, Ontario, Canada
5McMaster Institute for Research on Aging, Hamilton, Ontario, Canada 6Department of Epidemiology and Biostatistics, Amsterdam UMC, VU University
Medical Center, Amsterdam Public Health Research Institute, Amsterdam, Netherlands
7Sorbonne Université, INSERM, Institut Pierre Louis d'Epidémiologie et de Santé
Publique, Nemesis Research Team, Paris, France
8Department of Sociology, Faculty of Social Sciences, Vrije Universiteit Amsterdam,
Amsterdam, Netherlands
9HUNT Research Centre, Department of Public Health and General Practice, Faculty of
Medicine, Norwegian University of Science and Technology (NTNU), Levanger, Norway
10Levanger Hospital, Nord-Trøndelag Hospital Trust, Levanger, Norway 11Centre for Environmental Health Monitoring, National Institute of Public Health,
Prague, Czech Republic
12Research Institute of Internal and Preventive Medicine, Branch of the Institute of
Cytology and Genetics, SB RAS, Novosibirsk, Russia
13Novosibirsk State Medical University, Novosibirsk, Russia
14Institute of Cardiology, Academy of Medicine, Lithuanian University of Health
Sciences, Kaunas, Lithuania
15Faculty of Public Health, Academy of Medicine, Lithuanian University of Health
Sciences, Kaunas, Lithuania
16Department of Human Geography and Spatial Planning, Utrecht University, Utrecht,
Netherlands
Acknowledgements The authors are grateful to Professor Mauricio Avendano for critical review of the manuscript and many helpful comments. MAR and MBo are also grateful to Professor Michael Dewey, Dr Lauren Griffith, Professor Scott Hofer and Dr Graciela Muniz-Terrera for their invaluable input and expertise on the harmonisation of the depressive symptomatology data. PR holds the Raymond and Margaret Labarge Chair in Optimal Aging and Knowledge Application for Optimal Aging, is the Director of the McMaster Institute for Research on Aging and the Labarge Centre for Mobility in Aging, and holds a Tier 1 Canada Research Chair in Geroscience.
Contributors MAR co-designed the study, conducted all analyses, drafted the initial and revised manuscript, and approved thefinal manuscript as submitted. MBo co-designed the study,finalised the initial and revised manuscript, and approved the final manuscript as submitted. BC and FJvL contributed to the design of the study. All coauthors critically reviewed the manuscript and approved thefinal manuscript as submitted.
Funding This study is supported by a European Commission Horizon 2020 Grant, 667661, as part of the Promoting Mental Well-being in the Ageing Population: Determinants, Policies and Interventions in European Cities (MINDMAP) research project. This research was made possible using the data/ biospecimens collected by the Canadian Longitudinal Study on Aging (CLSA). Funding for the CLSA is provided by the Government of Canada through the Canadian Institutes of Health Research (CIHR) under grant reference: LSA 94473 and the Canada Foundation for Innovation. This research has been conducted using the CLSA data set, Baseline Comprehensive Dataset version 4.0, under application number 171013. The CLSA is led by Drs Parminder Raina, Christina Wolfson and Susan Kirkland. The Nord-Trøndelag Health Study (HUNT) is mainly funded by the Norwegian Ministry of Health (NTNU), with additional support from the Norwegian Research Council (the FUGE programme), Central Norway Regional Health Authority, the Nord-Trøndelag County Council and the Norwegian Institute of Public Health. The Health, Alcohol and Psychosocial factors In Eastern Europe (HAPIEE) study is funded by the Wellcome Trust (grants 064947 and 081081), the US National Institute on Aging (grant R01 AG23522-01), the MacArthur Foundation ‘MacArthur Initiative on Social Upheaval and Health’ (grant 712058). The Longitudinal Aging Study Amsterdam (LASA) is largely supported by grants from the Netherlands Ministry of Health, Welfare and Sports, Directorate of Long-Term Care. The Residential Environment and CORonary heart Disease (RECORD) study is supported by INPES (National Institute for Prevention and Health Education); IReSP (Institute for Public Health Research); InVS (National Institute of Public Health Surveillance); French Ministries of Research and Health; CNAM-TS (National Health Insurance Office for Salaried Workers); and the Ile-de-France Regional Health Agency (ARS). MAB’s work was funded by a Netherlands Organization for Scientific Research (NWO) VENI grant on‘DenCityHealth: How to keep growing urban populations healthy?’ (grant 09150161810158).
What is already known on this subject
► Gender, marital and educational inequalities in mid- to late-life depression are well established, but the magnitude of these inequalities may vary between European and North American countries due to differences in urbanicity.
► The share of older European and North American adults residing in cities has grown exponentially over the last several decades. Living in more densely populated cities may exacerbate depression risks associated with female gender, unmarried/ divorced/widowed status and low educational attainment.
► This study hypothesised that increasing levels of population density, a marker of urbanicity, would magnify mid- to late-life depression inequalities.
What this study adds
► This comparative study of European and Canadian ageing cohorts found strong gender, marital and educational inequalities in depressive symptoms, and the magnitude varied between cohorts.
► However, population density, measured by the number of residents per square kilometre, was weakly associated with depression risk across cohorts, and thus did not modify depression inequalities.
on May 19, 2021 by guest. Protected by copyright.
Competing interests None declared. Patient consent for publication Not required.
Ethics approval All participating cohort studies have originally received consent from the participants and ethical approval from their respected institutions: CLSA has received ethical approval from the Hamilton Integrated Research Ethics Board. HUNT received ethical approval from the Regional Committee for Medical Research Ethics, Mid-Norway. In addition, MINDMAP-specific approval was received from the same committee. HAPIEE received ethical approval from the Joint UCL/UCLH Committees on the Ethics of Human Research, and by local ethics committees in every participating centre. RECORD received ethical approval from the Commission Nationale de l’Informatique et des Libertés. LASA received ethical approval by the Medical Ethical Committee of the Vrije Universiteit medisch centrum. Secondary use of the MINDMAP harmonised data set also received a declaration of no objection from the Medical Ethical Committee of Erasmus University Medical Centre.
Provenance and peer review Not commissioned; externally peer reviewed. Data availability statement The data sets generated for the MINDMAP project are not publicly available due to study participant privacy considerations. However, data access can be requested from the individual cohort studies via the respective data access procedures in place. Data are available from the Canadian Longitudinal Study on Aging (www.clsa-elcv.ca) for researchers who meet the criteria for access to de-identified CLSA data.
Supplemental material This content has been supplied by the author(s). It has not been vetted by BMJ Publishing Group Limited (BMJ) and may not have been peer-reviewed. Any opinions or recommendations discussed are solely those of the author(s) and are not endorsed by BMJ. BMJ disclaims all liability and responsibility arising from any reliance placed on the content. Where the content includes any translated material, BMJ does not warrant the accuracy and reliability of the translations (including but not limited to local regulations, clinical guidelines, terminology, drug names and drug dosages), and is not responsible for any error and/or omissions arising from translation and adaptation or otherwise.
Open access This is an open access article distributed in accordance with the Creative Commons Attribution 4.0 Unported (CC BY 4.0) license, which permits others to copy, redistribute, remix, transform and build upon this work for any purpose, provided the original work is properly cited, a link to the licence is given, and indication of whether changes were made. See: https://creativecommons.org/licenses/ by/4.0/.
ORCID iDs
Milagros A Ruizhttp://orcid.org/0000-0001-7492-9873
Erik J Timmermanshttp://orcid.org/0000-0002-3414-7196
Steinar Krokstadhttp://orcid.org/0000-0002-2932-6675
REFERENCES
1 Ferrari AJ, Charlson FJ, Norman RE, et al. Burden of depressive disorders by country, sex, age, and year:findings from the global burden of disease study 2010.PLoS Med
2013;10:e1001547.
2 Purtle J, Nelson KL, Yang Y, et al. Urban-rural differences in older adult depression: a systematic review and meta-analysis of comparative studies.Am J Prev Med
2019;56:603–13.
3 Cole MG, Dendukuri N. Risk factors for depression among elderly community subjects: a systematic review and meta-analysis.Am J Psychiat2003;160:1147–56. 4 Yan XY, Huang SM, Huang CQ, et al. Marital status and risk for late life depression: a
meta-analysis of the published literature.J Int Med Res2011;39:1142–54. 5 Chang-Quan H, Zheng-Rong W, Yong-Hong L, et al. Education and risk for late
life depression: a meta-analysis of published literature.Int J Psychiatry Med
2010;40:109–24.
6 Van de Velde S, Bracke P, Levecque K. Gender differences in depression in 23 European countries. Cross-national variation in the gender gap in depression.Soc Sci Med
2010;71:305–13.
7 Castro-Costa E, Dewey M, Stewart R, et al. Prevalence of depressive symptoms and syndromes in later life in ten European countries: the SHARE study.Br J Psychiatry
2007;191:393–401.
8 Prince MJ, Beekman AT, Deeg DJ, et al. Depression symptoms in late life assessed using the EURO-D scale. Effect of age, gender and marital status in 14 European centres.Br J Psychiatry1999;174:339–45.
9 Vlahov D, Galea S. Urbanization, urbanicity, and health.J Urban Health
2002;79:S1–s12.
10 OECD. Ageing in cities. Paris: OECD Publishing, 2015.
11 Dustmann C, Fasani F. The effect of local area crime on mental health.Econ J
2016;126:978–1017.
12 Hoare E, Jacka F, Berk M. The impact of urbanization on mood disorders: an update of recent evidence.Curr Opin Psychiatry2019;32:198–203.
13 Cyril S, Oldroyd JC, Renzaho A. Urbanisation, urbanicity, and health: a systematic review of the reliability and validity of urbanicity scales.BMC Public Health
2013;13:513.
14 Beenackers MA, Doiron D, Fortier I, et al. MINDMAP: establishing an integrated database infrastructure for research in ageing, mental well-being, and the urban environment.BMC Public Health2018;18:158.
15 Raina PS, Wolfson C, Kirkland SA, et al. The Canadian longitudinal study on aging (CLSA).Can J Aging2009;28:221–9.
16 Krokstad S, Langhammer A, Hveem K, et al. Cohort profile: the HUNT study, Norway.
Int J Epidemiol2013;42:968–77.
17 Peasey A, Bobak M, Kubinova R, et al. Determinants of cardiovascular disease and other non-communicable diseases in Central and Eastern Europe: rationale and design of the HAPIEE study.BMC Public Health2006;6:255–55.
18 Chaix B, Kestens Y, Bean K, et al. Cohort profile: residential and non-residential environments, individual activity spaces and cardiovascular risk factors and diseases-the RECORD Cohort Study.Int J Epidemiol2011;41:1283–92.
19 Huisman M, Poppelaars J, van der Horst M, et al. Cohort profile: the Longitudinal Aging Study Amsterdam.Int J Epidemiol2011;40:868–76.
20 Andresen EM, Malmgren JA, Carter WB, et al. Screening for depression in well older adults: evaluation of a short form of the CES-D (Center for Epidemiologic Studies Depression Scale).Am J Prev Med1994;10:77–84.
21 Irwin M, Artin KH, Oxman MN. Screening for depression in the older adult: criterion validity of the 10-item Center for Epidemiological Studies Depression Scale (CES-D).
Arch Intern Med1999;159:1701–4.
22 Radloff LS. The Center for Epidemiologic Studies Depression Scale: a self-report depression scale for research in the general population.Appl Psychol Meas
1977;1:385–401.
23 Zigmond AS, Snaith RP. The Hospital Anxiety and Depression Scale.Acta Psychiatry Scand1983;67:361–70.
24 Pichot P. A self-report inventory on depressive symptomatology (QD2) and its abridged form (QD2A). In: Sartorius N, Ban TA, eds. Assessment of depression. Berlin, Heidelberg: Springer Berlin Heidelberg, 1986: 108–22.
25 Weissman MM, Sholomskas D, Pottenger M, et al. Assessing depressive symptoms in five psychiatric populations: a validation study.Am J Epidemiol1977;106:203–14. 26 Snaith RP. The Hospital Anxiety and Depression Scale.Health Qual Life Outcomes
2003;1:29.
27 UNESCO. The International Classification of Education ISCED 2011. Montreal: UNESCO Institute for Statistics, 2012: 1–88.
28 Spitzer S, Weber D. Reporting biases in self-assessed physical and cognitive health status of older Europeans.PLoS One2019;14:e0223526.
29 Fox J, Hong J. Effect displays in R for multinomial and proportional-odds logit models: extensions to the effects package.J Stat Software2009;32:24.
30 Fried EI. The 52 symptoms of major depression: lack of content overlap among seven common depression scales.J Affect Disord2017;208:191–7.
31 McClintock S, Haley C, Bernstein I. Psychometric considerations of depression symptom rating scales.Neuropsychiatry2011;1:611–23.
32 Macedo EA, Appenzeller S, Costallat LTL. Depression in systemic lupus erythematosus: gender differences in the performance of the Beck Depression Inventory (BDI), Center for Epidemiologic Studies Depression Scale (CES-D), and Hospital Anxiety and Depression Scale (HADS).Lupus2018;27:179–89.
33 Shafer AB. Meta-analysis of the factor structures of four depression questionnaires: Beck, CES-D, Hamilton, and Zung.J Clin Psychol2006;62:123–46.
34 Fried EI, Nesse RM, Zivin K, et al. Depression is more than the sum score of its parts: individual DSM symptoms have different risk factors.Psychol Med2014;44:2067–76. 35 Flint J, Kendler KS. The genetics of major depression.Neuron2014;81:484–503. 36 Comstock GW, Helsing KJ. Symptoms of depression in two communities.Psychol Med
1977;6:551–63.
37 Hansen T, Slagsvold B, Veenstra M. Educational inequalities in late-life depression across Europe: results from the generations and gender survey.Eur J Ageing
2017;14:407–18.
38 Generaal E, Hoogendijk EO, Stam M, et al. Neighbourhood characteristics and pre-valence and severity of depression: pooled analysis of eight Dutch cohort studies.Br J Psychiatry2019;215:468–75.
39 Motoc I, Timmermans EJ, Deeg D, et al. Associations of neighbourhood sociodemo-graphic characteristics with depressive and anxiety symptoms in older age: results from a 5-wave study over 15 years.Health Place2019;59:102172.
40 Beckfield J, Olafsdottir S, Bakhtiari E. Health inequalities in global context.Am Behav Sci2013;57:1014–39.
on May 19, 2021 by guest. Protected by copyright.