C L I N I C A L R E S E A R C H
Does Alignment in the Hindfoot Radiograph Influence Dynamic
Foot-floor Pressures in Ankle and Tibiotalocalcaneal Fusion?
Arno Frigg MD, Benno Nigg PhD, Elysia Davis MSc,Beth Pederson MD, V. Valderrabano MD, PhD
Received: 20 November 2009 / Accepted: 14 June 2010 / Published online: 29 June 2010 Ó The Association of Bone and Joint Surgeons1 2010
Abstract
Background The Saltzman-el-Khoury hindfoot alignment view (HAV) is considered the gold standard for assessing the axis from hindfoot to tibia. However, it is unclear whether radiographic alignment influences dynamic load distribution during gait.
Questions/purposes We evaluated varus-valgus alignment by the HAV and its influence on dynamic load distribution in ankle and tibiotalocalcaneal (TTC) arthrodesis.
Patients and Methods We clinically assessed 98 patients (ankle, 56; TTC, 42) with SF-36 and American Ortho-paedic Foot and Ankle Society (AOFAS) scores, visual hindfoot alignment, HAV angle, and dynamic pedobarog-raphy using a five-step method. For comparison, 70 normal
feet were evaluated. Minimum followup was 2 years (average, 4.11 years; range, 2–6 years).
Results The mean HAV angle was 0.8° ± 7.8° for ankle and 1.2° ± 6.9° for TTC arthrodesis. The HAV angle correlated with pedobarographic load distribution (r = 0.35–0.53). Radiographic alignment did not influence SF-36 or AOFAS scores; however, load distribution cor-related to qualities of these scores. Visual alignment only predicted the corresponding HAV angle in 48%. To reproduce the dynamic load of healthy subjects, HAV angles of 5° to 10° valgus were needed.
Conclusions Visual positioning is inadequate to deter-mine intraoperative positioning and resulted in a varus position with a relatively large SD. The HAV should be used to assess the hindfoot alignment correctly. HAV angles of 5° to 10° valgus are needed to reproduce a physiologic gait pattern.
Introduction
Frontal plane alignment of the hindfoot can be assessed visually [5,7,38], on AP radiographs [21,31,37], or with posterior radiographs such as those described by Saltzman and el-Khoury (hindfoot alignment view or HAV) [37] or Cobey and Sella [10,11]. Although the reliability of clin-ical measurement is improved by using a goniometer and weightbearing position, several studies showed clinical measurements are less reliable than radiographic approa-ches [5, 13, 38]. AP radiographs are difficult to measure because of superimposition of the midfoot and the 20° internal rotation that mimics the heel lateral to the tibia. The HAV is taken at a 20° angle from the horizontal (Fig.1) and allows measurement of the mechanical axis of the hindfoot to the tibia (Fig.2) [37]. Although we Each author certifies that he or she has no commercial associations
(eg, consultancies, stock ownership, equity interest, patent/licensing arrangements, etc) that might pose a conflict of interest in connection with the submitted article.
Each author certifies that his or her institution approved the human protocol for this investigation and that all investigations were conducted in conformity with ethical principles of research, and that informed consent for participation in the study was obtained. This work was performed at Department of Orthopaedic Surgery and Human Performance Laboratory of the University of Calgary. A. Frigg, B. Pederson
Department of Orthopaedics, University of Calgary, Calgary, Canada
A. Frigg, B. Nigg, E. Davis, V. Valderrabano
Human Performance Laboratory, University of Calgary, Calgary, Canada
A. Frigg (&), V. Valderrabano
Department of Orthopaedic Surgery, University of Basel Hospital, Spitalstrasse 21, CH-4031 Basel, Switzerland e-mail: [email protected]
consider the HAV the gold standard to assess hindfoot alignment [15,18,21,31], this view was used in only one study [12].
Radiographs reflect only static alignment of the foot in the standing position. However, physiologic heel strike occurs in varus on the lateral heel followed by the hindfoot turning in pronation for the rollover process [15]. It therefore is unclear whether static alignment measured on radiographs also predicts dynamic load distribution during gait, ie, dynamic alignment. This dynamic alignment can be measured by pedobarography, allowing measurement of pressure distribution of the foot during the rollover process [6,7,9,23,32]. Barefoot pedobarography has been used to observe correlation of foot pain and abnormally high pressure areas in clubfeet [6,14], to identify high pressure areas at risk for ulceration [2,16,41], and to investigate the mechanical change in patients with rheumatoid arthritis in the feet [28,40], metatarsalgia [19], hallux valgus [20], and cavovarus deformity [26].
The hindfoot position can be divided into neutral (0° angle from hindfoot to tibial axis), valgus (lateral deviation), and varus (medial deviation). There are differ-ent definitions to assess the hindfoot axis radiographically because of the variable shape of the calcaneus, including lateral calcaneal wall, superimposition of 2:1 ellipsis, and lowest contact point of the calcaneus [10, 11, 21, 37]. Numerous authors [4,5,12,15,27,29] have stated, based on visual and radiographic measurements, the hindfoot should be in 5° to 7° valgus. However, in a study of 57 healthy subjects Saltzman and el-Khoury [37] found the average contact point of the calcaneus was 3.2 mm medial to the tibial axis, corresponding to a varus position of approximately 1° to 2°. Although some consider 0° to 10° valgus the best position in ankle arthrodesis [5], the only study assessing ankle arthrodesis with the HAV reports a varus position with medial calcaneal displacement of 1.5 mm [12].
The aims of our study were to (1) assess hindfoot alignment with the HAV in patients with ankle and TTC arthrodesis visually positioned in 5° to 7° valgus, (2) determine if radiographic varus/valgus alignment measured in the HAV influences dynamic load distribution, (3) determine if the AOFAS and SF-36 scores are influenced by HAV alignment and pedobarographic load, (4) evaluate how hindfoot alignment measured by visual means predicts HAV alignment, and (5) determine the best position in the HAV for ankle arthrodesis to reproduce the load distribu-tion of healthy subjects.
Patients and Methods
We retrospectively reviewed all 236 patients who under-went ankle or TTC arthrodesis from 2003 to 2006. For this study we included patients meeting the following criteria: (1) with unilateral successful ankle or TTC fusion per-formed at the authors’ institution with a minimal followup Fig. 1A–B (A) The HAV is
taken at a 20° angle to the floor. (B) The foot is placed with its medial border parallel to the radiographic beam (the so-called straight position).
Fig. 2 A radiograph shows the HAV in a patient after a medial ankle fracture. The lowest contact point of the calca-neus is 3 mm medial to the tibial axis corresponding to the varus position.
of 2 years, (2) with complete preoperative and postopera-tive radiographs available on a DICOM/PACS system, and (3) living in the city or a maximum 1-hour drive away. We excluded patients with persistent painful nonunion (n = 5), who were bedridden (n = 22), deceased (n = 6), had amputations during followup (n = 8), with comorbidities that precluded walking over the pedobarograph (eg, blindness, neuromuscular diseases, paralysis of the lower extremity) (n = 7), with incomplete preoperative radio-graphs (n = 13), with incomplete data during followup (n = 8), living outside the city or more than 1 hour away (n = 23), refused to participate in the study (n = 32), or moved away to unknown addresses (n = 14). These exclusions left 98 patients with arthrodesis of the ankle (n = 56) or TTC (n = 42). The comorbidity score of Charlson et al. [8] was 0.8 ± 1.1. There were 65 men (66%) and 33 women (34%). Their average (± SD) age was 63 ± 11 years. Radiographic evidence of osteoarthri-tis according to the criteria of Giannini et al. [17] was found in the subtalar and midfoot joints in 93% of patients. Minimum followup was 2 years (average, 4 ± 1 years; range, 2–6 years).
To determine the physiologic varus-valgus load distri-bution, the pedobarographic data of 35 healthy subjects (70 feet) with no history of foot problems or disorders seen on clinical examination were used. No radiographs of the healthy subjects were available. There were 17 men (49%) and 18 women (51%) with an average age of 37 ± 12 years. All subjects provided informed consent to participate in the study. The study was approved by the ethical board of the authors’ university. The study was performed in accordance with the World Medical Associ-ation DeclarAssoci-ation of Helsinki.
Indications for surgery were osteoarthritis of the ankle and/or subtalar joint. Ankle fusions were performed using a transfibular approach using two 6.5-mm screws for tibi-otalar fixation and two 3.5-mm screws for fixation of the fibula. TTC fusions were performed using a transfibular approach and a straight retrograde intramedullary nail (Biomet, Warsaw, IN; Stryker, Kalamazoo, MI). Align-ment was adjusted by the surgeons’ using visual judgAlign-ment and intraoperative AP radiographs of the ankle.
Postoperatively, patients wore a cast and were non-weightbearing using crutches. After 2 weeks, the sutures were removed and the cast was changed. At 6 weeks, the cast was exchanged, radiographs were taken, and patients then were allowed to begin feather weightbearing. The cast was removed at 12 weeks and radiographs repeated. The criteria for union was radiographic evidence of complete bridging of the joint line/osteotomy site by trabeculae and absence of a visible joint line or gap as read by the hospital radiologist and the treating surgeon. If satisfactory union had occurred, the patient was permitted to ambulate with
full weightbearing. Otherwise, the patient was kept partial weightbearing and clinical and radiographic followups were performed at 4-week intervals until there was evi-dence of fusion. Thereafter, patients were followed clinically and radiographically at 1 and 2 years postoper-atively and additional visits according to clinical needs.
The followup consisted of four parts: (1) AOFAS [22] and SF-36 scores [43]; (2) visual assessment of hindfoot alignment; (3) radiographic followup with AP view, lateral view, and HAV; and (4) dynamic pedobarography. Hind-foot alignment was judged visually using a goniometer. The patient was standing full weightbearing on both legs. The upper arm of the goniometer followed the axis of the calf, and the lower arm followed a parallel line of the lateral heel. One of three observers (AF, LH, LD) made measurement on the patients. According to the AOFAS score [22] and Chang et al. [7], hindfoot alignment was divided into five groups: neutral (0 to \ 5° valgus); valgus (5°–10° valgus); severe valgus malalignment ([ 10° val-gus); varus (\ 0 to 10° varus); and severe varus malalignment (\ 10° varus).
The HAV was obtained as described by Saltzman and el-Khoury [37] (xray beam orientated 20° from the hori-zontal at a distance of 40 inches, 62 kV) (Fig.1). The straight position (medial border of the feet parallel, knees in extension facing the film) was used as it was more reproducible than the natural position in which patients are xrayed in their natural amount of rotation [37]. A 6-cm lead strip was placed tangent to the most posterior aspect of the heel to assess radiographic magnification. Radiographs were evaluated by one blinded observer (AF, not a treating surgeon) trained in skeletal radiology on a high-resolution wide screen using a DICOM/PACS system. The intraob-server test revealed an intraclass correlation coefficient of 0.998 for distances and 0.996 for angles. As the film-object distance was larger on the HAV compared with on the AP view, we measured an average 16% magnification in the HAV, which was included in the measurements.
The following measurements were made on the HAV: HAV distance (HAVD), HAV angle (HAVA), lateral heel angle (LHA), frontal tibial ground angle (FTGA), and frontal strike angle (FSA). The HAVD was the distance from the most inferior point of the calcaneus to the tibial axis (lowest point lateral = positive value = valgus; low-est point medial = negative value = varus) (Fig.3A) [37]. The HAVA was the angle created by a line drawn from the most inferior point of the calcaneus to the intersection of the tibial axis with the joint line, which was reconstructed in fused ankles using the medial malleolus as a reference from preoperative radiographs (valgus = positive, varus = negative values) (Fig.3A). The LHA, which correlates best in the clinical setting with the visual impression, was the angle measured between the lateral calcaneal wall and
tibial axis (Fig.3B). The FTGA was the angle between the tibia and the ground measured on the lateral side (Fig.3B). The FSA was the angle at which the hindfoot ultimately hits the ground adding the FTGA to the HAVA (FSA = FTGA + HAVA 90°).
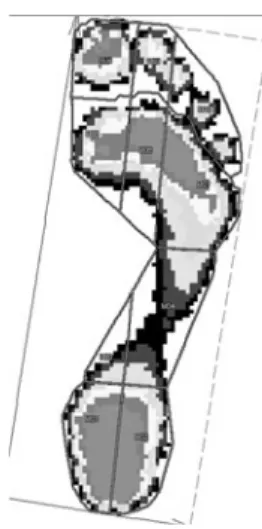
All patients were examined using dynamic pedobarog-raphy on a 10-m runway made of hard plastic (Novel emed m/E, St Paul, MN, USA). To avoid effects of acceleration and deceleration, patients took five steps before and after hitting the platform (five-step method) [23]. Footprints outside the platform were excluded by the software. To obtain eight footprints accepted by the software, patients performed eight or more runs per foot. These footprints then were averaged by the software. The feet were ana-lyzed barefoot in a Peter Richard Cavanagh (PRC) mask from the Novel scientific software (Fig.4) [39]. The PRC mask divides the foot into 10 masks: lateral and medial heel; lateral and medial midfoot; forefoot consisting of first, second, and lateral metatarsal heads, hallux, second toe, and lateral toes. Boundaries between heel to midfoot and midfoot to forefoot were defined as 45% and 73% of length. The lateral and medial sections were defined by an axis drawn from the center of the heel to the center of the second toe. The first, second, and lateral metatarsal heads were separated by straight lines drawn parallel to the foot axis, which divided the forefoot region vertically from the medial to the lateral side into sections of 30%, 25%, and 45% [39].
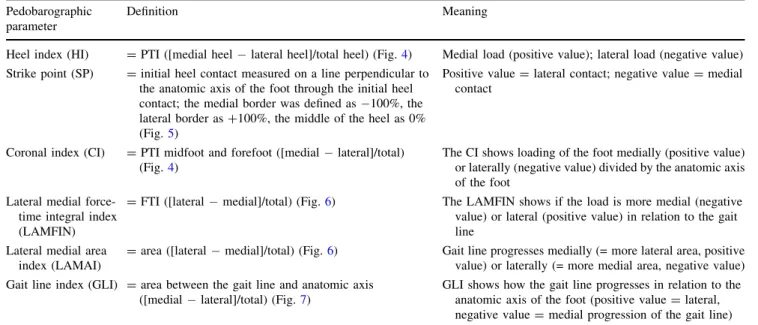
The following parameters were calculated (Table 1): heel index (HI), strike point (SP, Fig. 5), coronal index (CI), lateral medial force-time integral index (LAMFIN, Fig.6), lateral medial area index (LAMAI, Fig. 6), and gait line integral (GLI, Fig.7). Data were extracted from pedobarography producing ASCII files, which then were reorganized into Excel1files (Microsoft Corp, Redmond, WA, USA) with custom-made software written in MATLAB1(The Mathworks Inc, Natick, MA, USA). The radiographic parameters were correlated by calculating the Pearson correlation coefficients (r). The significance level of r was corrected for multiple testing by dividing the significance level of 0.05 by the number of tests. The correlations of radiographic to pedobarographic parameters and SF-36 and AOFAS scores were calculated the same way. For comparison of visual and radiographic parame-ters, patients were grouped according to their HAVA in the same groups as for visual judgment. To evaluate the physiologic load pattern in patients with ankle and TTC arthrodesis, only pedobarographic parameters showing a correlation with r [ 0.4 to HAVA were used. We used STATISTICA1 Version 8.0 (StatSoft Inc, Tulsa, OK, USA) for all analyses.
Results
The average HAVA was 0.8° ± 7.8° for ankle and 1.2° ± 6.9° for TTC arthrodesis. The radiographic alignment measured by HAVA was neutral in 24%, varus in 53% (average varus for ankle, 7.1 ± 4°; for TTC, 5.8 ± 3°), and valgus in 24% (average valgus for ankle, 7.5 ± 5°; for TTC, 6.9 ± 4°). The average LHA was –10.5° ± 10.2° for ankle and 8.2° ± 12.6° for TTC arthrodesis.
The radiographic alignment on heel strike correlated (r = 0.35–0.42; p \ 0.05 in all cases) with the HI in ankle Fig. 3A–B The radiographs show the HAV of a right TTC
arthro-desis. (A) The HAVD and HAVA are shown; white line = reconstruction of the joint line based on the length of the medial malleolus. (B) The FTGA and LHA are shown. A 6-cm lead strip at the bottom is used to assess radiographic magnification.
Fig. 4 The PRC mask for pedo-barographic evaluation divides the foot into lateral and medial heel, lateral and medial midfoot, and forefoot consisting of first, second, and lateral metatarsal head, hallux, second toe, and lateral toes.
(Table 2) but not in TTC arthrodesis (Table3). Radio-graphic alignment had no influence on the SP in ankle (Table 2) or TTC arthrodesis (Table3). During the roll-over process, the HAVA had correlations with different pedobarographic parameters in ankle arthrodesis (CI, LAMFIN, GLI: r = |0.42–0.53|; p \ 0.001 in all cases) (Table 2). In TTC arthrodesis, radiographic alignment also correlated (r = |0.48–0.49|; p \ 0.001) with the CI and LAMFIN in all cases (Table 3). However, with the fused hindfoot, the GLI correlation was weaker (r = 0.35; p = 0.02). The LHA also correlated (r = |0.34–0.6|; p = 0.01 to \ 0.001) with pedobarographic load parame-ters in ankle (Table2) and TTC arthrodesis (Table3). The Table 1. Pedobarographic parameters, definitions, and clinical meaning
Pedobarographic parameter
Definition Meaning
Heel index (HI) = PTI ([medial heel lateral heel]/total heel) (Fig.4) Medial load (positive value); lateral load (negative value) Strike point (SP) = initial heel contact measured on a line perpendicular to
the anatomic axis of the foot through the initial heel contact; the medial border was defined as 100%, the lateral border as +100%, the middle of the heel as 0% (Fig.5)
Positive value = lateral contact; negative value = medial contact
Coronal index (CI) = PTI midfoot and forefoot ([medial lateral]/total) (Fig.4)
The CI shows loading of the foot medially (positive value) or laterally (negative value) divided by the anatomic axis of the foot
Lateral medial force-time integral index (LAMFIN)
= FTI ([lateral medial]/total) (Fig.6) The LAMFIN shows if the load is more medial (negative value) or lateral (positive value) in relation to the gait line
Lateral medial area index (LAMAI)
= area ([lateral medial]/total) (Fig.6) Gait line progresses medially (= more lateral area, positive value) or laterally (= more medial area, negative value) Gait line index (GLI) = area between the gait line and anatomic axis
([medial lateral]/total) (Fig.7)
GLI shows how the gait line progresses in relation to the anatomic axis of the foot (positive value = lateral, negative value = medial progression of the gait line) PTI = pressure-time integral, FTI = force-time integral.
Fig. 5 The initial foot contact on heel strike (SP) was measured, defining the middle of the heel as 0%, the medial border as 100%, and the lateral border as +100% using the bisection of the plantar angle.
Fig. 6 Pedobarography of a patient with a TTC arthrodesis revealed an isobaric pressure picture and division of the foot by the gait line, which is created by the center of pressure during the rollover process, into medial foot and lateral foot. This is used to calcu-late the LAMAI and LAMFIN.
Fig. 7 GLI, the area between the gait line and the anatomic axis defined from the center of the heel to the center of the second toe during the rollover process of the foot, is shown in a patient with a TTC fusion.
FSA did not correlate as well with pedobarographic data as the HAVA (Tables2,3).
There was no correlation of radiographic alignment with AOFAS or SF-36 scores. The dynamic load distribution correlated with AOFAS and SF-36 scores in ankle arthro-desis: The LAMAI correlated with gait abnormality of the AOFAS score in ankle arthrodesis (r = 0.41; p = 0.02), showing the more medially the gait line runs, the better the observed gait. LAMAI also correlated with Body Pain (r = 0.42; p = 0.001) and Vitality of the SF-36 (r = 0.44; p = 0.001), showing a more medial gait line results in less pain and better vitality. For TTC arthrodesis, no correlation of pedobarography with SF-36 or AOFAS scores was noted.
The visual alignment was neutral in 45%; 39% had a varus, whereas 16% had a valgus position. Visual alignment correlated with HAVA (r = 0.5; p \ 0.001) and LHA
(r = 0.52; p \ 0.0001) (Table4). However, visual judg-ment predicted radiographic alignjudg-ment correctly in only 48% of cases (accuracy, 5.5° ± 4°). Radiographically, the HAVA correlated (r = 0.69; p \ 0.001) with LHA. The HAVD correlated (r = 0.99; p \ 0.0001) with HAVA.
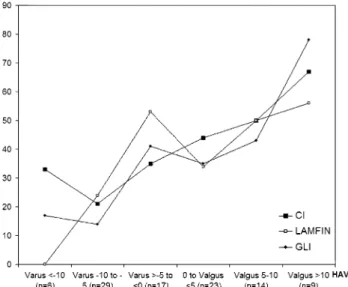
Pedobarographic measurements from healthy subjects showed the load during the rollover process was greater medially than laterally (CI, 0.33 ± 0.11; LAMFIN, 0.053 ± 0.11) and the center of pressure ran more medially (GLI, 0.54 ± 0.31). The amount of valgus positioning correlated with the percentage of patients with a normal load distribution measured by the CI, LAMFIN, GLI (r = 0.84–0.9; p \ 0.05). In ankle and TTC arthro-desis, an HAVA of 5° to 10° or greater valgus was needed to reproduce the dynamic values of normal subjects in more than half the patients (Fig.8).
Table 2. Correlations of radiographic and pedobarographic param-eters in ankle arthrodesis (n = 56)
Parameter HAVD HAVA LHA FTGA FSA Visual HI 0.42* 0.40* 0.38* 0.09 0.35* 0.15 SP 0.05 0.06 0.24 0.02 0.04 0.12 CI 0.43* 0.42* 0.34* 0.18 0.40* 0.04 LAMFIN 0.50*, 0.48*, 0.43*, 0.01 0.38* 0.05 LAMAI 0.27 0.26 0.28 0.07 0.23 0.09 GLI 0.51*, 0.53*, 0.50*, 0.25 0.51*, 0.05 * Significant correlations; significant correlations after correction for multiple testing; HAVD = hindfoot alignment view distance; HAVA = hindfoot alignment view angle; LHA = lateral heel angle; FTGA = frontal tibial ground angle; FSA = frontal strike angle; HI = heel index; SP = strike point; CI = coronal index; LAM-FIN = lateral medial force-time integral index; LAMAI = lateral medial area index; GLI = gait line index.
Table 3. Correlations of radiographic and pedobarographic param-eters in TTC arthrodesis (n = 42)
Parameter HAVD HAVA LHA FTGA FSA Visual HI 0.02 0.01 0.08 0.17 0.07 0.10 SP 0.09 0.10 0.03 0.12 0.14 0.12 CI 0.44* 0.48* 0.51*, 0.18 0.32* 0.40* LAMFIN 0.45* 0.49*, 0.60*, 0.26 0.30 0.42* LAMAI 0.29 0.32* 0.47* 0.14 0.20 0.23 GLI 0.34* 0.35* 0.54*, 0.01 0.29 0.35* * Significant correlations; significant correlations after correction for multiple testing; TTC = tibiotalocalcaneal; HAVD = hindfoot alignment view distance; HAVA = hindfoot alignment view angle; LHA = lateral heel angle; FTGA = frontal tibial ground angle; FSA = frontal strike angle; HI = heel index; SP = strike point; CI = coronal index; LAMFIN = lateral medial force-time integral index; LAMAI = lateral medial area index; GLI = gait line index.
Table 4. Correlations (r values) of radiographic parameters of hindfoot alignment
Parameter Visual HAVD HAVA LHA FTGA HAVD 0.48*,
HAVA 0.50*, 0.99*,
LHA 0.52*, 0.67*, 0.69*, FTGA 0.11 0.27* 0.27* 0.19
FSA 0.45*, 0.91*, 0.92*, 0.63*, 0.63*, * Significant correlations; significant correlations after correction for multiple testing; HAVD = hindfoot alignment view distance; HAVA = hindfoot alignment view angle; LHA = lateral heel angle; FTGA = frontal tibial ground angle; FSA = frontal strike angle.
Fig. 8 A graph shows the percentages of patients with a normal dynamic load pattern, defined in the range of the mean and ± one SD of each parameter, after ankle and TTC arthrodesis. The amount of valgus position correlated (r = 0.84–0.9; p \ 0.05) with the percent-age of patients with a normal load distribution.
Discussion
The HAV according to Saltzman and el-Khoury [37] is considered the best view to assess alignment of the hind-foot toward the tibia. In this view, healthy subjects showed medial displacement of the calcaneus corresponding to the varus position [15]. However, Buck et al. [5] suggested a valgus position was best for ankle arthrodesis. As radio-graphs only show so-called static alignment and the initial heel strike occurs laterally, it is unclear how radiographic alignment influences dynamic load during gait. Therefore, we assessed the hindfoot position in ankle or TTC arthrodesis by HAV, evaluated the influence of radio-graphic alignment on pedobaroradio-graphic load and SF-36 and AOFAS scores, evaluated the prediction of radiographic alignment by visual judgment, and measured the pedo-barographic varus/valgus load of healthy subjects to determine which is the best HAV position for ankle and TTC arthrodesis.
The study has several limitations. First, as this study was the first to correlate radiographic to pedobarographic alignment, we had no previous data to make a power analysis. Final sample size was one of convenience determined by the size of the cohort from 2003 to 2006. Second, as healthy subjects were recruited in an earlier study, there was no age or gender match as neither obvi-ously influenced varus/valgus load patterns [3]. Third, one could argue, in the straight position for obtaining the HAV radiographs, there is an unnatural amount of internal rotation. However, no difference between the amount of external rotation and hindfoot alignment was found, but the straight position was more reproducible [37]. Fourth, we did not obtain radiographs of the contralateral side, which would have helped to determine the influence of built-in external rotation of 5° to 10° in ankle arthrodesis [5]. Fifth, visual judgment was made by three different observers as patients were seen for followups. Because visual judgment is inaccurate [1, 36, 38, 44], a certain variance must be assumed which may have reduced the correlation of visual with radiographic alignment. Sixth, measurements were made with the patients in bare feet. Even though we rarely walk barefoot, because there is such a wide variety of shoe wear and shoes alter the pedoba-rographic examination to such a degree that meaningful results cannot be measured, measurements frequently are made with the patient barefoot [2,6,14,16,19,20,26,28,
40, 41]. We cannot presume we would have the same findings were the patients wearing shoes.
Intraoperative positioning by visual means resulted in a slight varus position of 1° and a relatively large SD of 7° to 8°. This is consistent with the findings of Coester et al. [12] who also measured a medial calcaneal displacement of 1.5 mm in a 22-year followup of 23 patients with ankle
arthrodesis. Navigation [34, 35] and intraoperative pedo-barography [33] are the only tools described to enhance the precision of intraoperative positioning of the hindfoot. However, the load distributions of ambulatory and anes-thetized subjects are not comparable. In addition to inadequacy of visual positioning, the varus position might have resulted from the use of straight intramedullary nails in TTC arthrodesis, which forces the hindfoot into varus making intramedullary nails with built-in valgus preferable.
Our data suggest radiographic alignment of the HAV influences the dynamic load distribution. Chang et al. [7] found a correlation of the visual hindfoot position with dynamic load in spastic feet in patients with cerebral palsy. We found no correlation of radiographic hindfoot alignment with SF-36 or AOFAS scores. However, to conclude a fusion in any position is acceptable cannot be made because of the short followup of the study; with a longer followup, differences might be discovered. In a 10-year followup of ankle arthrodesis, Buck et al. [5] found a valgus position is more advantageous and provides a more normal gait. The missing correlation of radiographic alignment with SF-36 and AOFAS scores also might be explained by the facts that almost all patients had comor-bidities (eg, rheumatoid arthritis, heart disease, pulmonary disease, obesity, mental illness, postspinal or shoulder surgery), which decreased AOFAS and SF-36 scores unrelated to any foot condition and that 93% of patients had arthritis in the subtalar and/or midfoot joints at the time of followup.
Visual judgment only predicted radiographic alignment in 48%. The inaccuracy of visual judgment also has been reported by others [1,36,38,44]. Although the reliability of clinical measurement is improved by using a goniometer and a weightbearing position, clinical approaches are less reliable than a radiographic approach [5,13,38].
Our findings of healthy subjects show 33% more load medially related to the anatomic axis of the foot. Richter et al. [33] assumed a 50:50 medial:lateral force distribution for intraoperative pedobarography without measuring healthy subjects. Others have found a medial displacement of the hindfoot in healthy subjects corresponding to a slight varus position of 1° to 6° [21, 37, 42]. This raises the question of why the best position of an ankle arthrodesis should be in 0° to 10° valgus according to Buck et al. [5], Morrey and Wiedeman [29], and our results. Support for hindfoot valgus is based on the concept that valgus position causes pronation of the foot that unlocks the midtarsal joints, allowing more natural motion of the hindfoot, whereas varus locks the midtarsal joints [25,30]. Another rationale might be that the ankle exhibits inversion/ever-sion of 5° [24], which is not possible with arthrodesis; thus the hindfoot must be in slight valgus.
We believe the HAV should be performed routinely to assess hindfoot alignment. Ankle and TTC arthrodesis should be fused in valgus of 5° to 10° in the HAV to reproduce a physiologic load pattern. Better means for intraoperative positioning are needed to obtain a valgus hindfoot position and greater precision, as for example in TKA. New alignment techniques, such as navigation, intraoperative pedobarography, or extramedullary align-ment guides, should be developed further. Varus position occurs because visual judgment is not accurate and because the use of a straight nail in TTC may force the hindfoot into varus. Therefore, intramedullary nails with built-in valgus may be preferable to straight nails.
Acknowledgments We thank Dr. Dougall and Dr. Russell from the Department of Foot and Ankle Surgery, University of Calgary, Canada, for support and providing cases. We also thank Laura Hinz and Leah Diaz for helping to follow the patients.
References
1. Backer M, Kofoed H. Passive ankle mobility: clinical measure-ment compared with radiography. J Bone Joint Surg Br. 1989;71: 696–698.
2. Baumann JH, Girling JP, Brand PW. Plantar pressures and trophic ulceration: an evaluation of footwear. J Bone Joint Surg Br. 1963;45:652–673.
3. Bosch K, Nagel A, Weigend L, Rosenbaum D. From ‘‘first’’ to ‘‘last’’ steps in life: pressure patterns of three generations. Clin Biomech (Bristol, Avon). 2009;24:676–681.
4. Brinker M. Review of Orthopaedic Trauma. Philadelphia, PA: WB Saunders; 2001.
5. Buck P, Morrey BF, Chao EY. The optimum position of arthrodesis of the ankle: a gait study of the knee and ankle. J Bone Joint Surg Am. 1987;69:1052–1062.
6. Burns J, Crosbie J, Hunt A, Ouvrier R. The effect of pes cavus on foot pain and plantar pressure. Clin Biomech (Bristol, Avon). 2005;20:877–882.
7. Chang CH, Miller F, Schuyler J. Dynamic pedobarograph in evaluation of varus and valgus foot deformities. J Pediatr Orthop. 2002;22:813–818.
8. Charlson ME, Pompei P, Ales KL, MacKenzie CR. A new method of classifying prognostic comorbidity in longitudinal studies: development and validation. J Chronic Dis. 1987;40: 373–383.
9. Child BJ, Hix J, Catanzariti AR, Mendicino RW, Saltrick K. The effect of hindfoot realignment in triple arthrodesis. J Foot Ankle Surg. 2009;48:285–293.
10. Cobey JC. Posterior roentgenogram of the foot. Clin Orthop Relat Res. 1976;118:202–207.
11. Cobey JC, Sella E. Standardizing methods of measurement of foot shape by including the effects of subtalar rotation. Foot Ankle. 1981;2:30–36.
12. Coester LM, Saltzman CL, Leupold J, Pontarelli W. Long-term results following ankle arthrodesis for post-traumatic arthritis. J Bone Joint Surg Am. 2001;83:219–228.
13. Cohen J. Statistical Power Analysis for the Behavioral Sciences. Ed 2. New York, NY: Routledge Academic; 1988.
14. Cooper DM, Dietz FR. Treatment of idiopathic clubfoot: a thirty-year follow-up note. J Bone Joint Surg Am. 1995;77:1477–1489.
15. Coughlin M, Mann R, Saltzman C, eds. Surgery of the Foot and Ankle. Ed 8. Philadelphia, PA: Elsevier; 2007.
16. Duckworth T, Boulton AJ, Betts RP, Franks CI, Ward JD. Plantar pressure measurements and the prevention of ulceration in the diabetic foot. J Bone Joint Surg Br. 1985;67:79–85.
17. Giannini S, Buda R, Faldini C, Vannini F, Romagnoli M, Grandi G, Bevoni R. The treatment of severe posttraumatic arthritis of the ankle joint. J Bone Joint Surg Am. 2007;89(suppl 3):15–28. 18. Hennessy MS, Molloy AP, Wood EV. Management of the varus
arthritic ankle. Foot Ankle Clin. 2008;13:417–442, viii. 19. Holmes GB Jr, Timmermann L. A quantitative assessment of the
effect of metatarsal pads on plantar pressures. Foot Ankle. 1990; 11:141–145.
20. Hutton WC, Dhanendran M. The mechanism of normal and hallux valgus feet: a quantitative study. Clin Orthop Relat Res. 1981;157:7–13.
21. Johnson JE, Lamdan R, Granberry WF, Harris GF, Carrera GF. Hindfoot coronal alignment: a modified radiographic method. Foot Ankle Int. 1999;20:818–825.
22. Kitaoka HB, Alexander IJ, Adelaar RS, Nunley JA, Myerson MS, Sanders M. Clinical rating systems for the ankle-hindfoot, mid-foot, hallux, and lesser toes. Foot Ankle Int. 1994;15:349–353. 23. MacWilliams BA, Armstrong PF. Clinical applications of plantar
pressure measurement in pediatric orthopedics. Pediatr Gait. 2000;40:143–150.
24. MacWilliams BA, Cowley M, Nicholson DE. Foot kinematics and kinetics during adolescent gait. Gait Posture. 2003;17:214– 224.
25. Mann RA. Surgical implications of biomechanics of the foot and ankle. Clin Orthop Relat Res. 1980;146:111–118.
26. Metaxiotis R, Accles W, Pappas A, Doederlin L. Dynamic pedobarography (DPB) in operative management of cavovarus foot deformity. Foot Ankle Int. 2000;21:935–947.
27. Miller M. Review of Orthopaedics. Ed 4. Philadelphia, PA: WB Saunders; 2004.
28. Minns RJ, Craxford AD. Pressure under the forefoot in rheu-matoid arthritis: a comparison of static and dynamic methods of assessment. Clin Orthop Relat Res. 1984:187:235–242. 29. Morrey BF, Wiedeman GP Jr. Complications and long-term
results of ankle arthrodesis following trauma. J Bone Joint Surg Am. 1980;62:777–784.
30. Morris JM. Biomechanics of the foot and ankle. Clin Orthop Relat Res. 1977;122:10–17.
31. Pagenstert GI, Hintermann B, Barg A, Leumann A, Valderrabano V. Realignment surgery as alternative treatment of varus and valgus ankle osteoarthritis. Clin Orthop Relat Res. 2007;462: 156–168.
32. Rammelt S, Grass R, Zawadski T, Biewener A, Zwipp H. Foot function after subtalar distraction bone-block arthrodesis: a prospective study. J Bone Joint Surg Br. 2004;86:659–668. 33. Richter M, Frink M, Zech S, Vanin N, Geerling J, Droste P,
Krettek C. Intraoperative pedography: a validated method for static intraoperative biomechanical assessment. Foot Ankle Int. 2006;27:833–842.
34. Richter M, Zech S. Computer assisted surgery (CAS) guided arthrodesis of the foot and ankle: an analysis of accuracy in 100 cases. Foot Ankle Int. 2008;29:1235–1242.
35. Richter M, Zech S, Bay R. 3D imaging (ARCADIS)-based computer assisted surgery (CAS) for nail placement in combined ankle and subtalar fusion. Foot Ankle Int. 2008;29:1249–1252. 36. Saltzman CL, Brandser EA, Berbaum KS, DeGnore L, Holmes
JR, Katcherian DA, Teasdall RD, Alexander IJ. Reliability of standard foot radiographic measurements. Foot Ankle Int. 1994; 15:661–665.
37. Saltzman CL, el-Khoury GY. The hindfoot alignment view. Foot Ankle Int. 1995;16:572–576.
38. Saltzman CL, Nawoczenski DA, Talbot KD. Measurement of the medial longitudinal arch. Arch Phys Med Rehabil. 1995;76:45– 49.
39. Simoneau GG, Ulbrecht JS, Derr JA, Becker MB, Cavanagh PR. Postural instability in patients with diabetic sensory neuropathy. Diabetes Care. 1994;17:1411–1421.
40. Stockley I, Betts RP, Rowley DI, Getty CJ, Duckworth T. The importance of the valgus hindfoot in forefoot surgery in rheumatoid arthritis. J Bone Joint Surg Br. 1990:72:705– 708.
41. Stokes IA, Faris IB, Hutton WC. The neuropathic ulcer and loads on the foot in diabetic patients. Acta Orthop Scand. 1975;46:839–847. 42. van Bergeyk AB, Younger A, Carson B. CT analysis of hindfoot alignment in chronic lateral ankle instability. Foot Ankle Int. 2002;23:37–42.
43. Ware JE, Kosinski M, Dewey JE. How to Score Version 2 of the SF-36 Health Survey. Lincoln, RI: QualityMetric Inc; 2000. 44. Weseley MS, Koval R, Kleiger B. Roentgen measurement of
ankle flexion-extension motion. Clin Orthop Relat Res. 1969;65: 167–174.