Z Gerontol Geriat 2010 · 43:13–18 DOI 10.1007/s00391-009-0090-0 Eingegangen: 13. Oktober 2009 Akzeptiert: 18. Oktober 2009 Online publiziert: 11. Dezember 2009 © Springer-Verlag 2009
W. Ruch · R.T. Proyer · M. Weber Section on Personality and Assessment,
Department of Psychology, University of Zurich, Switzerland
Humor as a character
strength among the elderly
Empirical findings on age-related changes
and its contribution to satisfaction with life
Ruch et al. [18] argued that there is a lack of empirical data on humor in the elderly. Such studies are of theoreti-cal but also of practitheoreti-cal value as th-ey increase our knowledge on the to-pic but also may provide hints of how to use humor in daily practice. The-re aThe-re some older studies and The-reviews on the topic [4, 5, 15] and recently Proyer et al. [12] found that the sense of humor was quite stable across the lifespan. However, elderly people dis-played a higher positive mood but in-dicated laughing less and less easily than younger participants. Similar re-sults are not yet available for the Va-lues in Action Inventory of Strengths (the VIA-IS) [9, 17], which is the stan-dard instrument to assess strengths of character.
As Ruch et al. [18] pointed out, character strengths are assumed to contribute to a good life and hence a positive correlation between humor and satisfaction with life is expected. However, recent articles un-derline the importance of distinguishing between different aspects of satisfaction with life [7]. Thus, different measures should be included if well-being is studied. The aim of this paper is twofold. First, we want to describe age-related changes in the VIA-IS humor scale in a cross-sectio-nal design. Second, we studied the relati-on between humor and satisfactirelati-on with life in the elderly. We analyzed this rela-tion in a large data set with a special fo-cus on aged participants. To fulfill the
sug-gestion by Park et al. [7], we not only in-cluded a measure of satisfaction with life itself but also a measure on three diffe-rent orientations to happiness: a pleasu-rable life, a meaningful life, and an enga-ged life (see [14] for an overview). The lat-ter relations will be studied for the entire sample as well as for various subgroups of elderly. This analysis allows not only the testing of direct relations but also of pu-tative mediating effects (e.g., via hedo-nism, having a pleasurable life) between humor and well-being. As humor is a reli-able way of inducing positive emotions, it is expected that humor will be most high-ly correlated with a pleasurable life. Ne-vertheless, humor may keep group mora-le high and it may be used for the benefit of others. Hence, lower but positive corre-lations were expected for an engaged and a meaningful life.
Method
Participants
The sample consisted of 42,964 German-speaking respondents. There were mo-re female than male subjects (69% versus 31%), and the mean age of the respondents was 37.83 years (SD=12.80) with a ran-ge across the adult years. Relative to the general population, the sample was mo-re highly educated and many had college degrees (66%). However, the education of the participants ranged from less than compulsory education to post-baccalau-reate. Although a self-selected group was
studied, the range in professions was im-pressive and this sample is certainly mo-re diverse than the typical sample of uni-versity students. Subgroups of the sample filled in other instruments, and these did not differ in the basic statistics from the total sample. For example, the 17,479 par-ticipants who completed the scale about satisfaction with life had a mean age of 38.48 years (SD=12.68) and 69% were wo-men.
Instruments
The humor scale from the Values in
Ac-tion Inventory of Strengths (VIA-IS; [9,
17]) consists of ten items (e.g., “Whenever my friends are in a gloomy mood, I try to tease them out of it”). It uses a five-point Likert-style answer format (1=”very much unlike me” through 5=”very much like me”). The coefficient alpha was computed and the scale demonstrated a high reliabi-lity (α=0.86). Data on the other 23 scales were also available and will be commented upon briefly; however, the analyses focus primarily on the humor scale.
The Satisfaction with Life Scale (SWLS; [1]) is a five-item measure of satisfac-tion with life (as a global cognitive judg-ment of one’s own life). A sample item is “The conditions of my life are excellent.” It uses a seven-point answer format (from 1=“strongly disagree” through 7=“strongly agree”). The alpha-coefficient was 0.86 in the present sample.
The Orientations to Happiness
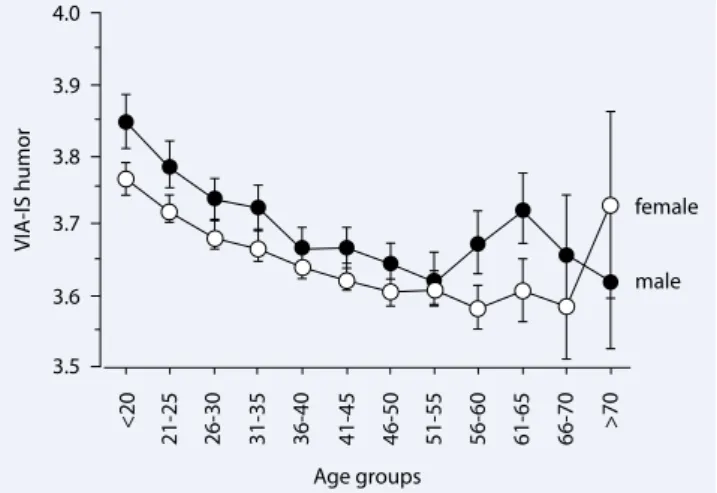
adaptati-Fig. 1 9 Scores in VIA-IS humor scale (with 95% confidence inter-val) by gender and age 4.0 female Age groups <20 21-25 26-30 31-35 36-40 41-45 46-50 51-55 56-60 61-65 66-70 >70 VIA-IS humo r male 3.9 3.8 3.7 3.6 3.5
on see [14]) assesses three different ways to be happy (through pleasure, through engagement, and through meaning). The scale consists of 18 items (six items for each of the scales; e.g.,“Regardless of what I am doing, time passes very quick-ly;” i.e., life of engagement). Answers are given on a five-point scale ranging from 1=“very much unlike me” through 5=“ve-ry much like me.” All three scales yielded between sufficient and high reliabilities with α=0.74 for a life of pleasure, α=0.65 for a life of engagement, and α=0.76 for a life of meaning.
Procedure
All participants completed the questi-onnaires via an online platform (http:// www.charakterstaerken.org). They regis-tered, provided socio-demographic infor-mation, and then completed the measures sections. All participants received imme-diate feedback after completion of all ques-tions on their individual results. We aimed at collecting a broad sample and therefore posted advertisements in newspapers and magazines. Additionally, we wrote to spe-cific institutions (e.g., homes for elderly, clubs for seniors) to address the target po-pulation directly.
Though data collection via the Inter-net is sometimes criticized, there are em-pirical studies showing that Internet-ba-sed studies are usually as reliable and va-lid as paper–pencil based methods (mo-re traditional strategies) and that samples collected via the Internet are usually more diverse than other samples [2].
Results
Humor across the lifespan
The distribution statistics for the VIA-IS humor scale (M=3.70, SD=0.60) were comparable to the norm data established for the paper and pencil administration. As in prior studies, the correlations with age were negative but marginal (r=−0.07;
p<0.001) and men scored marginally
hig-her than women (r=−0.04; p<0.001). However, age and gender were confoun-ded with more men among the older par-ticipants (r=−0.05; p<0.001). To disen-tangle possible effects of age and gender, it was decided to analyze men and women for each of 12 age groups separately:
<20 years, n=3902, 71.4% females; 21–25 years, n=4,959, 71.1% females; 26–30 years, n=5,536, 70.0% females; 31–35 years, n=4,915, 69.1% females; 36–40 years, n=5,258, 69.9% females; 41–45 years, n=5,914, 71.2% females; 46–50 years, n=5,091, 71.3% females; 51–55 years, n=3,429, 70.6% females; 56–60 years, n=2,167, 63.5% females; 61–65 years, n=1,118, 54.2% females; 66–70 years, n=444, 50.5% females; >70 years, n=230, 38.7% females. It can be seen that up to age 60 the female subjects formed about 70% of the samp-le, but thereafter the percentage of female subjects dropped continually up to the ol-dest age group (χ2(11)=370.09, p<0.0001).
A 12 (age groups) by 2 (gender) ANO-VA was performed for the VIA-IS humor scale as dependent variables. The inter-action between age and gender failed to be significant (F(11, 42939)=1.523, p=0.12).
However, overall men tended to score higher than women (F(1, 42939)=19.841;
p<0.0001), and there were age-related
dif-ferences (F(11, 42939)=29.343; p<0.0001). The mean scores in humor across the age groups for males and females separately are presented in . Fig. 1.
It is shown that overall the age- and gender-related differences were not lar-ge. The largest difference between two age groups and the two genders did not exceed 1/3 and 1/6 of the standard devi-ation, respectively. Nevertheless, some trends could be observed: the scores de-creased with age between those in their teenage years and those in their 50s. At least for males, higher scores were obser-ved for the age group 61–65 years. Males tended to score higher in humor than fe-males in the four youngest groups and between 56 and 65 years. In the oldest group, females scored numerically high-er than males, but this was not significant. These groups of females also scored hig-her than the females of the age group 56– 60 years (p<0.05).
From the socio-demographic data, the relationship status was of greatest in-terest, as humor was often a means for being attractive to the preferred partner and is used as a dating strategy. Among those younger than 20 years, singles had higher scores in humor than either mar-ried or separated/divorced participants. For those in their 20s, singles had higher scores than married participants. Among those between the ages of 41 and 50 years and those between 51 and 60, singles and married participants had significantly lower humor scores than separated/divo-rced participants (p<0.001). For the lat-ter group, this was also particularly true for females, where singles had even lower humor scores than married participants. There were no differences with respect to relationship status among those between 61 and 70 and those older than 70 years.
Humor and satisfaction with life
Humor correlated with the Satisfac-tion with Life Scale in the total sample (r=0.312, df=15,588, p<0.0001). This co-efficient is higher than the average of all 24 coefficients (M=0.27). Individual coef-ficients ranged from 0.02 (for modesty) to14 |
Zeitschrift für Gerontologie und Geriatrie 1 · 20100.58 (for hope). The coefficients for males (r=0.33) and females (r=0.30) were com-parable. Within all 24 strengths, the coef-ficients for humor ranked seventh for fe-males and eighth for fe-males.
Perhaps some aspects of the humor scale are more associated with life satisfac-tion than others. Therefore, the individu-al humor items were examined separately. Spearman correlations revealed that each of the ten items correlated positively with life satisfaction with the lowest coeffici-ent being r=0.08. The highest individu-al correlations could be found for (in de-scending order): “I believe life is more of a playground than a battlefield” (r=0.39), “I try to add some humor to whatever I do” (r=0.27), “I try to have fun in all kinds of situations” (r=0.26), “I never allow a gloo-my situation to take away gloo-my sense of hu-mor” (r=0.24), and “Most people would say I am fun to be with” (r=0.23). Thus, the highest correlation was found for the item depicting a playful attitude towards life.
Are the oldest age groups unique?
The relationship between humor and sa-tisfaction with life might be different for older people. One argument would be that the relative importance of humor di-minishes, because additional variables, for example, health or financial issues have an impact on well-being. However, one could also argue the opposite and claim that hu-mor will determine how people deal with emerging age-related adversities. Thus, humor might be a buffer preventing stres-sors from reducing one’s quality of life. We divided the sample into seven age-groups and computed the correlations between the humor scale, on the one hand, and sa-tisfaction with life and the three orienta-tions to happiness on the other (control-ling for the effects of gender). The partial correlations are presented in . Tab. 1.It is shown that for all age groups hu-mor correlated highest with a pleasurable life, followed by satisfaction with life, an engaged life and a meaningful life. Whi-le the size of the coefficients did not vary much, a few trends were observed. First, the coefficients for the oldest group were always the lowest, i.e., there was a drop between the 61 to 70-year-olds and the >70-year-olds. It should be noted that a
re-Z Gerontol Geriat 2010 · 43:13–18 DOI 10.1007/s00391-009-0090-0 © Springer-Verlag 2009
W. Ruch · R.T. Proyer · M. Weber
Humor as a character strength among the elderly. Empirical findings
on age-related changes and its contribution to satisfaction with life
AbstractBackground. Positive psychology studies what is best in people. In their classification of strengths and virtues, Peterson and Selig-man [11] assign humor to the virtue of tran-scendence. Thus far, there is no specific study that deals with age-related changes in humor (as a strength of character) across a lifespan and its relation to well-being in the elderly. Participants and methods. A total of n=42,964 participants completed an on-line questionnaire on humor as a strength of character. Participants also completed the Satisfaction with Life Scale and the Orienta-tions to Happiness Scale.
Results. In a cross-sectional design, the scores for humor decreased until the age of 50. Men between 51 and 62 years had high-er scores; thhigh-ere was a trend for women
old-er than 70 to score highold-er (but this was not statistically significant). Humor was robustly positively correlated with life satisfaction, as well with a pleasurable and an engaged life, but was lowest with a meaningful life. The oldest participants had the lowest (yet still meaningful) correlation coefficients (with the exception of a meaningful life).
Conclusion. The study contributes to the un-derstanding of humor across the lifespan and underlines the importance of studies among the elderly within a framework of positive psychology.
Keywords
Aging · Humor · Orientations to happiness · Positive psychology · Satisfaction with life
Humor als Charakterstärke bei älteren Menschen.
Empirische Befunde zu altersabhängigen Veränderungen
und zum Beitrag von Humor zur allgemeinen Lebenszufriedenheit
ZusammenfassungHintergrund. Die Positive Psychologie un-tersucht das Beste im Menschen. Humor wird als Charakterstärke verstanden, die der Tu-gend Transzendenz zugeordnet wird. Stichprobe und Methoden. Insgesamt 42.964 Teilnehmer/innen bearbeiteten online einen Fragebogen für Humor als Charakter-stärke, eine Lebenszufriedenheitsskala sowie eine Skala zu Orientierungen zum Glück. Ergebnisse. In einem Querschnittsdesign sanken die Humorwerte der Teilnehmer bis zum Alter von 50 Jahren. Männer zwischen 61 und 65 erzielten höhere Werte. Humor war bedeutsam mit Lebenszufriedenheit kor-reliert und ebenso mit dem „vergnüglichen
Leben“, dem „engagierten Leben“, aber am niedrigsten mit dem „bedeutsamen Leben“. Dies fand sich (mit Ausnahme des „bedeut-samen Lebens“) auch für die ältesten Teilneh-mer/innen.
Fazit. Die Studie trägt zum Verständnis von Humor über die gesamte Lebensspanne bei und zeigt den Nutzen, Humor im Rahmen von Konzepten aus der Positiven Psychologie bei älteren Menschen zu erforschen. Schlüsselwörter
Altern · Humor · Lebenszufriedenheit · Orientierungen zum Glück · Positive Psychologie
duced variability in humor scores can not fully account for the effects. While the two oldest groups had the lowest standard de-viation in most of the scales, the 61 to 70-year-old group had the lowest variability but correlations were not reduced. Thus, one might look for content-related inter-pretations. For example, this could me-an that humor is less integrated into the three orientations to happiness and is less predictive of satisfaction with life during that age period. Second, for two variab-les (satisfaction with life and life of pleasu-re) the coefficients tended to decline with age (i.e., those variables seemed to be mo-re pmo-redictive during earlier years than du-ring later years), while engagement and meaning seemed to have an inverted U-shape (i.e., they were also less predictive for people younger than 20 years). How-ever, the differences in the correlations can partly be accounted for by differences in the standard deviations, which, in turn, are a function of the means. For example, for satisfaction with life and life of pleasu-re, the medians and standard deviations had a correlation of −0.80. Higher means went along with smaller standard devia-tions, perhaps mainly due to a ceiling ef-fect. Nevertheless, these trends do not account for the results found for the ol-dest group, which at the same time has the most unstable parameters due to ha-ving the smallest number of people in the sample. Thus, for the group of older par-ticipants the findings regarding satisfac-tion with life and orientasatisfac-tions to happi-ness still hold.
Discussion
Humor as a character strength is an inte-resting addendum to the various trait
con-cepts of humor, and by pursuing a posi-tive psychology approach, one can focus on what role humor plays in various as-pects of a good life among the elderly. The present study shows that the VIA-IS mor scale is a very reliable measure of hu-mor as a character strength and it can also be used with older populations.
Humor from a positive psychology
lifespan perspective
Overall, the humor scores did not vary much across the lifespan, but a few trends are noteworthy. In the cross-sectional de-sign in our study, humor declined with age but was higher again for people in their 60s. Thus, there was a decline but this was not linear; in addition there seems to be a trend for higher scores for people in the older age groups. The pattern was similar for males and females; males scored high-er in most of the age groups.
E Therefore, it can be concluded
that there seem to be some changes across the lifespan.
These changes might be related to diffe-rent roles that people have to fulfill at cer-tain stages in their lives.
However, as a limitation of the research design, it has to be noted that we con-ducted an online survey. Therefore, one might conclude that those elderly persons who had access to the Internet and were able to complete the study online might differ from others in their age group who are less active and less interested in mo-dern technology. Furthermore, people in-terested in positive psychology and wan-ting to learn more about their strengths might be overrepresented. In addition,
higher levels of education were overrep-resented, and the data might reflect a co-hort effect that may not be found in lon-gitudinal data.
Nevertheless, it is difficult to argue that this will affect certain age groups but not others. Further data will be needed (e.g., collected in paper–pencil format or with different research methods, which may in-clude personal interviews or behavior ob-servations) to test empirically whether our oldest group differs in any way from the others. In any case, humor seems to be re-levant among elderly people. As there are studies that support the notion of a po-sitive influence of popo-sitive affectivity on aging (e.g., [6]), humor might be a poten-tial cue for positive aging—perhaps in the sense of a mature defense mechanism as put forward by Vaillant [19, 20, 21, 22].
Humor and satisfaction
with life among the elderly
Overall, humor correlates with satisfac-tion with life with a coefficient of 0.31. Thus, humor explains about 10% in the variance in satisfaction with life. The co-efficient certainly would be higher if cor-rected for disattenuation. However, such a correction is not undertaken as one could also argue that the correlation is based on self-reports and therefore might be infla-ted. Six or seven strengths did yield a hig-her correlation coefficient, namely ho-pe, zest, love, curiosity, gratitude, persis-tence, and bravery (males only), while 17 strengths for females and 16 strengths for males had lower coefficients. The first five strengths have been repeatedly iden-tified as having greater importance than the others [8] and humor is not a candi-date for this list. However, humor is se-cond or third in the sese-cond group of im-portant predictors of satisfaction with life. More importantly, previous results do not indicate that there can be “too much” of a strength. A more detailed analysis of these data [13] showed that increases in humor tended to result in increments in satisf-action with life. The function was linear for most of the humor continuum (if not the entire spectrum). For very low levels of this strength the relationship might be steeper suggesting a mild quadratic trend superimposed on a dominant linear
func-Tab. 1 Partial correlations between humor and satisfaction with life and three orienta-tions to happiness in different age groups (controlled for gender) Age groups ≤20 21–30 31–40 41–50 51–60 61–70 >70 Pleasure 0.450*** 0.440*** 0.433*** 0.463*** 0.440*** 0.441*** 0.378*** Engagement 0.233*** 0.282*** 0.287*** 0.303*** 0.288*** 0.281*** 0.247** Meaning 0.159*** 0.206*** 0.210*** 0.237*** 0.229*** 0.236*** 0.145 n 1,556 4,999 5,101 5,367 2,629 738 117 SWLS 0.339*** 0.324*** 0.297*** 0.318*** 0.326*** 0.310*** 0.261** n 1,288 4,121 4,267 4,609 2,375 689 109
SWLS Satisfaction with Life Scale.**p<0.01; ***p<0.001.
16 |
Zeitschrift für Gerontologie und Geriatrie 1 · 2010mor as a strength of character. It should be noted that strengths are unipolar and we did not measure “humorlessness” but just low levels of this strength.
>
Increases in humor tended
to result in increments in
satisfaction with life
Humor and happiness were also correla-ted among the oldest groups. While the coefficient is lower one can not say with certainty that this is indeed a reduction in the strengths of the relationship or whether this is merely a peculiarity of this subsample (i.e., bias due to small samp-le size). It might be of interest to replicate this finding with a sample of elderly, and to see whether other forms of humor (e.g., humor representing a more philosophical view of the world, or humor as a coping tool) become increasingly more predictive with increasing age.
test for causality, one would need to con-duct a training of humor and see whether satisfaction with life increases thereafter. Nevertheless, the data show that humor is at least an indicator of satisfaction with life, if not an antecedent condition.
Further analyses of these data [13] show that the relationship between humor and satisfaction with life is only partially me-diated by the three known orientations to happiness and humor contributes to satisf-action with life beyond the effects of the-se. As expected, the present study showed that humor was most strongly associated with a pleasurable life. This was true for all age-spans that were studied including the sample of elderly participants.
E Humor is conducive to laughter and
positive emotions and, thus, is an easy way to add enjoyment to daily life.
tions more often and approach life more playfully. However, humor correlates with satisfaction with life even after the contri-bution of the life of pleasure is controlled for [13]. Thus, the relation between hu-mor and satisfaction with life goes bey-ond hedonistic aspects. Humor was also correlated with the engaged life and this accounted for another part of the relati-on between humor and satisfactirelati-on with life, and finally a life of meaning. The ana-lysis of individual items showed that the latter was particularly correlated with hu-mor aimed at helping others [13]. What re-mains is a coefficient of 0.18 that is un-explained by the three orientations (and age and gender) and this is then unique to humor. However, it is not implausib-le that humor has effects on satisfaction with life that go beyond pleasure, enga-gement and meaning. For example, one might think that humorous people ha-ve more friends and engage in more
cial activities, which, in turn, enhances their satisfaction with life. Being a humo-rous person might also facilitate intimate relationships, which again might have a positive impact on well-being. Last but not least, humor and laughter might ha-ve health consequences (e.g., humor as a buffer against stress, laughter as a pain kil-ler). Clearly, the overlap between humor and the three orientations to happiness in a prediction should involve other aspects of humor as well, especially when the stu-dy is aimed at illuminating the good life among the elderly. For example, it is like-ly that meaning and a more philosophi-cal humor will be more directly correla-ted among the elderly than among ado-lescents.
A comprehensive positive psychologi-cal account of humor in the elderly should not only study humor as a strength, but also look at the nature of positive expe-riences, such as amusement or hilarity (and their consequences), the role of hu-mor in positive relationships (e.g., joking relationships; supporting vs. destructive nature of the humor used), and the ro-le of humor in the definition of positive environments. The latter is of special im-portance as humor is beginning to be re-cognized as a quality feature in health ca-re institutions (e.g., [3, 16]).
Conclusion
Humor contributes to well-being in high-er age and should be further considered in research and practice. Positive psycho-logy provides a framework for studying the determinants of successful aging. El- derly people do not seem to be less inte- rested in humor but it seems as if play-fulness or finding humor in everyday life may sometimes need to be retrained. In both older and younger people, hu-mor is a potent predictor of satisfaction with life. Furthermore, males scored higher than females in humor in all age groups, ex-cept in the oldest group where there is a possible change in this trend. This might imply different handling by individu-als during different stages of life. Finally, humor can be trained and improved by standardized programs; however, the ap-plicability of such programs for people of different ages needs to be tested further.Corresponding address
Prof. Dr. W. Ruch Section on Personality and Assessment, Department of Psychology, University of Zurich, Binzmühlestr. 14/7, 8050 Zurich, Switzerlandw.ruch@psychologie.uzh.ch
Acknowledgments. The authors wish to thank the
participants who spent their time filling in the various questionnaires at htttp://www.charakterstaerken.org.
Conflict of interest. The corresponding author states
that there are no conflicts of interest.
References
1. Diener E, Emmons RA, Larsen RJ, Griffin S (1985) The satisfaction with life scale. J Pers Assess 49:71– 75
2. Gosling SD, Vazire S, Srivastava S, John OP (2004) Should we trust web-based studies? A compara-tive analysis of six preconceptions about Internet questionnaires. Am Psychol 59:93–104 3. Hirsch RD, Kranzhoff EU (2004) Humorgruppe mit
alten Menschen: Ergebnisse einer therapiebeglei-tenden Untersuchung. Gruppenpsychotherapie und Gruppendynamik 40:106–129
4. McGhee PE, Ruch W, Hehl FJ (1990) A personali-ty-based model of humor development during adulthood. Humor 3:119–146
5. Nahemov L, McCluskey-Fawcett KA, McGhee PE (eds) (1986) Humor and aging. Academic Press, New York
6. Ostir GV, Ottenbacher KJ, Markides KS (2004) On-set of frailty in older adults and the protective role of positive affect. Psychol Aging 19:402–408 7. Park N, Peterson C, Ruch W (2009) Orientations to
happiness and life satisfaction: national compari-sons. J Posit Psychol 4:273–279
8. Park N, Peterson C, Seligman MEP (2004) Strengths of character and well-being. J Soc Clin Psychol 23:603–619
9. Peterson C, Park N, Seligman MEP (2005) Assess-ment of character strengths. In: Koocher GP, Nor-cross JC, Hill III SS (eds) Psychologists’ desk refe-rence, 2nd edn. Oxford University Press, New York, pp 93–98
10. Peterson C, Park N, Seligman MEP (2005) Orienta-tions to happiness and life satisfaction: the full life versus the empty life. J Happiness Stud 6:25–41 11. Peterson C, Seligman MEP (2004) Character
strengths and virtues: a handbook and classifica-tion. APA, Washington/DC
12. Proyer RT, Ruch W, Müller L (2010) Sense of humor among the elderly: findings with the German ver-sion of the SHS. Z Gerontol Geriatr 1:(this issue) 13. Ruch W (2009) The relation among measures of
humor and the VIA-IS humor scale. Unpublished raw data. Department of Psychology. University of Zurich, Switzerland
14. Ruch W, Harzer C, Proyer RT et al (2009) Ways to happiness in German-speaking countries: the ad-aptation of German paper–pencil and online ver-sion of the Orientations to Happiness Scale. Eur J Psychol Assess (in press)
15. Ruch W, McGhee PE, Hehl FJ (1990) Age differences in the enjoyment of incongruity-resolution and nonsense humor during adulthood. Psychol Aging 5:348–355
16. Ruch W, Müller L (2009) Wenn Heiterkeit zur Thera-pie wird. Geriatr Prax Osterr 3:22–24
17. Ruch W, Proyer RT, Harzer C et al (2009) The Ger-man version of the self- and peer-rating form of the Values in Action Inventory of Strengths (VIA-IS): adaptation and validation studies. (submitted) 18. Ruch W, Proyer RT, Weber M (2010) Humor as a
character strength among the elderly: theoretical considerations. Z Gerontol Geriatr 1:(this issue) 19. Vaillant GE (1977) Adaptation to life. Little Brown,
Boston
20. Vaillant GE (1995) Natural history of alcoholism re-visited. Harvard University Press, Cambridge/MA 21. Vaillant GE (2002) Aging well. Little Brown, Boston 22. Vaillant GE (2004) Positive aging. In: Linley AP,
Joseph S (eds) Positive psychology in practice. Wi-ley, New York, pp 561–578