ORIGINAL ARTICLE
Ink-jet printout of radiographs on transparent film and glossy
paper versus monitor display: an ROC analysis
Sebastian Kühl&Frank Krummenauer&
Dorothea Dagassan-Berndt&Thomas J. Lambrecht&
Bernd d’Hoedt&Ralf Kurt Willy Schulze
Received: 20 October 2009 / Accepted: 23 February 2010 / Published online: 20 March 2010 # Springer-Verlag 2010
Abstract The aim of this study was to compare the depiction ability of small grayscale contrasts in ink-jet printouts of digital radiographs on different print media with CRT monitor. A CCD-based digital cephalometric image of a stepless aluminum wedge containing 50 bur holes of different depth was cut into 100 isometric images. Each image was printed on glossy paper and on transparent film by means of a high-resolution desktop inkjet printer at specific settings. The printed images were viewed under standardized conditions, and the perceptibility of the bur holes was evaluated and compared to the perceptibility on a 17-in CRT monitor. Thirty observers stated their blinded decision on a five-point confidence scale. Areas (Az) under receiver operating charac-teristics curves were calculated and compared using the pair wise sign tests. Overall agreement was estimated using Cohen’s kappa device and observer bias using McNemar’s test. Glossy paper prints and monitor display revealed
significantly higher (P<0.001) average Az values (0.83) compared to prints on transparent film (0.79), which was caused by higher sensitivity. Specificity was similar for all modalities. The sensitivity was dependent on the mean gray scale values for the transparent film.
Keywords Radiography, digital . Images, display . Hard copy . Diagnostic systems
Introduction
Digital radiography has gained importance during the last decade and still continues [1]. Digital imaging reveals several advantages when compared to conventionally film based radiography such as lower radiation dose, the time economy, and the possibility of image processing after acquisition [2].
Though different systems for electronic data interchange exist, it is for logistical reasons sometimes necessary to obtain hard copies of the digital radiographies [3]. Printout by means of PC-interfaced desktop ink-jet printers would be a readily available and cost-efficient solution. However, there is a lack of knowledge about the reproduction quality provided by such printers. Only few studies investigating the quality of prints obtained from ink-jet printers are available [4–8]. Schulze et al. recently showed that glossy paper prints of calibrated customary printers reached a diagnostic accuracy comparable to the diagnostic capacity of calibrated monitors [3]. Since it is known that the density range of any transmission medium such as radiographic film exceeds that of a reflecting medium such as paper [10,
11], the question arises whether transparent paper for inkjet printouts reveals a higher quality as printouts on glossy paper. Though enhancement algorithms have been
devel-S. Kühl
:
D. Dagassan-Berndt:
T. J. LambrechtDepartment of Oral Surgery, Oral Radiology and Oral Medicine, School of Dental Medicine University of Basel,
Basel, Switzerland F. Krummenauer
Department of Medical Biometry, Epidemiology and Informatics, Johannes Gutenberg-University,
Mainz, Germany
S. Kühl
:
B. d’Hoedt:
R. K. W. SchulzeDepartment of Oral Surgery (and Oral Radiology),
University Medical Center of the Johannes Gutenberg-University, Mainz, Germany
S. Kühl (*)
Klinik für Zahnärztliche Chirurgie, -Radiologie, Mund- und Kieferheilkunde, Universität Basel, Hebelstrasse 3,
CH-4056 Basel, Switzerland e-mail: Sebastian.kuehl@unibas.ch
oped [12] and incorporated in software packages to circumnavigate this principle problem, their functionality has not been proved.
The golden standard for viewing digital radiographs is the computer monitor (M). Our study was designed to compare two print media against this golden standard: transparent film (T) and glossy paper (G). By using experimental radiographs showing small low-contrast details in various background shades of gray, a thorough receiver operating characteristics (ROC) analysis was carried out.
Materials and methods
Test object
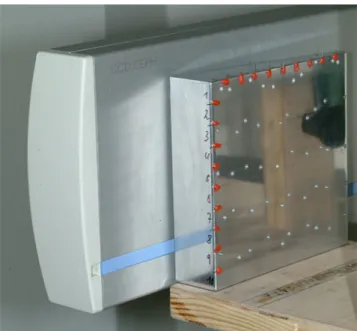
A grid pattern of 100 cells of identical size (10×10 mm2) was drawn on the front side of a stepless aluminum wedge (height, 100 mm; length, 100 mm; decreasing thickness from left to right, 25–5 mm) and classified in columns (A–J) and rows [1–10]. Each column was separated by the rows in 10 isometric fields of which in five fields a hole (2 mm diameter) was burred using CNC technology with a general accuracy of <0.01 mm. The depth of the (five) holes within one column varied between 1.0 and 3.0 mm at steps of 0.5 mm. Holes were burred into the cells of every uneven row (nos. 1, 3, 5, 7, and 9) in increasing depths. Consequently, all columns (A– J) contained an identical set of five holes of all depths, resulting in an equal proportion of hole/no hole containing cells (Fig.1). The full diameter of the holes (2 mm) had to be located inside the borders of each cell.
Image acquisition
A direct digital cephalometric unit (Orthophos DS Ceph, Sirona Dental Systems GmbH, Bensheim, Germany) equipped with a CCD sensor with an effective detector array of 138.6×5.9 mm2 was used for image acquisition, providing a spatial resolution of 282×282 dpi. The image is produced by vertically moving a horizontally collimated fan beam through the entire region of interest. The wedge phantom was positioned in such a way that its front side was aligned parallel to the receptor at a distance of 26 mm behind a 1.2-mm acrylic soft-tissue equivalent (Fig.1). Radiographs were produced over the entire exposure range and the image exhibiting maximum contrast as assessed from the extreme gray values at the thick and the thin end of the wedge (Photopaint 7.0, Corel Corporation, Ottawa, Ontario, Canada) was selected for evaluation. With this software, mean gray values were also measured for each vertical column of the grid, since each vertical column contains cells (images) of identical gray gradient.
Image processing
The original radiograph was exported as uncompressed 8-bit tiff file and subsequently separated into its single cells images by the image editing software specified above, resulting in 100 single images with a spatial resolution of 282 dpi2each. For monitor display, each single image was presented as uncompressed tiff file using a black back-ground. Printout on glossy paper (DMI Paper, 21.0× 29.7 cm, Eastman Kodak, Rochester, NY, USA) and on transparent film (DMI Film, 20.3 × 25.4 cm, Eastman Kodak, Rochester, NY, USA) were obtained from a PC-interfaced ink-jet printer (DMI Printer =1200 Distributed Medical Imager, Eastman Kodak, Rochester, NY, USA). White paper was used since none of these printers is able to sufficiently print gray scale on a black background. Prints were obtained at settings recommended for the different printing media (Table 1) in an effort to ensure the best possible result achievable from the DMI Printer in each modality. According to the manufacturer, the software (Medical Page, Eastman Kodak, Rochester, NY, USA) by
Fig. 1 The aluminum wedge positioned close to the sensor with burred holes on the frontside (without soft-tissue equivalent)
Table 1 Settings as recommended by the Kodak Manufacturer (Kodak DMI imaging) for the different printing media
Parameter Transparent film Glossy paper
Modus Color Gray
Resolution 1,200×1,200 dpi 1,200×1,200 dpi
Curve 5 30
Temperature Low High
default applies a gray scale spreading and a proprietary sharpening algorithm that is specific to the DMI Printer, ink, paper, and the image source. The printed image sizes were identical to that of the monitor display (1.0×1.1 cm).
Image evaluation
Images of all modalities were viewed separately in one room with dimmed light and a constant background illumination (26 lx, assessed with Luxmesser LM-1010, ELVOS GmbH, Ludwigsburg, Germany). Images were displayed in 1:1 mode on a 17-in. CRT monitor (XTA 3813 MT, Iiyama Electric Co. Ltd., Nagano, Japan; resolution, 1,024×768 pixels, true color). This type of monitor represented the standard at the time of study begin and was quality tested according to German regulations for dental radiographic viewing monitors both on a daily and monthly basis. The eye-to-screen distance was approxi-mately 60–80 cm. Contrast or size adjustment was not allowed. To resemble monitor conditions, the transparent T images were displayed on a vertically orientated radiographic viewing box (Kaiser prolite 5000, Kaiser Fototechnik GmbH & Co. KG, Buchen, Germany) at identical eye-to-screen distance. For this purpose, images were mounted each on a black cardboard covering the entire viewing box screen with a clearance exactly matching the image size. G images are nontransparent and consequently cannot be diagnosed by transillumination. Instead, they have to be viewed using incident light. To evaluate the print quality on such non-transparent images is the main reason for this investigation. Hence, G images were mounted on cardboard of identical size and viewed in an upright position with additional light directly illuminating the image (Halogen 20 Watt, 1,230 lx) from a distance of 60–80 cm.
Thirty observers recruited from the students of the Dental School in their final year were asked to rate each image separately using the following five-point confidence scale with respect to the visibility of a dark spot represent-ing a hole: 1=“hole definitely visible”, 2=“hole probably visible”, 3=“uncertain, whether or not a hole is visible”, 4=“hole probably not visible”, 5=“hole definitely not visible”. The order of images shown was randomized with respect to the modality. Prior to image evaluation, all observers were briefed on the procedure and calibrated by showing them one sample image of each modality. No time limits were set, and all image modalities were viewed subsequently in one session of an approximate duration of 30 min. The ratings were recorded by one of the authors (S. K.) and transferred into spreadsheet software (Microsoft Excel 2000, Microsoft Corporation, Redmond, USA) for further proceeding. Separated by a time interval of at least 30 days, the evaluation procedure was repeated in identical fashion except of a randomly resorted image sequence. The
entire evaluation procedure resulted in a total of 18,000 readings (100 images×3 modalities×30 observer×2 observations).
Statistical data evaluation
For each observer and display modality and observation, the respective ROC was calculated, with the threshold rating assigned to the negative proportion of observations. The area beneath each curve (Az) was estimated nonpara-metrically. Accordingly, sensitivity (SN) and specificity (SP) were obtained. Az values, SN, and SP were compared between the modalities in a pairwise fashion using the robust sign test for paired data; the resultingP values were adjusted according to the Bonferroni/Holm procedure. After averaging over all observers and both observations, SN and SP were also assessed for each background gray value, and positive (LR+) and negative (LR−) likelihood ratios were calculated. Confidence intervals of local SN and SP estimates were omitted.
The data were averaged over all observers and both observations. Cohen’s kappa (κ) coefficient for assessment of concordance between modalities was computed after dichotomization of the observations, with the threshold again assigned to the negative side. For each modality, intra-rater reliability was estimated via Cohen’s kappa (κ) between first and second observation based on the dichotomized readings for each observer, and the resulting pairwise coefficients were then averaged over the pairwise observer constellations for device agreement. In addition, observer and time bias were estimated using McNemar tests. Local significance was established forP<0.05.
To obtain exploratory information on their distribution among these series of comparisons, 25–75% percentiles (PC) of κ coefficients and P values (McNemar test) were computed based on the mean values as explained above. Graphical illustration of this distribution was based on nonparametric box whisker plots, accordingly.
All calculations were carried out with SPSS software (Release10.0.7) for Windows NT (SPSS Inc., Chicago, USA).
Results
SN averaged over all observers and both observations was 0.76 for glossy paper (LR+=7.85), 0.75 for the monitor display (LR+=9.01), and 0.68 for the transparent film (LR+= 6.72, Table 2). No statistically significant difference was observed between monitor and glossy paper (P=0.596), whereas a significant disagreement was found between monitor and transparent film (P<0.001) as well as glossy paper and transparent film (P<0.001). Average SP was 0.90 for glossy paper (LR−=0.26) and monitor display (LR−= 0.26) and 0.89 for the transparent film (LR−=0.35, Table2).
SN was decreasing with brighter background for all modalities, with printout on transparent film revealing the lowest value (0.08) at gray value 229 (Table 2). SP was distributed merely uniform over all background gray values involved in this investigation (Table2, Fig.2).
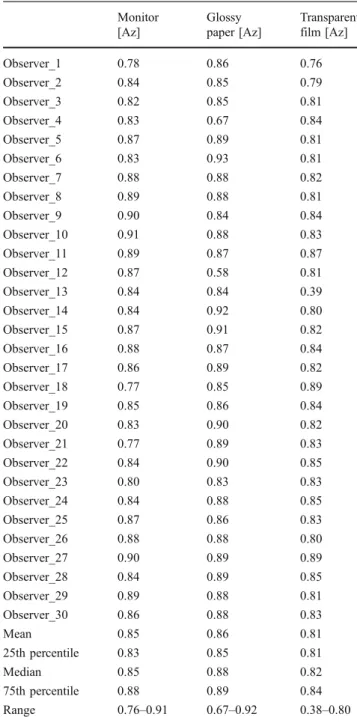
In summary, the ROC analysis resulted in high Az values for all modalities, with an average of 0.83 for glossy paper images and monitor display and an average of 0.79 for transparent film (Table 3). In concordance with the results presented earlier, the latter differed significantly
from both other modalities (Table 4). This is additionally illustrated by the differences of the 25–75% between prints on DMI Film and those of the other media (Fig. 2).
Concordance between monitor display and glossy paper prints was highest (mean κ, 0.71), followed by monitor display and transparent film (mean κ, 0.68) and prints on glossy paper and transparent film (mean κ, 0.65). No significant discordance was observed for these compar-isons. Intra-rater reliability, i.e., concordance between first and second observation was highest for prints on glossy paper (mean κ, 0.73), followed by monitor display (mean κ, 0.72) and printout on transparent film (mean κ, 0.68) (Table 5). Again, no significant discordance was observed.
Discussion
The current digitization of dental radiography demands for high-quality hard copy assessment for communicative purposes [2]. Ink-jet printers may represent a cost-efficient solution. Only scarce information is available on the suitability of ink-jet printers [4–6] for the reproduction of radiographic images. Especially the influence of different print media on the reproduction quality has not sufficiently been evaluated. A previous study using the identical printer in a clinical oriented task on the preoperative diagnosis on mandibular third molars has shown, that compared to monitor viewing, ink-jet printouts on glossy paper and transparent film may be as accurate as the original monitor-displayed images [13] The performance of the printer and the two print media (paper and transparent film) for diagnostic was evaluated in this study by using a design, based on the depiction ability of low contrast tasks, e.g., the presence of a bur hole or not. Contrary to the clinical approach in the latter study, we based our evaluation purely on experimental radiographs of a phantom showing small, regularly shaped low contrast features. The advantage of phantom-based
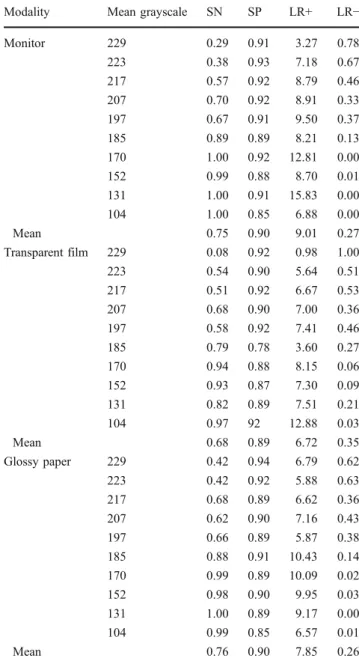
Fig. 2 Sensitivity (SN) and specificity (SP) for the different modalities (M monitor, T transparent film, and G glossy paper) Table 2 SN (sensitivity), SP (specificity), LR+ (positive likelihood
ratios), and LR− (negative likelihood ratios) averaged over all
observers, and both observations for each modality depended on the mean grayscale
Modality Mean grayscale SN SP LR+ LR−
Monitor 229 0.29 0.91 3.27 0.78 223 0.38 0.93 7.18 0.67 217 0.57 0.92 8.79 0.46 207 0.70 0.92 8.91 0.33 197 0.67 0.91 9.50 0.37 185 0.89 0.89 8.21 0.13 170 1.00 0.92 12.81 0.00 152 0.99 0.88 8.70 0.01 131 1.00 0.91 15.83 0.00 104 1.00 0.85 6.88 0.00 Mean 0.75 0.90 9.01 0.27 Transparent film 229 0.08 0.92 0.98 1.00 223 0.54 0.90 5.64 0.51 217 0.51 0.92 6.67 0.53 207 0.68 0.90 7.00 0.36 197 0.58 0.92 7.41 0.46 185 0.79 0.78 3.60 0.27 170 0.94 0.88 8.15 0.06 152 0.93 0.87 7.30 0.09 131 0.82 0.89 7.51 0.21 104 0.97 92 12.88 0.03 Mean 0.68 0.89 6.72 0.35 Glossy paper 229 0.42 0.94 6.79 0.62 223 0.42 0.92 5.88 0.63 217 0.68 0.89 6.62 0.36 207 0.62 0.90 7.16 0.43 197 0.66 0.89 5.87 0.38 185 0.88 0.91 10.43 0.14 170 0.99 0.89 10.09 0.02 152 0.98 0.90 9.95 0.03 131 1.00 0.89 9.17 0.00 104 0.99 0.85 6.57 0.01 Mean 0.76 0.90 7.85 0.26
SN was worse for the transparent film at high grayscale (229 and 223) when compared to the other modalities
studies is the possibility to clearly state the sensitivity and specificity of diagnostic systems as the results are as is and not depending on interpretations of the single viewer [8]. One fundamental problem in radiographic printing is the loss of detail simply because the reflection density range of print paper is smaller than the transmission density range of a negative film [10]. Despite this physical limitation, our study has shown that glossy paper prints had a higher diagnostic accuracy than printings on film. This stands in contrast to studies in which film-based viewing resulted in significantly higher mean areas under the curve rates for ROC evaluation [11]. The ROC analysis revealed high overall Az values, i.e., high SN and SP for the entire investigation. Obviously, the diagnostic task required in this study, i.e., perception of small round-shaped dark spots at varying locations within an image of decreasing background gray, is rather simple in nature. However, this study demonstrated significant differ-ences between the modalities, i.e., the discriminatory power of the study design seems to be sufficiently high [14–16]. The results indicate that, in general, perception of spots was best for prints on glossy paper, but without differing significantly from monitor display. Although still on an encouraging overall basis, the observers demonstrated an inferior performance in the evaluation of prints on the transparent film. Interestingly, the SN for the transparent film was grayscale dependent. The worse performance is merely based on the average worse detection of contrast differences within dark regions of low optical density. For brighter regions (i.e., higher optical density), however, the diagnostic capacity did not statistically differ between transparent film and the other two media.
Looking at the results in detail, it is obvious that the overall better performance of CRT monitor display and prints on glossy paper was due to higher SN, since SP did not reveal significant differences. The good performance of DMI paper may also be explained by the gray scale spreading algorithm. Apparently, the combination of famil-iar viewing conditions of paper prints together with the enhancement resulted in a high number of correctly detected spots, i.e., high SN. SP was distributed uniformly over all shades of background gray for all modalities, i.e., the likelihood of a false-positive reading was independent on background gray and display modality. Likelihood ratios
Table 3 Az values for all observers and modalities Monitor [Az] Glossy paper [Az] Transparent film [Az] Observer_1 0.78 0.86 0.76 Observer_2 0.84 0.85 0.79 Observer_3 0.82 0.85 0.81 Observer_4 0.83 0.67 0.84 Observer_5 0.87 0.89 0.81 Observer_6 0.83 0.93 0.81 Observer_7 0.88 0.88 0.82 Observer_8 0.89 0.88 0.81 Observer_9 0.90 0.84 0.84 Observer_10 0.91 0.88 0.83 Observer_11 0.89 0.87 0.87 Observer_12 0.87 0.58 0.81 Observer_13 0.84 0.84 0.39 Observer_14 0.84 0.92 0.80 Observer_15 0.87 0.91 0.82 Observer_16 0.88 0.87 0.84 Observer_17 0.86 0.89 0.82 Observer_18 0.77 0.85 0.89 Observer_19 0.85 0.86 0.84 Observer_20 0.83 0.90 0.82 Observer_21 0.77 0.89 0.83 Observer_22 0.84 0.90 0.85 Observer_23 0.80 0.83 0.83 Observer_24 0.84 0.88 0.85 Observer_25 0.87 0.86 0.83 Observer_26 0.88 0.88 0.80 Observer_27 0.90 0.89 0.89 Observer_28 0.84 0.89 0.85 Observer_29 0.89 0.88 0.81 Observer_30 0.86 0.88 0.83 Mean 0.85 0.86 0.81 25th percentile 0.83 0.85 0.81 Median 0.85 0.88 0.82 75th percentile 0.88 0.89 0.84 Range 0.76–0.91 0.67–0.92 0.38–0.80
Table 4 Wilcoxon test for pairwise comparison of the single modalities with *P<0.05 for sensitivity and specificity and *P<0.0167
corresponding to Bonferroni and Holm for Az parameters Sensitivity T–M Sensitivity G–T Sensitivity G–M Specificity T–M Specificity G–T Specificity G–M Az T–M Az G–T Az G–M P 0.000* 0.000* 0.314 0.976 0.438 0.605 0.001* 0.001* 0.084
were calculated to obtain more detailed information on differences between the display media. LR+ on average was highest for the gold standard monitor display, followed by prints on DMI paper and DMI film, and again most uniformly distributed over all shades of background gray for DMI paper (Table 2). Insignificant differences were calculated between monitor display and DMI paper prints concerning LR−, whereas prints on transparent film revealed remarkably higher average LR−. Both calculations confirm the findings already described, indicating a significantly inferior performance of the observers when evaluating prints on DMI film. Also supporting the outcome of the present study, concordance was best between monitor display and DMI paper prints, whereas it was consistently lower between prints on DMI film and both remaining media. Interestingly, no significant differ-ences were found between the three modalities with respect to intra-rater reproducibility.
In conclusion, our experimental data indicate that, given a task-specific enhancement algorithm, ink-jet prints on glossy paper provide hardcopies of digital radiographic images, which seem to compare favorably to the image displayed on a CRT monitor with respect to the perceptibility of small contrast features. This stands in accordance with other publications [3,4, 12]. Since our study design most likely overestimates SN and SP when compared to a clinical diagnostic task, we assume that differences found here will be greater in a clinical setup. However, the outcome of the study is highly dependent on specific parameters involved such as viewing conditions and printer settings. This principle shortcoming should also be considered, if studies comparing different display modalities with respect to clinically relevant radiological tasks are designed. If future studies confirmed the encouraging performance of ink-jet prints on glossy paper, the ink-jet technique could provide an affordable solution for the preparation of hardcopies of small- to medium-size digital radiographic images.
Conflict of interest The authors declare that they have no conflict of
interest.
References
1. Geissler O, Rother U (2007) The film-based printout using tetenal
printing solution II. Int J Comput Dent 10:285–291
2. Wenzel A (1999) Matters to consider when implementing direct
digital radiography in the dental office. Int J Comput Dent 2:269–
290
3. Schulze RKW, Schulze D, Voss K, Rottner M, Keller H-P, Dollmann K, Maager B, Wedel M (2008) Quality of individually calibrated customary printers for assessment of typical dental diagnoses on glossy paper prints: a multicenter pilot study. Oral Surg Oral Med Oral Pathol Oral Radiol Endod 106:578–586 4. Combs MJ, Snell J, Cail WS, Maier T, Buck DA (1995) The
gray-scale ink jet printer: value in making hard copies of digital images.
Am J Roentgenol 164:225–227
5. Kirkhorn T, Kehler M, Nilsson J, Lyttkens K, Andersson B, Holmer N-G (1994) Demonstration of digital radiographs by means of ink jet-printed paper copies: pilot study. J Digit Imaging
5:246–251
6. Lyttkens K, Kirkhorn T, Kehler M, Andersson B, Ebbesen A, Hochbergs P, Jarlman O, Lindberg C-G, Holmer N-G (1994) Evaluation of the image quality of ink jet-printed paper copies of digital chest radiographs as compared with film: a receiver
operating characteristic study. J Digit Imaging 7:61–68
7. Gijbels F, Sanderink G, Pauwels H, Jacobs R (2004) Subjective image quality of digital panoramic radiographs displayed on monitor and printed on various hardcopy media. Clin Oral Investig 8:25–29
8. Otis L, Sherman RG (2005) Assessing the accuracy of caries diagnosis via radiograph. Film versus print. J Am Dent Assoc 136:323–300
9. Goodman LR, Wilson CR, Foley WD (1988) Digital radiography of the chest: promises and problems. Am J Roentgenol 150:1241–1252 10. Weinstein LM, Fitzer MS, Fitzer PM (1975) Detail enhancement in prints of radiographs. use of a linear radial transmission filter.
Radiology 115:726–728
11. Bley TA, Kotter E, Saueressig U, Springer OS, Fisch D, Ghanem NA, Langer M (2003) Using receiver operating characteristic methodology to evaluate the diagnostic quality of radiography on
paper print versus film. AJR Am Roentgenol 181:1487–1490
12. Bednarek DR, Rudin S (1991) Blurred-mask density compression
for improved reproduction of radiographs. Invest Radiol 26:358–
363
13. Benediktsdottir I, Wenzel A (2004) Accuracy of digital panoramic images displayed on monitor, glossy paper, and film for assessment of mandibular third molars. Oral Surg Oral Med Oral Pathol Oral Radiol Endod 98:217–222
14. Agresti A (1989) An agreement model with kappa as parameter. Stat Probab Lett 7:271–273
15. Hubert L, Golledge RG (1983) Rater agreement for complex
assessments. Brit J Math Stat Psychol 36:207–216
16. Landis JR, Koch GG (1977) The measurement of observer
agreement for categorical data. Biometrics 33:159–174
Table 5 Intra-rater reliability with 25th to 75th percentile for the pairwise comparison between both sessions, based on the mean
ranking of the 30 observers per modality (100% correlation atκ=1)
Monitor Glossy paper Transparent film
Cohen’s kappa (κ) 0.72 0.73 0.68
25th percentile 0.60 0.58 0.65