DOI 10.1007/s11135-009-9248-5
The effects of interviewer, respondent and area
characteristics on cooperation in panel surveys:
a multilevel approach
Sigrid Haunberger
Published online: 9 May 2009
© Springer Science+Business Media B.V. 2009
Abstract Refusals and noncontacts generally make up the two most important compo-nents of unit nonresponse. It is important to separate noncontacts from refusals when exam-ining survey participation, a simultaneously analysis of both components seems relevant when assessing interviewer effects. Using data from a survey of the German Youth Insti-tute Munich, this paper presents an application of the hierarchical regression model, which offers a comprehensive way of analyzing the simultaneous effects of specific interviewer and respondent characteristics. The results provide evidence that the participation on panel surveys is subject to interviewer, respondent as well as area characteristics.
Keywords Interviewers· Nonresponse · Noncontact · Response rate · Cooperation rate · Survey participation· Hierarchical data · Panel attrition
1 Introduction: can you hear me knocking…?
Survey nonresponse—the failure to obtain participation of potential respondents in a survey—is indeed a serious threat to the quality of survey data. In their basically theoretical review of survey participation,Groves et al.(1992) point out the importance of the inter-viewer-respondent interaction. They argue that much depends on the interviewer’s ability to persuade the potential respondent. Interviewers might influence respondents’ willingness to participate in surveys through their personal performance patterns when contacting house-holds. However, there is the risk that the number of interviews could be affected by charac-teristics of interviewer (and of respondents as well). Much research has been conducted on how interviewers’ demographic and socioeconomic characteristics influence respondent’s participation and empirical evidence demonstrates that there is a significant variation in response rates between interviewers (Lyberg and Kasprzyk 1991;Lyberg and Lyberg 1991;
S. Haunberger (
B
)Department of Sociology of Education, Institute of Education, University of Berne, Muesmattstr. 27, 3012 Bern, Switzerland
Lyberg and Dean 1992). Though interviewers are not the only factor of the survey participation process that can affect respondent participation, they are the only ones who have direct contact with the respondents. They are expected to “maximize respondent participation”, “to control every situation”, or at least “be as effective as possible” (Lemay and Durand 2002, p. 30). However, much of what we assume about the impact of the interviewer on survey participation remains untested or inconclusive. Hence this paper seeks to examine the roles of interviewer, respondent and area characteristics on respondent cooperation (see alsoGroves et al. 1992). More specifically this paper focuses on refusals and noncontacts, which are the two most important components of unit nonresponse. Although it is important to separate noncontacts from refusals when analysing survey participation (Groves and Couper 1998), a simulta-neous consideration of both components seems relevant when assessing interviewer effects. In contrast to noncontact, refusal is an active act of the respondent and consequently a crucial aspect of respondent behaviour and cooperation respectively response rate.
In this paper noncontact and nonresponse will be analysed. Firstly, the noncontacts in the first wave of a panel survey will be analyzed, subsequently the nonresponse in the second and the third wave of a panel survey. The focus will be on interviewer, area and respondent effects on both refusal and noncontact rate.
2 Refusals: who, where and why…
Empirical evidence (Beerten 1999;Couper and Groves 1992;Singer et al. 1983) shows that some interviewer characteristics have an effect on individual response rates. Generally, three types of interviewer characteristics have been explored, either alone or in combination with respondent characteristics:
1. socio-demographic variables, 2. personality traits and social skills, and
3. interviewers’ opinions and attitudes (for interviewer experience and performance see
Groves and Couper 1998; for interviewer motivation see Morton-Williams 1993; De Leeuw 1999;Lemay and Durand 2002; and for interviewer attitudes seeSinger et al. 1983;De Leeuw et al. 1998). Although many results have been found, a clear and sys-tematic pattern has not yet emerged. In this section, briefly a number of empirical results about characteristics of interviewer, respondent and areas as well as their effects on unit response will be discussed.
First socio demographic attributes will be discussed. A number of studies have investi-gated the role of different interviewer characteristics on both individual response rates and the quality of interview data obtained. Although there has been much research on the influence of socio-demographic interviewer characteristics on the response rate, most of these findings remain inconclusive (Hox et al. 1991, p. 441). With regards to sociodemograpic charac-teristics, the only consistent findings relate to interviewer race. The age of the interviewer turns out to have some effect on the responses, but the findings are contradictory. AsGroves and Couper(1998) point out, these interviewer characteristics most probably interact with householder characteristics and survey topic effects. Additionally, the effects of these inter-viewer characteristics are suspected to be mediated by interinter-viewer experience, attitudes, and behaviour. For example, in their research (Singer et al. 1983, pp. 73–76), detected an effect of interviewer’s age and experience on the response rate: Younger interviewers with less experience generated lower response rates. By and large, it is agreed that some interviewers are more likely to be successful at obtaining cooperation than others.
The next passage turns to sample person characteristics: The findings relating to the sample person’s characteristics are somewhat more mixed. Several researchers (seeBrown and Bishop 1982;Hawkins 1975;Herzog and Rodgers 1988) have found age to be corre-lated with nonresponse. However, the impact of other sample person characteristics such as race, education, socio-economic status, gender, etc. are not very homogenous (seeGroves 1989andGoyder 1987for reviews of these factors). Although it is challenging to obtain informative data about those who refuse to participate, evidence exists that participation depends on more than situational factors randomly differing. Evidence from panel attrition and survey follow-up studies confirm the differences of non-responders and responders in terms of socio-demographic and economic variables (seeGroves 1989for a good review). Additionally, studies explore differences in terms of knowledge, values, attitudes and beliefs (seeCialdini et al. 1991;Mathiowetz 1992).
Turning to the characteristics of sample households, household size has been found to have a positive impact on response rates (seeGower 1979;Paul and Lawes 1982;Rauta 1985). Relatively high refusal rates are mostly seen with single person households (seeBrown and Bishop 1982;Wilcox 1977). This might be because of the large proportion of elderly per-sons living alone. On the other hand, families with dependent children tended to have higher response rates.
For the area characteristics can be stated: Several socio-environmental determinants for survey participation have been identified in the survey literature (Groves and Couper 1998). Most of the factors correlating with survey participation are urbanicity, population density, crime and social disorganisation. The difficulties of obtaining cooperation from potential respondents in inner-city areas are well known (seeSteeh 1981). Interviewing single house-holds’ except, rural people showed significantly more willingness to cooperate than urban dwellers. Also between different regions of a country a significant difference in the contact rate can be observed (DeMaio 1980, p. 229). Thereby two refusal reasons were mentioned more often – first the invasion of privacy associated with interviews and second unpleasant past experience as survey respondents (DeMaio 1980, p. 231).
To switch to the assignment area: In traditional research designs, different areas are assigned to one interviewer; for examining the effect of interviewers on survey participa-tion, it is imperative to take this into account. In a perfect research design, the interviewers would have been randomly assigned to sample areas, which would avoid any statistical con-founding, e.g. correlation, between interviewer and population characteristics (Hox 1994; for an example, seeCampanelli et al. 1997).
Finally, survey design factors (topic, burden, respondent selection rules, etc.) are likely to influence the decision of a sample person to participate, both directly and in connection with interviewer expectations and behaviour.
What is argued here is that there is a number of interaction effects between the all above mentioned factors influencing nonresponse. Consequently, it has to be examined if there are some areas (such as high density central city areas) in which interviewer effort are more impor-tant than in other areas. It is expected that high density urban areas may be more diverse, there-fore requiring greater effort to deal with a greater variety of different situations (Couper and Groves 1992, pp. 267–268). In the next section, I will come to a model of survey participation.
3 Toward a model of survey participation
Obviously interviewer attributes, area characteristics and survey design features are not the only factors to explain nonresponse; there are many other factors, all of which interact with
each other and determine the final outcome of the survey request. The successful use of coping strategies requires considerable knowledge about the causes of survey participation. First of all it is important to distinguish different response measures when talking about “response rate”: the contact rate and the cooperation rate. “The contact rate is calculated as the number of contacted addresses divided by the number of eligible addresses; the coop-eration rate is defined as the ratio of the number of completed interviews to the number of contacted addresses” (Beerten 1999, p. 7; see alsoGroves 1989, pp. 140–145). This differ-ence is crucial, since the aspects which affect whether a household is contacted or not are not necessarily the same as those which affect a household’s cooperation. The following two theoretical models examine various important components in explaining nonresponse.
In terms of the theoretical framework for contacting households, there are four main categories influencing whether interviewers are able to contact sample households: 1. Social environmental factors,
2. Socio-demographic factors, 3. Physical impediments and 4. Accessible at home patterns.
The accessible at home patterns interact with the number and timing of visits made by inter-viewers, which in turn are affected by interviewer characteristics (Beerten 1999, p. 7).
In terms of the theoretical framework for survey cooperation, there are four main influ-encing factors:
1. Social environmental factors, 2. Survey design factors,
3. Characteristics of the sample household or person and 4. Interviewer characteristics.
These factors have an impact on the interaction between interviewer and respondent, and therefore, the decision to cooperate or refuse to participate.
The model of survey response by Groves, Cialdini and Couper does incorporate all the above mentioned factors affecting the outcome of a request for survey participation (Groves and Cialdini 1991;Groves and Couper 1994). The model includes several variables: social context, political, economical, social, survey design, mode of administration as well as respondent and interviewer characteristics.
4 The study
For this analysis, data from the Child Longitudinal Study, conducted by the German Youth Institute are explored. More precisely, there are data from three panel waves as well as the contact form required to enrol for panel participation.
4.1 Design and sample 4.1.1 Design and sample
Based upon a prospective longitudinal survey with two national representative group samples in the following age groups: children in the last year of kindergarten (five-year-olds) and second-year primary school children. Nationwide 1.100 interviews were conducted with mothers, fathers and their children. These children and their parents were interviewed in
Table 1 (Non) response rate in the first wave for the respondents who were selected for an interview (n= 4.048)
Source: Child longitudinal study,
own calculation Result Percentage Completed interview 54.5 (=2.208) Refusal 30.2 Not contacted 10.9 Ineligible 1.0 Other noninterviews 3.1
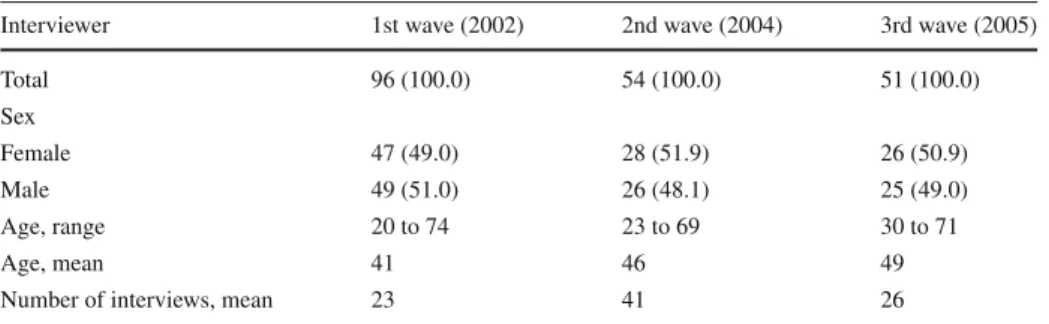
Table 2 Interviewers warrant of arrest, percents in parentheses
Interviewer 1st wave (2002) 2nd wave (2004) 3rd wave (2005)
Total 96 (100.0) 54 (100.0) 51 (100.0) Sex Female 47 (49.0) 28 (51.9) 26 (50.9) Male 49 (51.0) 26 (48.1) 25 (49.0) Age, range 20 to 74 23 to 69 30 to 71 Age, mean 41 46 49
Number of interviews, mean 23 41 26
Source: Child longitudinal study, own calculation
three survey stages at intervals of approximately one and a half years: The first stage was conducted in autumn 2002, the second stage in spring 2004, and finally the third stage in spring 2005. As the study was not conducted for methodological purpose, a major drawback of this study is that it was not possible to obtain measures of interviewer’s expectations and interviewer’s psychological characteristics.
Table1showing the nonresponse rate in the first wave for the respondents who were selected for an interview. I focus on the first two categories of Table1, the 2.208 respondents who either cooperated again or refused a second interview. Those 2.208 respondents were interviewed by 96 interviewers during the first wave (2002) and contacted by 54 interviewers during the second and 51 interviewers during the third wave (Table2).
4.1.2 Interviewer characteristics
During the first wave the interviews were conducted by 96 interviewers aged 20 to 74 years. Of those interviewers 47 were female (49%) and 49 male (51%). The interviewers average age was 41 years. On average, each interviewer conducted 23 interviews. During the second wave the interviewer characteristics did not differ much in comparison to the first wave. Inter-views were conducted by 54 interviewer aged 23 to 69 years, 28 female (52%) and 26 male (48%). The interviewers average age was 46 years. On average, each interviewer conducted 41 interviews. For the third wave, there were only 51 interviewers left, aged 30 to 71 years. The average age was about 49 years, and every interviewer conducted about 26 interviews. 4.1.3 Interviewer assignment
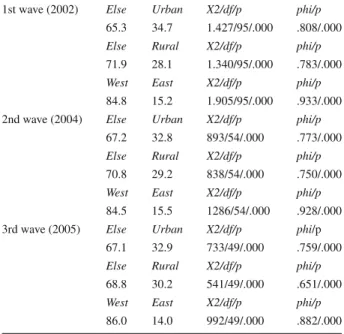
Because this study was not conducted for methodological purposes, the interviewers were not randomly assigned to interviewees. There were assigned by area characteristics according to custom in survey research. Table3present the distribution of the interviewers according to
Table 3 Assignment of interviewers according to area, in percentage
Source: Child longitudinal study,
own calculation
1st wave (2002) Else Urban X2/df/p phi/p
65.3 34.7 1.427/95/.000 .808/.000
Else Rural X2/df/p phi/p
71.9 28.1 1.340/95/.000 .783/.000
West East X2/df/p phi/p
84.8 15.2 1.905/95/.000 .933/.000 2nd wave (2004) Else Urban X2/df/p phi/p
67.2 32.8 893/54/.000 .773/.000
Else Rural X2/df/p phi/p
70.8 29.2 838/54/.000 .750/.000
West East X2/df/p phi/p
84.5 15.5 1286/54/.000 .928/.000 3rd wave (2005) Else Urban X2/df/p phi/p
67.1 32.9 733/49/.000 .759/.000
Else Rural X2/df/p phi/p
68.8 30.2 541/49/.000 .651/.000
West East X2/df/p phi/p
86.0 14.0 992/49/.000 .882/.000
the area. The table shows a strong correlation between interviewer and area characteristics, especially between west-east than between urban-rural regions. The non-random assignment was however taken into consideration in the multivariate analyses, where the interviewer and area characteristics are simultaneously controlled for.
4.1.4 Variables and survey instruments
Both participants were surveyed at each stage. Mothers were verbally interviewed while fathers had to fill in a written questionnaire. The children in the older group were included in the survey from the outset; the younger children were surveyed in the third stage using standardised instruments suitable for their respective age groups. The following issues were addressed in the questionnaires: objectives of upbringing, the child’s behaviour in conflict situation, problems and problematic events within the family, the child’s friendship network, the child’s interests and activities, care for the child in kindergarten and school, as well as an assessment of the respective institution. Parents were also questioned about socio-demogra-phy and some statistics.
4.1.5 Response rate
During the first wave together n=2,208 interviews with mothers (including younger and elder cohort) have been conducted. As a proxy of the respondents’ survey interest the response cooperativeness can be taken, which is in the case of the first wave respectable 84%. During the second wave n=1,493 interviews have been conducted, that is about 84% of the gross sample again. The response cooperativeness during the third wave finally was about 83% (n=1,286 interviews with mothers).
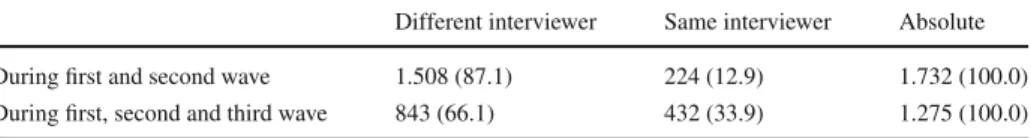
Table 4 Interviewers during three panel waves, percents in parentheses
Different interviewer Same interviewer Absolute During first and second wave 1.508 (87.1) 224 (12.9) 1.732 (100.0) During first, second and third wave 843 (66.1) 432 (33.9) 1.275 (100.0)
Source: Child longitudinal study, own calculation
4.1.6 Same versus different interviewer
It is of interest if the mothers were interviewed by the same or different interviewers over three panel waves. Results are presented in Table4. During the second wave, a total 1,758 interviews (87%) were conducted by different and about 13% by the interviewer of the first wave. Overall, about 66% (out of 1,275 interviews) were conducted by different and about 33% by the same interviewer (there exist the disregarded possibility, that the first and third wave interviewer was the same).
4.1.7 Frequency of contact
More than half of the interviewers were conducted by the second interviewer contact, a further fifth by third interviewer contact and still over 10% by fourth interviewer contact. The com-paratively low panel cooperativeness after the first interviewer contact can be explained by the particular survey design: interviewer should interview both, mothers and child, and possibly collect the father’s questionnaire as well.
4.2 Variables in the analyses
The dependent variable is whether the selected and encountered respondent refuses to cooperate: refuse (0=no, 1=yes), both for contact rate and cooperation rate. On the respon-dent level, there are ten indepenrespon-dent variables: age (metrical), sex (0=female, 1=male), education (0=lower education, 1=higher education), household size (metrical), nationality (0=German, 1=non-German), cohort (0=younger, 1=elder), language problems (0=no, 1=yes), socio-economic status low, socio-economic status high and interviewer. The dummy variable for “interviewer” indicates whether a respondent is interviewed twice by the same interviewer (0=different, 1=same). On the interviewer level, they are five independent vari-ables: sex (0=female, 1=male), age (metrical), education (0 =lower education, 1=higher education), number of interviews (metrical), frequency of contact (metrical). The area char-acteristics presented here are: municipality (0=under 20.000 inhabitants, 1=over 20.000 inhabitants), differentiation on west-east Germany (0=west, 1=east) and at last urban and rural areas. For survey design reasons, the following analyses are only based upon the mother’s interviews.
5 Statistical model and analysis procedure 5.1 Methodological approach
Some existing studies concerning interviewer effects have been criticized by authors (see
used. Typical models to analyse such effects do not consider hierarchical structures, because respondents are nested within interviewers (Dijkstra 1983;Hagenaars and Heinen 1982;
Groves and Fultz 1985).
The appropriateness of the hierarchical design depends to a great extent on the procedure of how the respondents are assigned to the interviewers. To avoid the effect of excessive trav-elling times, for example, respondents might be randomly assigned to interviewers within specific geographic areas. In turn, respondents in urban areas would be mostly interviewed by urban interviewers, and respondents in rural areas mostly by rural interviewers. Such non-random assignment leads to the confusion of respondent and interviewer characteristics, since both variables become correlated (Hox 1994). Given that there are considerably more respondents than interviewers, this generates an obvious analysis problem (for discussion, seeHox et al. 1991;Bryk and Raudenbush 1992). In such cases, multilevel analysis offers, the best prospects to inspect interviewer effects on survey data. It seems that the hierarchical model is the best tool to tackle the respondents nested within interviewers design, because respondents are nested within interviewers (Hox 1994, p. 304). As our dependent variable is dichotomous (refusal: no/yes), we use a logistic hierarchical model.
5.2 Conceptual and statistical background for two-level models
As the name implies, a two-level model consists of two submodels at level 1 and level 2. The key feature of this model is that the independent variables can be defined on different levels of the data structure. In this particular study, there are two levels: the lowest level, the level-1 model, represents the relationships among the respondent-level variables and the highest level, the level-2 model, measures the influence of interviewer-level factors. The lowest level has the most observations and is nested within the higher level (Hox et al. 1991). Formally, there are i=1,…, n level-1 units (e.g., respondents) nested within j=1,…, J level-2 units (e.g., interviewer, areas).
The standard hierarchical linear model is appropriate for two-level data where the random effects at each level are normally distributed. The assumption of normal distribution at level-1 is approximately correct when the outcome variable is continuous. However, there are impor-tant cases where the assumption of normal distribution at level-1 is not realistic. Examples of a binary outcome, Y, are: Y=1 if the respondent refuses, Y=0 if the respondent cooperates. The use of a standard level-1 model in this case would be inapplicable (for discussion, see Bryk and Raudenbush, 2004). Within the statistical package of HLM it is possible to specify a non-linear analysis appropriate for binary outcomes. While the basic principle of standard HLM is a normal sampling model and identity link function, the binary outcome model uses a binominal sampling model and a logit link (see Bryk and Raudenbush 2004, pp. 96–97). This allows to examine a hierarchical model for the respondents refusal versus the respondents cooperativeness.
5.3 Results of the analyses
I start with two different two-level analyses. In the first analysis, we use the interviewer of 2002 and 2004 as the level 2 identifier; in the second, we use the interviewer of 2002. The results of these analyses are reported in Table5(for noncontacts) and Table6(for refusals).1
1In hierarchical linear models the intercept is always assumed to be random. For these models, all lower
level regression coefficients were designated as fixed instead of random, because statistical tests shows that the between interviewer variance of a specific regression coefficient was not significant. For that reason,
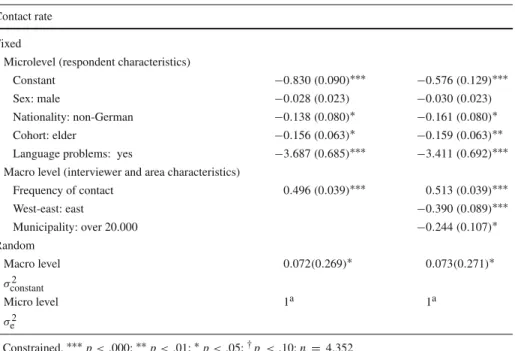
Table 5 Two-level analyses with the interviewer of 2002 (Standard errors in parentheses) Contact rate
Fixed
Microlevel (respondent characteristics)
Constant −0.830 (0.090)∗∗∗ −0.576 (0.129)∗∗∗
Sex: male −0.028 (0.023) −0.030 (0.023)
Nationality: non-German −0.138 (0.080)∗ −0.161 (0.080)∗
Cohort: elder −0.156 (0.063)∗ −0.159 (0.063)∗∗
Language problems: yes −3.687 (0.685)∗∗∗ −3.411 (0.692)∗∗∗ Macro level (interviewer and area characteristics)
Frequency of contact 0.496 (0.039)∗∗∗ 0.513 (0.039)∗∗∗ West-east: east −0.390 (0.089)∗∗∗ Municipality: over 20.000 −0.244 (0.107)∗ Random Macro level 0.072(0.269)∗ 0.073(0.271)∗ σ2 constant Micro level 1a 1a σ2 e aConstrained.∗∗∗p< .000;∗∗p< .01;∗p< .05;†p< .10; n = 4.352
The analysis in Table5shows that noncontact is related to some sociodemographic respon-dent characteristics. At the responrespon-dent level, we included sex, nationality, cohort and language problems. Excluding sex, all of the parameters associated with these variables are signifi-cant. The probability to cooperate will be higher for German respondents, respondents of the younger cohort (with children in the age of 5–6) and for respondents without language problems.
In addition it was found that there are significant interviewer and area effects. Also the interviewers who have to obtain cooperation from the respondents have an effect on their likelihood to refuse. Increasing the frequency of contact will raise the willingness of coop-eration, too. Two area characteristics west-east and the municipality were also included. For this, the probability to cooperate was found to be higher in western part of Germany and in smaller municipalities too. It also seems to be the case that it is the area, rather than the interviewer, which is the important effect.
Table6shows that only the respondent’s age and socio-economic status affect his or her likelihood to refuse the second interview. This probability will be higher for younger respon-dents and those with a lower socio-economic status than for their counterparts.
As can be seen, the interviewer characteristics had only very limited impact on refusals, especially in wave 3. There are only three significant explanatory variables for the interviewer level: education of interviewers, the number of interviews conducted by interviewers and if the interviews were conducted by the same interviewer. The probability to refuse the second Footnote 1 continued
it was supposed that the effect of that respondent variable on the dependent variable is identical for all inter-viewers. Consequently, further statistical tests resulted in no interaction effects between specific respondent and interviewer variables. The models allowed taking only notice of the random intercept, which reflects the between-interviewer variance (Hox et al. 1991, p. 445).
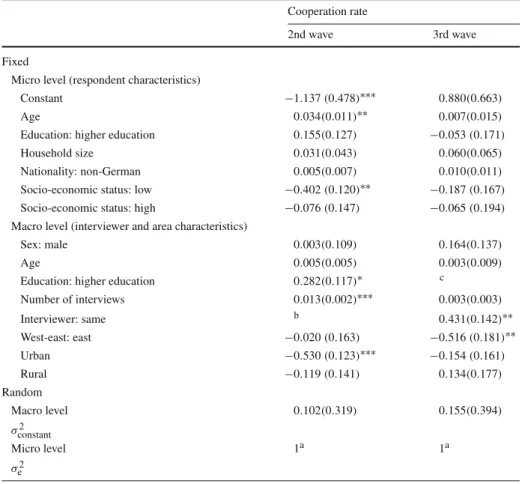
Table 6 Two-level analyses with the interviewer of 2002 and the interviewer of 2004 as level 2 identifiers (Standard errors in parentheses)
Cooperation rate
2nd wave 3rd wave
Fixed
Micro level (respondent characteristics)
Constant −1.137 (0.478)∗∗∗ 0.880(0.663)
Age 0.034(0.011)∗∗ 0.007(0.015)
Education: higher education 0.155(0.127) −0.053 (0.171)
Household size 0.031(0.043) 0.060(0.065)
Nationality: non-German 0.005(0.007) 0.010(0.011)
Socio-economic status: low −0.402 (0.120)∗∗ −0.187 (0.167) Socio-economic status: high −0.076 (0.147) −0.065 (0.194) Macro level (interviewer and area characteristics)
Sex: male 0.003(0.109) 0.164(0.137)
Age 0.005(0.005) 0.003(0.009)
Education: higher education 0.282(0.117)∗ c
Number of interviews 0.013(0.002)∗∗∗ 0.003(0.003) Interviewer: same b 0.431(0.142)∗∗ West-east: east −0.020 (0.163) −0.516 (0.181)∗∗ Urban −0.530 (0.123)∗∗∗ −0.154 (0.161) Rural −0.119 (0.141) 0.134(0.177) Random Macro level 0.102(0.319) 0.155(0.394) σ2 constant Micro level 1a 1a σ2 e
aConstrained;bif included the robust standard errors cannot be computed for this model;cif included there
were to less cases left for analysis.∗∗∗p<.000;∗∗p<.01;∗p<.05; n = 1.989 (2nd wave) 1.482 (3rd wave)
interview will be higher for interviewers with a lower educational level and a smaller number of interviews than for their counterparts. For the third interview, the likelihood to cooperate will be higher for respondents who are interviewed again by the same interviewer.
Results for the area level show the influence of regional characteristics on the panel coop-erativeness. The probability to refuse the second interview will be higher for respondents living in urban areas than for respondents living in other areas. The likelihood to refuse the third interview will be higher for respondents living in the eastern part of Germany.
6 Conclusion and discussion
The main aim of this paper has been to measure how respondent, interviewer and area charac-teristics influence cooperation and response rates in a panel survey. The findings suggest that the chances for both noncontacts and refusals are subject to respondent, as well interviewer and area characteristics. The results presented above confirm previous research findings
(Rendtel 1990; Pickery and Loosveldt 2001). However, one has to keep in mind that other unmeasured characteristics of interviewers (e.g. experience, appearance, voice etc.) may also play a role in the respondent’s decision.
It was also found that there was no effect of the interviewer’s sex and age; they might be largely mediated by interviewer experience, attitudes and behaviour. However highly educated interviewers obtained better cooperation than others. Interviewer cooperation rate also increased with the number of interviews. This variable can be seen as a measure of the interviewer’s experience on the project. There are two ways to explain this finding: either interviewer experience improves as experience with the questionnaire increases, or inter-viewers who perform better simply work more hours (Lemay and Durand 2002, p. 35).
Regarding participation in the third wave of the panel survey, having the same interviewer in the first waves has turned out to be more important than different interviewers. This may be due to the fact that a new interviewer again had to convince the respondent to cooper-ate. Keeping a high interviewer consistency over subsequent panel waves is therefore very conducive to the quality of these studies.
Contrary to the current findings, household size has not been found to correlate posi-tively with response rate (seeGower 1979;Paul and Lawes 1982;Rauta 1985). A possible explanation is that single person households tend to have relatively high refusal rates. In this study exclusively families are examined, which may have led to an insignificant relationship between household size and response rate. Turning to the contact rate of cohorts, it was found that the younger cohort (family with children in the age of 5–6) have higher response rates. Significant differences were also observed for inner-city areas versus rural areas: rural people were significantly more likely to cooperate than were urban dwellers.
Moreover, the analyses highlights some differences in gaining contact with migrants (e.g. potential respondents with a non-German nationality) and there participation when starting a survey. The results suggest a significant lower likelihood for migrants to cooperate. This is due to language problems, as it was already pointed out.
Migrant dropouts might become even more problematic in case they live in areas which also have low cooperation rates. Additionally the interviewers who should obtain cooperation from the respondents have an effect on the subjects’ probability to refuse. However, increasing the frequency of contact is likely to raise the willingness of respondents to cooperate.
What are the implications of these results for further empirical research? In coping with the challenges of the issue of nonresponse in survey data collection, two strategies can be adopted. First, participation can be increased through improved fieldwork methods. In order to achieve high response rates, it is highly recommended that interviewees are questioned by the same interviewers for all panel waves (see also Rendtel 1990; Pickery and Loos-veldt 2001). Though it is a challenging task to ensure interviewer consistency, the efforts are likely to pay off in the long run for both scholarly and commercial survey research, as the willingness of cooperation is considerably higher.
Another issue worthy of future research investigation is how interviewer training can be improved and extended. To date, the training consists mainly of learning how to achieve high response rates (seeMorton-Williams 1993). The results of this study suggest that it is equally important to train interviewers in different doorstep techniques. Such lessons could include special language skills and building in a translated introductory message, which might also significantly increase migrants willingness to participate. Because migrants have a signifi-cant lower probability to participate in a survey, it is imperative for researchers to improve the first contact with these potential (non-)respondents.
Finally, future research might focus more on theories of action; one successful model to predict behaviour is the theory of reasoned action (Ajzen and Fishbein 1980). In that theory
volitional behaviour is predicted by three factors: behavioural intention, attitudes toward the behaviour and subjective norms; for example the decision whether to respond to a survey request or not. It would not only highlight important effects, but also explain the “social mechanism” (Hedström and Swedberg 1998) behind the behaviour to participate or not to participate in a survey in more detail.
Acknowledgement The author thank Emma Uprichard and Alexandra Zaugg for helpful comments on an earlier draft of this paper.
References
Ajzen, I., Fishbein, M.: Understanding Attitudes and Predicting Social Behavior. Englewood Cliffs, NJ, Prentice-Hall (1980)
Beerten, R.: The effect of interviewer and area characteristics on survey response rates: an exploratory analy-sis. Surv. Methodol. Bull. 45, 7–15 (1999)
Brown, P.R., Bishop, G.F.: Who refuses and resists in telephone surveys? Some new evidence. In: MAPOR Annual conference (1982)
Bryk, A.S., Raudenbush, S.W.: Hierarchical Linear Models: Applications and Data Analysis Methods. Newbury Park, Sage Publications (1992)
Bryk, A.S., Raudenbush, S.W., Cheong, Y.F., Congdon, R.: HLM 6. Hierarchical Linear & Nonlinear Model-ling. Scientific Software International Inc., Lincolnwood (2004)
Campanelli, P., Sturgis, P., Purdon, S.: Can You Hear Me Knocking: An Investigation into the Impact of Interviewers on Survey Response Rate, London (1997)
Cialdini, R., Braver, S., Wolf, S.: A new paradigm for experiments on the causes of survey nonresponse. In: First International Conference on Household Survey Nonresponse U.S. Bureau of the Census, Washington, DC (1991)
Collins, M.: Interviewer variability: a review of the problem. J. Mark. Res. Soc. 22, 77–95 (1980)
Couper, M.P., Groves, R.M.: The role of the interviewer in survey participation. Surv. Methodol. Bull. 18(2), 263–277 (1992)
De Leeuw, E.D.: How do successful and less successful interviewers differ in tactics for combating survey nonresponse. Bull. Méthodol. Sociol. 62, 29–42 (1999)
De Leeuw, E.D., Hox, J.J., Snijkers, G., De Heer, W.: Interviewer opinions, attitudes and strategies regarding survey participation and their effect on nonresponse. ZUMA-Nachrichten Spezial 4, 239–248 (1998) DeMaio, T.J.: Refusals: who, where and why. Public Opin. Quart. 44(2), 223–233 (1980)
Dijkstra, W.: How interviewer variance can bias the results of research on interviewer effects. Qual. Quant. 17(3), 179–187 (1983)
Gower, A.R.: Non-response in the Canadian labour force survey. Surv. Methodol. 5(1), 29–58 (1979) Goyder, J.: The Silent Minority. Nonresponse on Sample Surveys Polity Press, Oxford (1987) Groves, R.M.: Survey Error and Survey Costs. Wiley, New York (1989)
Groves, R.M., Cialdini, R.B.: Toward a useful theory of survey participation. In: Proceedings of the Section of Survey Research Methods. American Statistical Association (1991)
Groves, R.M., Couper, M.: Householders and interviewers: the anatomy of pre-interview interactions. In: Survey Methodology Program Working Paper Series No. 11 (1994)
Groves, R., Couper, M.: Nonresponse in Household Interview Surveys. Wiley Interscience, New York (1998) Groves, R.M., Fultz, N.H.: Gender effects among telephone interviews in a survey of economic attitudes.
Sociol. Method. Res. 14, 31–52 (1985)
Groves, R.M., Matthiowetz, N.A.: Computer assisted telephone interviewing: effects on interviewer and respondents. Public Opin. Quart. 48, 356–369 (1984)
Groves, R.M., Cialdini, R.N., Couper, M.P.: Understanding the decision to participate in a survey. Public Opin. Quart. 56, 475–495 (1992)
Hagenaars, J.A., Heinen, T.G.: Effects of role-independent interviewer characteristics on responses. In: Dijkstra, W., Zouwen, J.v.d. (eds.) Response Behaviour in the Survey-Interview, pp. 91–130. London (1982)
Hawkins, D.F.: Estimation of nonresponse bias. Sociol. Method. Res. 3, 461–488 (1975)
Hedström, P., Swedberg, R.: Social mechanisms: an analytical approach to social theory. Cambridge University Press, Cambridge (1998)
Herzog, A.R., Rodgers, W.L.: Interviewing older adults: mode comparison using data from a face-to-face survey and a telephone survey. Public Opin. Quart. 52, 84–99 (1988)
Hox, J.J.: Hierarchical regression models for interviewer and respondent effects. Sociol. Method. Res. 22(3), 300–318 (1994)
Hox, J.J., Leeuw, E.d., Kreft, I.G.G.: The effect of interviewer and respondent characteristics on the quality of survey data. A multilevel model. In: Biemer, P.P., Groves, R.M., Lyberg, L.E., Matthiowetz, N.A., Sudman, S. (eds.) Measurement Errors in Surveys, pp. 439–461. John Wiley, New York (1991) Lemay, M., Durand, C.: The effect of interviewer attitude on survey cooperation. Bull. Méthodol.
Sociol. 76, 27–44 (2002)
Lyberg, I., Dean, P.: Methods for reducing nonresponse rates: a review. In: Annual Meeting of the American Association for Public Opinion Research. St. Petersburg, FL, USA (1992)
Lyberg, L., Kasprzyk, D.: Data collection methods and measurement error: an overview. In: Biemer, P.P., Groves, R.M., Lyberg, L.E., Matthiowetz, N.A., Sudman, S (eds.), pp. 237–257. John Wiley, New York (1991)
Lyberg, I., Lyberg, L.: Nonresponse research at statistic Sweden. In: Annual Meeting of the American Statis-tical Association Atlanta, GA, USA (1991)
Mathiowetz, N.A.: Errors in reports of occupations. Public Opin. Quart. 56, 352–355 (1992) Morton-Williams, J.: Interviewer Approaches. Cambridge (1993)
Mowen, J.C., Cialdini, R.B.: On implementing the door-in-the-face compliance technique in a business con-text. J. Mark. Res. 17, 253–258 (1980)
Paul, E.C., Lawes, M.: Characteristics of respondent and nonrespondent households in the Canadian labour force survey. Surv. Methodol. 8, 48–85 (1982)
Pickery, J., Loosveldt, G.: The impact of respondent and interviewer characteristics on the number of “no opinion” answers. Qual. Quant. 32, 31–45 (1998)
Pickery, J., Loosveldt, G.: A multilevel multinomial analysis of interviewer effects on various components of unit nonresponse. Qual. Quant. 36, 427–437 (2002)
Pickery, J., Loosveldt, G., Carton, A.: The effects of interviewer and respondent characteristics on response behavior in panel surveys. Sociol. Method. Res. 29(4), 509–523 (2001)
Rauta, I.: A comparison of the census characteristics of respondents and non-respondents to the 1981 general household survey, statistics. News 71, 12–15 (1985)
Rendtel, U.: Teilnahmebereitschaft in panelstudien: zwischen beeinflussung, vertrauen und sozialer selektion. Kölner Zeitschrift für Soziologie und Sozialpsychologie 42, 280–299 (1990)
Singer, E., Frankel, M.R., Glassman, M.B.: The effect of interviewer characteristics and expectations on response. Public Opin. Quart. 47(1), 68–83 (1983)
Steeh, C.G.: Trends in nonresponse rates, 1952–1979. Public Opin. Quart. 45, 40–57 (1981)
Wilcox, J.B.: The interaction of refusal and not-at-home sources of nonresponse bias. J. Mark. Res. 14, 592– 597 (1977)
Zouwen, J.v.d., Dijkstra, W., Smit, J.H.: Studying respondent— interviewer interaction: the relationship between interviewing style, interviewer behavior and response behavior. In: Biemer, P.P., Groves, R.M., Lyberg, L.E., Matthiowetz, N.A., Sudman, S. (eds.), pp. 419–437. John Wiley, New York (1991)