ORIGINAL PAPER
Relating remotely sensed forest damage data to wind data:
storms Lothar (1999) and Vivian (1990) in Switzerland
Tilo Usbeck&Peter Waldner&Matthias Dobbertin&Christian Ginzler&
Christian Hoffmann&Flurin Sutter&Charlotte Steinmeier&Richard Volz&
Gustav Schneiter&Martine Rebetez
Received: 1 April 2011 / Accepted: 19 September 2011 / Published online: 26 October 2011 # Springer-Verlag 2011
Abstract This study compares the surface wind speed and forest damage data of two exceptionally severe winter storms, Vivian 1990 and Lothar 1999. The study area comprises the region that suffered damage in Switzerland. The wind speed data were derived from simulations of MeteoSwiss (Federal Office of Meteorology and Climatology), measurements during the storm periods and expert analyses of the data. The remotely sensed forest damage data were provided by the Federal Office for the Environment and the forest cover data by Swiss Federal Statistical Office. We compared data on the peak gust and maximum average wind speed, with data on the spatially related forest area and forest damage area, and found some clear differences in the correlations between the different wind data and forest damage. Our results point generally to the damage-causing role of near-surface gusts at maximum wind speeds during the storm. These tended to be spatially distributed on a fine scale. In only a few cases were the results statistically
significant. However, these results could probably be improved with better wind data. For example, gust measurements spatially closer to forests or simulations of gusts at maximum wind speed could be produced with a spatially higher resolution.
1 Introduction
Storms are the disturbance factor that causes by far the most severe damage to forests in Switzerland (Schelhaas et al.
2002) and in Europe (Schelhaas et al.2003). Severe winter
storms are rare events, e.g. Lamb (1991), and tend to be
triggered by different meteorological situations, but they have nevertheless caused most storm damage in Swiss
forests. Rockel and Woth (2007) analysed the uncertainty of
the effect of enhanced greenhouse gas conditions on the windiness projected by an ensemble of regional model
T. Usbeck
:
M. Dobbertin:
C. Hoffmann:
F. Sutter:
G. Schneiter:
M. RebetezResearch Unit Forest Dynamics, Swiss Federal Institute for Forest, Snow and Landscape Research WSL,
Zürcherstrasse 111,
CH-8903 Birmensdorf, Switzerland T. Usbeck (*)
:
M. RebetezInstitut de Géographie, Faculté des Lettres et Sciences Humaines, Université de Neuchâtel,
Espace Louis-Agassiz 1, CH-2000 Neuchâtel, Switzerland e-mail: [email protected] P. Waldner
Research Unit Forest Soils and Biogeochemistry, Swiss Federal Institute for Forest, Snow and Landscape Research WSL, Zürcherstrasse 111,
CH-8903 Birmensdorf, Switzerland
C. Ginzler
:
C. SteinmeierResearch Unit Landscape Dynamics, Swiss Federal Institute for Forest, Snow and Landscape Research WSL,
Zürcherstrasse 111,
CH-8903 Birmensdorf, Switzerland
R. Volz
Forest Products and Services and Forest Quality Section, Forest Division, Federal Office for the Environment (FOEN), CH-3003 Bern, Switzerland
M. Rebetez
Research Unit Forest Dynamics, Swiss Federal Institute for Forest, Snow and Landscape Research WSL,
Case postale 96,
CH-1015 Lausanne 15, Switzerland DOI 10.1007/s00704-011-0526-5
simulations and estimated an increase of up to 20% in the
number of peak gusts≥8 Bft over Central Europe for 2071–
2100. Leckebusch et al. (2008) predicted an increased
frequency of Central European storm clusters with an enhancement of the pressure gradient over Central Europe
under “green-house” global warming conditions. Nilsson
et al. (2007) related forest damage to the wind field in a
high-resolution regional climate model simulation in the relatively gentle topography of Scania in southern Sweden, and found most damage occurred in areas affected by
maximum wind speeds greater than 30 m s−1. Blennow and
Olofsson (2008) estimated the changing probability of
exceeding the critical wind speed for significant wind damage in southern Sweden and found an increasing probability of damaging wind in many places.
However, wind as a meteorological element is very
difficult to monitor (Hann 1869; Maurer et al. 1909;
Schüepp 1950; Schiesser et al. 1997; Trenberth et al.
2007). Only a few studies on forest storm damage have
included wind speed data in their analyses of regional differences in damage. As observed, wind data is largely lacking, most Swiss studies base wind regimes on general assumptions such as spatially homogeneous random distribution and try to relate spatial damage patterns to a broad variety of forest and site conditions. For example,
Hollenstein (2002) was able to correlate multivariately forest
inventory data and storm damage data but failed to improve the results of earlier investigations, possibly because, as he suggests, not all the relevant variables had been considered.
Gardiner et al. (2008) reviewed mechanical models of wind
damage risk and found the most widely adopted models were designed to calculate the risk at the stand level within uniform forests. Predicting the critical wind speed is said to become increasingly difficult the hillier or at least the more complex the terrain.
König (1995) proved that stand height influenced storm
damage most and found a good correlation between simulated wind speed data from the numeric simulation
model FITNAH (Gross 1991) and observed wind speed
data as well as between severe storm damage and the
simulated highest wind speeds. Schütz et al. (2006) used
data from 332 randomly chosen pure and regular stands of spruce and beech in the Swiss Midlands and Doppler radar-measured wind speed. He found that the susceptibility for spruce was three times higher than for beech during the winter storm Lothar, with aspect being a significant factor
but wind speed not. Hanewinkel et al. (2008) investigated a
77-year time series (1925–2001) of natural disturbances in southwestern Germany using logistic regressions combined with autoregressive techniques and found storm damage more likely in previously damaged stands. Schindler et al.
(2009) used wind data from a mesoscale airflow model for
southwestern Germany for the 1999 winter storm Lothar
and found the highest wind damage probability “for
coniferous forest growing on acidic, fresh to moist soils
on bunter sandstone formations—provided that ‘Lothar’
maximum gust wind speed exceeded 35 m s−1in the areas
in question”. Schmidt et al. (2010) modelled single tree
storm damage using inventories from the 1999 winter storm Lothar in southwestern Germany, solving the problem of missing observed wind data by applying a generalised additive model, and found tree height to be a prominent factor influencing the level of damage.
A number of forest site and stand conditions are often mentioned as important influences on wind damage (Kuhn
1995; Quine and Bell 1998; Ray and Nicoll 1998;
Dobbertin 2002, 2005; Mayer et al. 2005; Schütz et al.
2006; Vanomsen 2006). These include root anchorage,
which is thought both to have decreased during the past decades perhaps due to soil acidification, e.g. Braun et al.
(2003), and to be a major cause of the increase in storm
damage. However, such site factors might correlate with wind regimes to some extent due to regional similarities in geology and orography. Studies that do not include regional differences in the wind regimes when analysing storm damage patterns thus need careful interpretation. Braun et
al. (2003) analysed soil data from permanent observation
plots and forest damage data from the 1999 storm Lothar. They found more beech (Fagus sylvatica) than Norway spruce (Picea abies) had been damaged. The damage correlated negatively with the actual soil base saturation for beech and Norway spruce, negatively with coarse soil pore volume, and positively with nitrogen concentration in beech leaves. It did not correlate significantly with seasonal ozone, crown transparency, stem diameter, crown size, slenderness, social position, and position within the stand.
Unlike Braun et al. (2003), Nicoll et al. (2006) found no
decrease in root anchorage in their investigation of a database of almost 2,000 trees which had been mechani-cally overturned between 1960 and 2000 in the UK. Instead, they suggest root anchorage is significantly influenced by a variety of parameters including soil groups and root depth classes. Therefore, we cannot assume that root anchorage markedly decreased between 1990 and 1999 in Switzerland. Another factor that is thought to make severe storm damage more likely is unfrozen and water-saturated soil, but this soil condition is rather typical during cyclonal weather, which tends to precede winter storms
(Usbeck et al. 2010a). Other factors known to influence
storm damage, such as the proportion of conifers, stand structure, or management system, did not change substan-tially in the time between the winter storms Vivian and
Lothar, see EAFV (1988), and Brassel and Brändli (1999).
Marked regional variations in peak gust wind speeds, e.g. differences between inner alpine valleys and the central plain, occurred during both storms. The critical wind speed
of 30 m s−1 was greatly exceeded in some regions, but much less in others. Given these large regional differences in the wind regimes, the influence of site and forest conditions on tree failure found in overturn experiments
(Nicoll et al. 2005, 2006, 2008) seems to be of minor
importance.
The amount of forest damage caused by the heaviest storms has increased in Switzerland over the past 150 years
(Usbeck et al.2010a). While the largest amount of damage
that occurred between 1858 and 1907 (on 02 Feb. 1879)
was 571,000 m3, the heaviest storm between 1958 and
2007 (on 26 Dec. 1999) damaged 14.0 million m3 of
timber. The frequency of severe damage due to winter storms has also risen in the last five decades (Usbeck et al.
2010a). These larger amounts of damaged timber might partly be attributed to the fact that the volume of standing timber has increased. However, it may also be more related to extreme wind speeds. Measurement data from Zurich (on the Swiss Plateau), which have been recorded in one of the longest time series of wind observations in Switzerland, show that the number of peak gusts over 24 h and maximum hourly wind speed means have both
risen in the past five decades (Usbeck et al. 2010b).
Long-term observations have revealed large regional variations in the amount and intensity of forest damage. The damage caused by the strongest winter storms is not homogeneously distributed either across the country or even in those specific regions where the damage was
particularly severe (Usbeck et al. 2010a). One possible
reason is that wind fields are strongly influenced by
complex terrain (Ruel et al.1998; Quine et al.1999). Wind
speed and direction tend to vary widely between regions in
Switzerland (Steinhauser 1951). In the case of significant
upstream orographic barriers such as the Jura mountains, regions located in the downstream area may be affected more by winds since the air flow tends to be more turbulent than in areas without a barrier. With prevailing west wind storms, these mountains may have such a barrier effect and amplify the peak gusts in the downstream regions on the Swiss Plateau. The main wind factor determining forest damage in Canton Zurich appears to be gusts and not
average wind speed (Usbeck et al. 2010b). Thus, higher
turbulence is expected to lead to systematically increased damage in downstream regions.
Until now, however, the influence of wind speed on windthrow in Switzerland has never been studied on large
scales (areas >104 km2) using high-resolution damage
inventories. This study investigated the spatial correlation between the available wind data for Switzerland and the inventories of the forest damage that occurred in different regions during the storms Vivian in 1990 and Lothar in 1999. In Switzerland, the winter storm Vivian resulted in 5.1
million m3 damaged growing stock and Lothar in 14.0
million m3. Both were caused by depressions developing
and moving west to east over the Atlantic. The cold front associated with Vivian moved from north to south, crossing the Alps, but the cold front associated with Lothar moved from west to east north of the Alps and did not cross the Alps. These different paths resulted in rather different forest damage patterns, with Vivian causing damage mainly in the pre-Alps and inner Alps, and Lothar mainly in the Swiss Plateau and the pre-Alps. Generally higher maximum wind speeds per event were measured during Vivian in the inner Alps, with peak gusts and maxima of 10 min average wind speed, whereas during Lothar these maxima occurred on
the Swiss Plateau (WSL and BUWAL2001).
In this study, the focus was therefore mainly on different wind factors and their spatial correlation with the damaged areas of the Swiss forest. Since the forest and site conditions did not differ very much between the two storms, their influence was not included. Therefore, wind factors alone were taken as the independent variables and the amount of damage caused as the dependent variable. The following questions were addressed:
How did different wind speed parameters such as peak gust wind speed, maxima of 10-min average wind speed or the maxima of the hourly average wind speed spatially correlate with the observed forest damage? How did wind speed and wind pressure correlate spatially with storm damage in forests situated in hilly and in mountainous regions?
How did wind data such as simulated wind data (A), wind measurement data from climate stations (B), and expert analysed wind data (C) correlate spatially with observed forest damage?
2 Materials and methods
The study area was the whole of Switzerland. After Vivian and Lothar, damage inventories were conducted based on interpretations of aerial photos. Only damage areas included in these inventories were considered. The following geographic information system (GIS) layers were used to define the inventoried areas:
& Storm damage data: flight lines of the Vivian and Lothar inventories (flight service of the Federal Office of Topography Swisstopo, CH-8600 Dübendorf); & Forest area data (forested: yes/no): forest mixture map
WMG25 (Copyright © Bundesamt für Statistik, GEOSTAT, CH-2010 Neuchâtel);
& Additional data: Swiss border outlines (Federal Statistical Office (FSO), CH-3003 Bern), Swiss cantonal borders, and Digital Elevation Model DHM25 (© 1994 Swisstopo,
of the Federal Office of Topography Swisstopo, CH-3084 Wabern).
All storm damage data were derived from GIS shape files provided by the Federal Office for the Environment (FOEN). In the Lothar inventory, damage areas were classified as scattered damage areas (remaining canopy cover >0.2–≥0.6)
or total damage areas (remaining canopy cover ≤0.2) for
forests at least 1 ha in size, whereas in the Vivian inventory
only total damage areas (remaining canopy cover≤0.2) for
forests at least 0.2 ha in size were recorded.
Both modelled as well as observed wind data were included. Maximum values per event were selected. The
variables used are explained in Table1.
The following data were used:
& Simulation data from a 14×14 km grid generated by a numerical, high resolution, hydrostatical weather forecast model run of the official Swiss meteorological service MeteoSwiss.
& Measurement data from the meteorological networks of the MeteoSwiss
& Estimation data:
MeteoSwiss estimation: four gust wind speed isotach maps showing the time steps of the storm front. These are hand-drawn maps showing the maximum values of wind speed recordings of the Swiss climate station networks ANETZ and ENET, published in the book “Lothar. Der Orkan 1999. Ereignisanalyse” (WSL and
BUWAL2001).
WSL estimation: storm maxima of gust wind speeds in a two-cluster isotach map based on hand-drawn maps
(WSL and BUWAL 2001), ANETZ and ENET gust
wind speed data, a digital elevation model, a digital inclination model and a digital exposition model.
The general approach is shown schematically in
Table2, which includes the list of abbreviations:
First, the forest GIS layer was intersected by the damage inventory perimeter and dissolved by the
damage inventory layers (Fig.1a). Second, the following
buffers were constructed: circular buffers (c; Fig.1b and c)
1, 2, 3, and 5 km in radius and rectangular buffers
(w and o) centrically around the points of interest (Fig.1d
and e). The rectangular buffers comprise a longitudinal/ latitudinal proportion of 5:1 and cover areas similar to circles of 0.5, 1, 2, 3, and 5 km in radius. Two different
orientations of the rectangular buffers were tested:
longitudinal (w; Fig.1d) and perpendicular (o; Fig. 1e),
arranged according to the average wind direction at the time of the maximum value of the wind speed variable considered. Third, the forest GIS layer and the damage inventory GIS layer were intersected by the buffer GIS layer. The fractions of the damaged forest area were then computed for all buffer areas. Wind pressure was calculated as:
pwind¼ cw0:5 rv2 ð1Þ
where, pwind= wind pressure, cw = air drag coefficient,
ρ = air density, and v = wind speed. Regressions between the wind pressure and the damage fractions of the Table 1 Wind speed variables used in this study
Variable Symbol Unit
Peak gust wind speed ug m s−1
Maximum of the 10 min average wind speed u10 m s−1
Maximum of the hourly average wind speed u60 m s−1
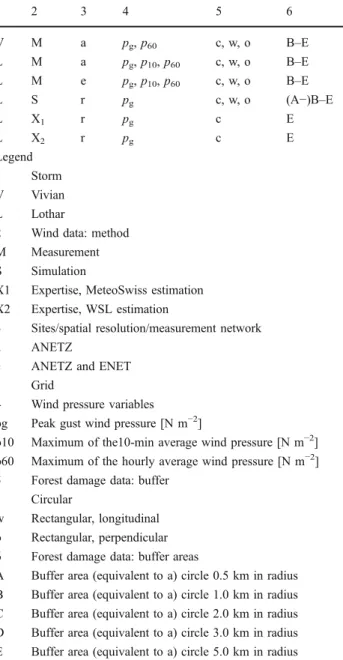
Table 2 Investigation plan illustrating the scheduled approaches
1 2 3 4 5 6 V M a pg, p60 c, w, o B–E L M a pg, p10, p60 c, w, o B–E L M e pg, p10, p60 c, w, o B–E L S r pg c, w, o (A−)B–E L X1 r pg c E L X2 r pg c E Legend 1 Storm V Vivian L Lothar
2 Wind data: method M Measurement S Simulation
X1 Expertise, MeteoSwiss estimation X2 Expertise, WSL estimation
3 Sites/spatial resolution/measurement network a ANETZ
e ANETZ and ENET r Grid
4 Wind pressure variables pg Peak gust wind pressure [N m−2]
p10 Maximum of the10-min average wind pressure [N m−2] p60 Maximum of the hourly average wind pressure [N m−2] 5 Forest damage data: buffer
c Circular
w Rectangular, longitudinal o Rectangular, perpendicular 6 Forest damage data: buffer areas
A Buffer area (equivalent to a) circle 0.5 km in radius B Buffer area (equivalent to a) circle 1.0 km in radius C Buffer area (equivalent to a) circle 2.0 km in radius D Buffer area (equivalent to a) circle 3.0 km in radius E Buffer area (equivalent to a) circle 5.0 km in radius
forest area were then used to compute the coefficients
of determination R2 for each buffer type (I and II),
depending on the buffer area size. The software R2
(Steiger and Fouladi 1992) was applied to the
angular-transformed coefficients of determination to check the significance level.
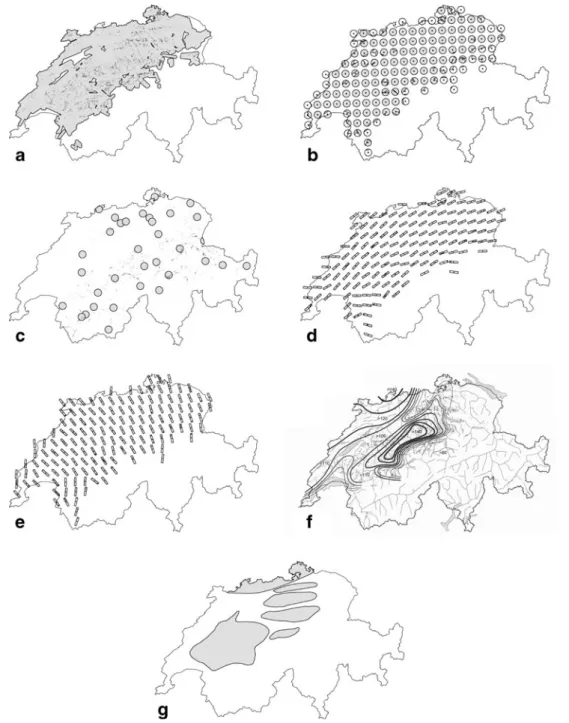
Fig. 1 Spatial distributions of the samples and estimations: a inventoried forest damage from the Lothar storm in Switzerland (black areas) in the inventory area (grey); b simulation of the Lothar storm in Switzerland, grid points buffers 5 km in radius around the grid points (grey regions of interest); c inventoried forest damage from the Vivian storm in Switzerland (black areas) from the buffers 5 km in radius (grey buffer area) around the ANETZ meteorological stations; d simulation of the Lothar storm in Switzerland: grid points circle 3 km in radius, equivalent in area to the rectangular buffers around the grid points, longitudinal to the wind direction (grey regions of interest); e simulation of the Lothar storm in Switzerland: grid points circle
3 km in radius, equivalent in area to the rectangular buffers around the grid points, perpendicular to the wind direction (grey regions of interest); f expert estimates related to the Lothar storm in Switzerland (MeteoSwiss estimation): Swiss stream network (thin black lines and grey areas), inventoried forest damage (black areas), isotachs (black lines, thickness according to estimated maximum gust wind speed [km h−1]; numbers, estimated interisotach average of the maximum gust wind speed for a certain time step; isotachs; WSL and BUWAL 2001), g expert estimates related to the Lothar storm in Switzerland (WSL estimation): areas with estimated maximum gust wind speeds greater than 125 km h−1(grey areas)
3 Specific methods 3.1 Measurements (M)
Vivian: The primary Swiss meteorological network ANETZ in forest zone altitudes (36 stations considered) and the full sets of buffers were used and the general method applied.
Lothar: The primary Swiss meteorological network ANETZ in forest zone altitudes (34 stations considered) and the full sets of buffers were used and the general method applied.
Lothar: The primary Swiss meteorological network ANETZ (34 stations considered) and the secondary Swiss meteorological network ENET (34 stations considered) in forest zone altitudes and the full set of buffers were used in combination and the general method applied.
3.2 Simulation (S)
The simulation grid and the full sets of buffers were used and the general method applied. Additionally, to separately compare the impact on the Swiss lowlands and on areas up to medium altitudes, the general method was applied to data subsets limited to the simulation points first up to 800 m above sea level (asl) and then 1,400 m asl.
3.3 Expert estimates (X)
MeteoSwiss estimation First, a peak gust map was drawn dissolving the four gust wind speed isotach maps adopted
from WSL and BUWAL (2001). See the example shown in
Fig.1f. The simulation grid and the buffers c, size A, were
then used and the general method applied.
To compare the observed wind data and the estimated
data spatially, the peak gust map (Fig.1g) and the map of
the meteorological stations were dissolved and the means of the maxima of the observations per interisotach were computed. The significance of differences between the mean values was tested by applying the Kruskal–Wallis rank sum test (H test) and the Wilcoxon, Mann and Whitney test (U test) between all clusters separately. WSL estimation First, a map was drawn summarising the peak gust wind speed based on meteorological measure-ments and descriptions. The simulation grid and the buffers c, size A, were then used and the general method applied.
To compare the observed wind data and the estimation data spatially, the peak gust wind speed map and the map of the meteorological stations were dissolved and the means of the maxima of the observations per interisotach area computed. The significance of the differences between the mean values was tested by applying the Wilcoxon, Mann and Whitney test (U test) between the clusters.
4 Results
The variable that correlated best with the damage area
fraction was peak gust wind pressure (pg). The coefficient
of determination for gust wind speeds and the damage area fraction of the forest area generally increased from the larger to the smaller buffers and were best for the circular
buffers of the storm Vivian (Table 3). Generally, the
number of observations of damaged forest areas within the buffer zone decreased from the larger to the smaller buffers.
4.1 Measurements
Vivian: pgfitted best spatially with the damage area fraction
of the circular buffers of the storm Vivian (Table3) and all
buffer sizes tested were significantly correlated. The R2
between the wind pressure and the damage area fraction increased from the largest to the smallest buffer. The
transformed R2 of the damage area fraction and pg was
0.3 with the largest circular buffer and 0.8 with the smallest
(Table 3), but the damage area fraction decreased from
1.7% to 0.9%. Additionally, pgwas significantly correlated
with the damage area fraction of the two largest rectangular buffers along the wind direction of the storm Vivian, while
R2 remained relatively low at a level of 0.3. None of the
other wind variables tested with the circular and rectangular buffers were significantly correlated. No clear increases or decreases in the damage area fraction were found.
Lothar, ANETZ: None of the wind variables of the storm Lothar tested with the circular and rectangular buffers around the meteorological stations of the ANETZ were significantly correlated, and no clear increases or decreases in the damage area fraction were found.
Lothar, ANETZ and ENET: pgand 10 min average wind
pressure of the combined ANETZ and ENET of the storm Lothar were significantly correlated with the damage fraction of the forest area of the smallest tested circular
buffer size, while R2 remained relatively low at a level of
0.2 (Table 3). All other wind variables tested with the
circular and rectangular buffers were not significantly correlated and no clear increases or clear decreases were computed for the damage area fraction.
4.2 Simulation
The intermediate circular buffers of the simulation yielded
significant correlations between pgand the transformed data
of the damage area fraction for the storm Lothar at low and
medium altitudes, but with low levels of R2. The damage
area fraction increased from the largest to the smallest buffers. In contrast, no significant correlations were found for the rectangular buffers, neither for the significance tests
T able 3 Coefficients of determination (R 2 ) and probabilities of the test statistics (p values) according to the investigation plan (described in Section 2 ; legend, see T able 2 ; bold p values; underlined significant values) 1 VL L L L L 2 M M M S X1 X2 3 a a a a aaaa a a aaee e e eer r r r r r 4 pg p10 p60 pg p10 p60 pg p10 p60 pg p10 p60 pg p10 p60 pg p10 p60 pg pg pg pg pg pg 56 R 2 R 2 R 2 p- value p- value p- value R 2 R 2 R 2 p- value p- value p- value R 2 R 2 R 2 p- value p- value p- value R 2 p- value R 2 p- value R 2 p-value cA – – – –––– – – –––– – – –––– – – –– – B 0.79 – 0.09 0.0450 – 0.6232 0.02 0.23 0.06 0.6336 0.1 179 0.4484 0.24 0.19 – 0.0257 0.0481 – 0.01 0.5102 –– – – C 0.67 – 0.02 0.0003 – 0.6219 0.01 0.04 <0.01 0.6825 0.3671 0.3126 0.10 0.01 – 0.0531 0.6640 – 0.04 0.0540 –– – – D 0.42 – 0.02 0.0035 – 0.5419 0.01 0.07 0.05 0.5725 0.2069 0.2764 0.08 0.03 – 0.0614 0.2919 – <0.01 0.5147 –– – – E 0.29 – 0.15 0.0049 – 0.0536 0.04 0.1 1 0.05 0.3077 0.0952 0.2524 0.03 0.01 – 0.2126 0.5207 – <0.01 0.51 15 <0.01 0.6010 0.40 ≤ 0.0001 wA – – – –––– – – –––– – − ––– 0.04 0.3384 –– – – B 0.74 – 0.66 0.1415 – 0.0966 0.02 0.01 0.03 0.7737 0.7950 0.7258 0.01 0.06 – 0.7445 0.4868 – <0.01 0.8437 –– – – C 0.03 – 0.04 0.5268 – 0.4866 0.02 0.01 0.02 0.5737 0.1648 0.5726 <0.01 <0.01 – 0.7649 0.8227 – <0.01 0.61 15 –– – – D 0.28 – 0.09 0.0173 – 0.1941 <0.01 0.03 0.02 0.8356 0.3991 0.5309 <0.01 <0.01 – 0.8342 0.7295 – <0.01 0.6963 –– – – E 0.30 – 0.08 0.0037 – 0.1407 0.02 0.12 0.07 0.5532 0.0877 0.1779 <0.01 0.02 – 0.6920 0.3297 –– – – –– – oA – – – –––– – – –––– – – ––– 0.04 0.2555 –– – – B 0.51 – <0.01 0.0723 – 0.9545 <0.01 0.18 0.02 0.9064 0.1288 0.6863 <0.01 0.04 – 0.9721 0.4003 – <0.01 0.9734 –– – – C 0.01 – <0.01 0.7564 – 0.8752 <0.01 0.10 0.05 0.8106 0.151 1 0.3017 0.01 0.01 – 0.5865 0.6230 – 0.01 0.5028 –– – – D <0.01 – 0.1 1 0.9657 – 0.1578 0.03 0.15 0.1 1 0.4632 0.0631 0.1 122 0.01 <0.01 – 0.4459 0.7196 – <0.01 0.4921 –– – – E <0.01 – 0.1 1 0.8819 – 0.0859 0.04 0.06 0.1 1 0.3331 0.2377 0.0947 0.05 0.01 – 0.1385 0.4753 –– – – –– –
of the transformed data of the damage area fraction and wind speed nor for any subset of the damage area fraction. 4.3 Expert estimates
MeteoSwiss estimation No clear correlations between the damage area fraction and gust wind speed clusters were found, but when the damage inventory GIS layer was partially dissolved by the single gust wind speed isotach maps, visually close connections between the high gust wind speed areas and the areas with high damage densities
(Fig.1f) were observed.
Using the 14×14 km grid of the simulation with the
circular buffer 5 km in radius, the observed pgassigned to
the spatial clusters of the dissolved map of the storm Lothar were not significantly correlated with the damage area
fraction of the circular buffers 5 km in radius (Table3). No
clear correlations between the damage area fractions were found for the areas with the gust wind speed estimation clusters. With increasing levels of the gust wind speed clusters, the gust wind speeds recorded by ANETZ and
ENET increased (Fig.2). The Kruskal–Wallis rank sum test
was significant. The U test was applied to each two of the clusters only for the wind pressure pairs 105/125, 105/135,
and 115/135 km h−1. It was also applied to the wind
pressure pairs 95/135, 105/135, and 115/135 km h−1for the
damage fraction and significant differences between wind pressures were found. The box plots also indicate significant
differences in these cases (Figs.2and3).
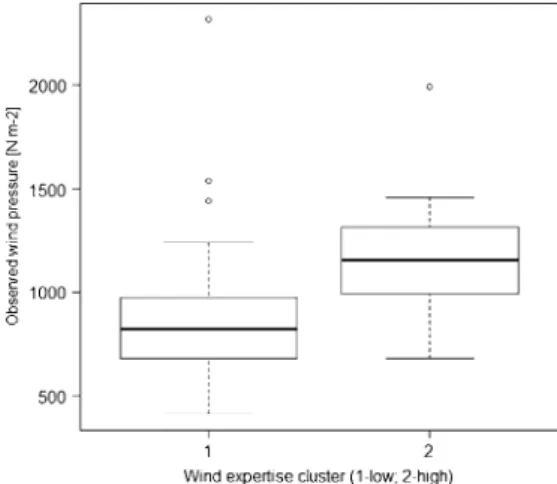
WSL estimation The proportion of forest damage increased for the areas with high peak gust wind speed. The observed gust wind speeds assigned to the spatial clusters of the magnitude map of the storm Lothar were significantly correlated with the damage area fraction of the circular
buffers 5 km in radius (Table3). The mean of the observed
gust wind speed in the area of the classified high gust wind
speed was clearly higher (148 km h−1) than the mean of the
gust wind speed in the area of the estimated lower gust wind
speed (126 km h−1). The U tests indicated significantly
different observed gust wind speeds and damage fractions for the two gust wind speed estimation areas (see also the box
plots in Figs.4and5).
5 Discussion
The parameter performing best in most of our models was found to be the gust wind speed connected to the circular buffers with small buffer sizes. A close connection between storm damage to forests and wind speed is not a unique Fig. 3 Box plots illustrating the variability of the observed damage area fraction in the eight interisotach clusters of the maximum gust map (Expertise MeteoSwiss): clusters named according to the mean of the estimated wind pressure vs. observed damage area fraction
Fig. 2 Box plots illustrating the variability of the observed wind pressure in the eight interisotach clusters of the maximum gust map (Expertise MeteoSwiss): clusters named according to the mean of the estimated wind pressure vs. observed wind pressure
Fig. 4 Box plots illustrating the variability of the observed wind pressure in the two interisotach clusters of the maximum gust map (Expertise WSL): clusters named according to the estimated wind pressure level vs. observed wind pressure
finding for Switzerland. It is in line with the results of
various studies, e.g. Quine (1991) for (southern) Britain
from 1945 to 1990, Schüepp (1994) for Switzerland
examining the 1990 winter storm Vivian, Gardiner et al.
(2000) for the prediction of critical wind speeds using two
models, Otto (2000) analysing long-term observations in
Lower Saxony in Germany, Mayer and Schindler (2002)
modelling wind loads on trees for the winter storm Lothar
in Germany, Nicoll et al. (2005) for estimations based on
winching experiments in Scotland, Changnon (2007) for
the USA from 1949–2003, Meyer et al. (2008) for the total
damage threshold during the winter storm Lothar in
Switzerland, Schindler et al. (2009) for the storm field of
the winter storm Lothar and Gardiner et al. (2010)
reviewing destructive storms for Europe 1950–2010. In other studies, wind parameters were found to be of
nonsignificance (Mayer et al.2005; Schütz et al. 2006) or
secondary importance (Kupfer et al.2008).
Several scales in worldwide use for the estimation of the effective wind speed range at a given location have also been successfully related to wind damage to trees, e.g. the Beaufort scale, the Saffir/Simpson scale, the Fujita Tornado
scale and the TORRO scale (Cullen 2002; Hubrig 2004).
The frequent use of such scales (Boose et al.1994,2001,
2004; Busby et al. 2008) can be seen as a sign of their
usefulness. The effect of wind speed on trees was also used for studies relating damage to wind speeds (Cook and
Goyens 2008), even using recent and subfossile forest
damage patterns (Lorrey and Martin2005). Such universal
use of an effect that is relatively easy to assess (the wind effect on trees) for a cause that is very difficult to assess (wind) assumes a predominant influence of wind speed on storm damage to forests. Nonetheless, wind is not the sole agent influencing the amount of storm damage to forests
during such an event. A variety of causative factors for storm damage have been repeatedly found worldwide. In a number of studies, tree height was found to be a very important factor influencing the level of damage, e.g.
Canham et al. (2001), Kenderes et al. (2007), Busing
et al. (2009), and Schmidt et al. (2010). Additional factors
found to significantly influence damage include altitude,
exposition to the prevailing winds (Schüepp et al. 1994),
stand age, development stage, percentage of conifers, soil– water logging, soil depth, exposition, stand structure, and
previous damage or fellings (Dobbertin 2002), soil base
saturation and nitrogen concentration in leaves (Braun et al.
2003), country, soil pH, proportion of coniferous trees,
slope, humus type, stand height, and altitude (Mayer et al.
2005), tree species mixture and aspect (Schütz et al.2006),
stand structure and stand age, mean elevation, the range of
elevations across the stands (Evans et al. 2007), elevation,
aspect, slope, and age and height of the two dominant tree
species (Kenderes et al.2007), stand age, forest type, stand
condition, site aspect, and distance to the nearest perennial
stream (Kupfer et al. 2008), slope and aspect, soil water
saturation (Schmöckel and Kottmeier 2008), tree species,
topographic exposure, the severity of the local storm regime, and the combined effect of basal area and mean slenderness of the dominant trees (Martin-Alcon et al.
2010), land type association, distance to the nearest lake,
and elevation (Moser and Nelson2009), tree species class,
and tree age or growth stage (Phillips et al. 2008), tree
species, breast height diameter, and its correlation with species-specific mean crown depth/height (Yoshida and
Noguchi 2009), and finally, height to diameter at breast
height ratio, tree species group, exposition, and soil water
saturation (Schmidt et al. 2010). However, sometimes
factors such as stem diameter, slenderness, social position,
and position within the stand (Braun et al. 2003) or
slenderness and time since last thinning or previous damage
(Schütz et al. 2006) were not found to significantly relate
to storm damage to forests but in other studies one or more of them were found as significantly influencing factors
(Dobbertin 2002; Hanewinkel et al. 2008; Schmidt
et al. 2010).
A spatial scale-dependent differentiation was found by
Xi et al. (2008): “Tree size and species explain damage
variation at the stand scale; topographic, site and stand factors explain damage variation at the landscape scale and wind speed and precipitation explain damage variation at
the regional scale.” Usbeck et al. (2010b) computed a
correlation coefficient of 0.93 for the correlation between the maximum wind force (derived from maximum gust wind speed) and the forest damage for both the landscape scale and the regional scale. The result of Usbeck et al. (2010b) is apparently more in line with Xi et al. (2008), but seems to disagree with the present study where a generally Fig. 5 Box plots illustrating the variability of the observed damage
area fraction in the two interisotach clusters of the maximum gust map (Expertise WSL): clusters named according to the estimated wind pressure level vs. the observed damage area fraction
increasing correlation between wind speed and forest damage for smaller spatial scales was found. However, the stand scale was not examined in the study of Usbeck et
al. (2010b), and Xi et al. (2008) used the wind data from
the nearest weather station (at an airport) for one of two stand scale approaches and the landscape scale approach data were adopted from a Fujita scale estimation for the area concerned. Taking into account potential differences between the wind fields (hurricane, tornado, and extratropical winter storm), an assumption of similar spatial conditions may fail for the present case.
The damage inventory map for the storm Lothar shows several west–east aligned stripes with high densities of
damaged forest areas (see Fig. 1f). One possible
explana-tion is that turbulent effects at subgrid resoluexplana-tion triggered these extreme gusts in the downwind stripes. The spatial correlation of natural wind, including strong seasonal wind
and extreme storms, was studied by Toriumi et al. (2000)
for spatial resolutions between 102and 103m. They found
spatial correlations of almost zero, especially in the case of extreme wind when the distance between measurement points was larger than 127 m. Therefore, the authors of the present study assume a strong influence of the orography on the air flow, especially in highly structured terrain
(Schmöckel2005; Lux 2007). Hence, the closest
connec-tion was computed as expected between forest damage and wind speed for the winter storm Vivian. On the other hand, the weak connection between the forest damage and the wind speed for even the smallest circular buffers for the storm Lothar was surprising. It may be explained by the extremely chaotic wind field of this exceptional storm event
(Schütz et al. 2006). In the case of the storm Vivian, the
wind field was partly channelized, especially in the valleys
(König1995). In a numerical experiment, Schär and Durran
(1997) showed that topographic features can trigger“vortex
streets”, i.e. stripes with elevated turbulence. A similar phenomenon possibly occurred during the storm Lothar: When backtracking, the directions of stripes seem to point to sharp mountain crests in the otherwise smooth ridge of the Jura Mountains, such as the Creux du Vent and the Clus at Rondchatel. The resulting high turbulence may have
contributed to the lower R2of Lothar compared to Vivian.
If these stripes were caused by small topographical features, such special conditions could be included in future models with higher spatial resolution.
Not surprisingly, the main damage areas in Switzerland were found along the Alpine valleys for the storm Vivian, but in the moderately hilly areas of the Swiss Plateau for the storm Lothar. The nonchannelized wind field of Lothar obviously included a spatially chaotic structure which was impossible to take adequately into account either by aligning the buffers to the wind direction or by the use of the smallest possible buffer size.
The problematic variable in this case is the wind speed, i.e. the spatial resolution of the available observed wind data. In such cases, the use of modelled wind data is an appropriate solution. The simulation data used in this study were derived from a rather old simulation model (Schubiger, F., MeteoSwiss, oral communication in 2007). The finding that there were significant correlations between the simulated gust wind speed and the forest damage on a
small scale are in line with that of Usbeck et al. (2010b). The
reason why the significance level increased when only lower altitudes were considered may be that variations in altitude increase with buffer radius in mountainous regions. Better results should be attainable when using results from computer simulations specifically run for this special purpose. Such a model is available with FITNAH, a
nonhydrostatic mesoscale simulation model (Gross 1991).
This model is being developed explicitly including the estimation of storm damage risks to forests and has successfully been applied to forest damage of the winter
storms Vivian (König1995) and Lothar (Schmöckel 2005).
FITNAH uses various variables describing forest site and stand conditions, especially factors closely related to the wind drag such as tree age (referring to the tree height), altitude, and exposition.
Using such models and incorporating available forest site condition information and topography may potentially improve the correlation between wind information and forest damage in the complex Swiss terrain.
6 Conclusions
Gust wind speed was the wind variable that had the highest correlation with storm damage to forests, with a higher coefficient of determination for the small circular buffer areas. If it were possible to obtain more reliable and spatially accurate wind speed and pressure estimations, especially for gusts at the scale of forest stands, most of the storm damage risk to forests could probably be modelled on the basis of wind variables. For this purpose, the effects of small-scale topography on turbulence are not adequately included in current weather models. Until all the main influencing factors can be included, however, damage models will remain difficult to adapt and will produce rather random results.
If the reoccurrence period of damaging storms is shorter than the period needed for the forest to become productive and fulfil the goal of forest management, potentially affected forest stands will have to be managed in a different, loss-minimising way. For such decisions, detailed knowledge about the spatial distribution of risks is essential. Therefore, additional deterministic and probabilistic research on the mesoscale, toposcale, and microscale risks to
Swiss forests is needed for all areas likely to be affected by damaging storms.
Acknowledgements This research was partly supported by PhD fellowship No. 113425 from the Hans Böckler Stiftung (HBS), Germany, by the LOTHAR Grundlagenprogramm of the FOEN, Switzerland, and by the Forest Dynamics programme of the Swiss Federal Institute for Forest, Snow and Landscape Research (WSL).
We would like to thank Stephan Bader and Francis Schubiger, MeteoSwiss, for their valuable assistance in describing the meteorology of severe west wind storms in Switzerland, and Deborah van Geijtenbeek and Geneviève Baudraz for their help with the special wind datasets of MeteoSwiss. We are also indebted to Philipp Mayer, science-textflow, for information on interdisciplinary investigations of wind simulations and forest damage and to Peter Jakob, WSL, for his helpful suggestions. We thank Ann-Marie Jakob-Murphy and Silvia Dingwall for their feedback on the use of the English language. We also thank two anonymous reviewers for their useful comments.
References
Blennow K, Olofsson E (2008) The probability of wind damage in forestry under a changed wind climate. Clim Change 87(3–4):347– 360. doi:10.1007/s10584-007-9290-z
Boose ER, Foster DR, Fluet M (1994) Hurricene impacts to tropical and temperate forest landscapes. Ecol Monogr 64(4):369–400. doi:10.2307/2937142
Boose ER, Chamberlin KE, Foster DR (2001) Landscape and regional impacts of hurricanes in New England. Ecol Monogr 71(1):27– 48. doi:10.2307/3100043
Boose ER, Serrano MI, Foster DR (2004) Landscape and regional impacts of hurricanes in Puerto Rico. Ecol Monogr 74(2):335– 352. doi:10.1890/02-4057
Brassel P, Brändli U-B (1999) Schweizerisches Landesforstinventar. Ergebnisse der Zweitaufnahme 1993–1995. Paul Haupt: Bern Braun S, Schindler C, Volz R, Flückiger W (2003) Forest damages by the
storm“Lothar” in permanent observation plots in Switzerland: the significance of soil acidification and nitrogen deposition. Water Air Soil Poll 142:327–340
Busby PE, Motzkin G, Boose ER (2008) Landscape-level variation in forest response to hurricane disturbance across a storm track. Can J For Res 38(12):2942–2950. doi:10.1139/x08-139
Busing RT, White RD, Harmon ME, White PS (2009) Hurricane disturbance in a temperate deciduous forest: patch dynamics, tree mortality, and coarse woody detritus. Plant Ecol 201(1):351–363. doi:10.1007/s11258-008-9520-0
Canham CD, Papaik MJ, Latty EF (2001) Interspecific variation in susceptibility to windthrow as a function of tree size and storm severity for northern temperate tree species. Can J For Res 31 (1):1–10
Changnon SA (2007) Catastrophic winter storms: an escalating problem. Clim Change 84(2):131–139. doi: 10.1007/s10584-007-9289-5
Cook GD, Goyens C (2008) The impact of wind on trees in Australian tropical savannas: lessons from cyclone Monica. Austral Ecol 33 (4):462–470. doi:10.1111/j.1442-9993.2008.01901.x
Cullen S (2002) Trees and wind: wind scales and speeds. J Arboric 28 (5):237–242
Dobbertin M (2002) Influence of stand structure and site factors on wind damage—comparing the storms “Vivian” and “Lothar”. For Snow Landsc Res 77(1/2):187–205
Dobbertin M (2005) In: Indermühle M, Raetz P, Volz R (eds) LOTHAR Ursächlichen Zusammenhänge und Risikobewertung.
Synthese des Teilprogramms 6, vol 184. Umwelt-Materialien. Bundesamt für Umwelt. Wald und Landschaft (BUWAL), Bern, pp 39–52
EAFV (1988) Schweizerisches Landesforstinventar: Ergebnisse der Erstaufnahme 1982–1986. Berichte der Eidgenössischen Anstalt für das Forstliche Versuchswesen (EAFV) 305:1–375
Evans AM, Camp AE, Tyrrell ML, Riely CC (2007) Biotic and abiotic influences on wind disturbance in forests of NW Pennsylvania, USA. For Ecol Manage 245(1–3):44–53. doi:10.1016/j. foreco.2007.03.024
Gardiner B, Peltola H, Kellomaki S (2000) Comparison of two models for predicting the critical wind speeds required to damage coniferous trees. Ecol Model 129(1):1–23
Gardiner B, Byrne K, Hale S, Kamimura K, Mitchell SJ, Peltola H, Ruel JC (2008) A review of mechanistic modelling of wind damage risk to forests. Forestry 81(3):447–463
Gardiner B, Blennow K, Carnus J-M, Fleischer P, Ingemarson F, Landmann G, Lindner M, Marzano M, Nicoll B, Orazio C, Peyron J-L, Reviron M-P, Schelhaas MJ, Schuck A, Spielmann M, Usbeck T (2010) Destructive storms in european forests: past and forthcoming impacts. European Forest Institute EFIAtlantic European Regionel Office-EFIATLANTIC, Joensuu
Gross G (1991) Anwendungsmöglichkeiten mesoskaliger Simulation-smodelle dargestellt am Beispiel Darmstadt. Meteorol Rundsch 43:97–112
Hanewinkel M, Breidenbach J, Neeff T, Kublin E (2008) Seventy-seven years of natural disturbances in a mountain forest area— the influence of storm, snow, and insect damage analysed with a long-term time series. Can J For Res 38(8):2249–2261. doi:10.1139/x08-070
Hann J (1869) Untersuchungen über die Winde der nördlichen Hemisphäre und ihre klimatologische Bedeutung. Sitzb dk Akad D Wissensch II Abth I.X. Bd. (Juli-Heft)
Hollenstein K (2002) Herleitung eines Modells zur Abschätzung der mechanischen Stabilität von Waldbeständen. Ergebnisse des Komponentenprojekts C. Polyprojekt PRIMALP. ETH Zürich, Zürich
Hubrig M (2004) Analyse von Tornado-und Downburst-Windschäden an Bäumen. Analysis of tornado and downburst wind damage to trees. Forst und Holz 59:78–84
Kenderes K, Aszalos R, Ruff J, Barton Z, Standovar T (2007) Effects of topography and tree stand characteristics on susceptibility of forests to natural disturbances (ice and wind) in the Borzsony Mountains (Hungary). Community Ecol 8(2):209–220. doi:10.1556/ComEc.8.2007.2.7
König A (1995) Sturmgefährdung von Beständen im Altersklassenwald: ein Erklärungs-und Prognosemodell. J. D. Sauerländer, Frankfurt am Main
Kuhn N (1995) Die standörtliche Abhängigkeit der Vivian-Windwürfe. Informationsblatt des Forschungsberiches Landschaftsökologie Nr 28:1–3
Kupfer JA, Myers AT, McLane SE, Melton GN (2008) Patterns of forest damage in a southern Mississippi landscape caused by Hurricane Katrina. Ecosyst 11(1):45–60. doi:10.1007/s10021-007-9106-z Lamb H (1991) Historic storms of the North Sea, British Isles and
Northwest Europe. Cambridge University Press, Cambridge Leckebusch GC, Weimer A, Pinto JG, Reyers M, Speth P (2008)
Extreme wind storms over Europe in present and future climate: a cluster analysis approach. Meteorol Z 17(1):67–82. doi:10.1127/0941-2948/2008/0266
Lorrey A, Martin T (2005) Use of modern tree-fall patterns as a guideline for interpreting prostrate trees at a pre-Last Glacial Maximum paleoforest site, upper North Island, New Zealand. J Geophys Res-Biogeosci 110(G2). doi:10.1029/2005jg000040 Lux R (2007) Modellsimulationen zur Strömungsverstärkung
Wissenschaftliche Berichte des Instituts für Meteorologie und Klimaforschung der Universität Karlsruhe (TH), vol 40. Universität Karlsruhe (TH), Karlsruhe
Martin-Alcon S, Gonzalez-Olabarria JR, Coll L (2010) Wind and snow damage in the Pyrenees pine forests: effect of stand attributes and location. Silva Fenn 44(3):399–410
Maurer J, Billwiller R Jr, Hess C (1909) Das Klima der Schweiz. Auf Grundlage der 37jährigen Beobachtungsperiode 1864–1900, vol 1. Huber & Co, Frauenfeld
Mayer H, Schindler D (2002) Forest meteorological fundamentals of storm damages in forests in connection with the extreme storm “Lothar”. Allg Forst Jagdztg 173(11–12):200–208
Mayer P, Brang P, Dobbertin M, Hallenbarter D, Renaud JP, Walthert L, Zimmermann S (2005) Forest storm damage is more frequent on acidic soils. Ann For Sci 62(4):303–311. doi:10.1051/ forest.2005025
Meyer FD, Paulsen J, Korner C (2008) Windthrow damage in Picea abies is associated with physical and chemical stem wood properties. Trees-Struct Funct 22(4):463–473. doi: 10.1007/s00468-007-0206-3
Moser WK, Nelson MD (2009) Windstorm damage in Boundary Waters Canoe Area Wilderness (Minnesota, USA): evaluating landscape-level risk factors. Baltic For 15(2):248–254
Nicoll BC, Achim A, Mochan S, Gardiner BA (2005) Does steep terrain influence tree stability? A field investigation. Can J For Res 35(10):2360–2367. doi:10.1139/x05-157
Nicoll BC, Gardiner BA, Rayner B, Peace AJ (2006) Anchorage of coniferous trees in relation to species, soil type, and rooting depth. Can J For Res 36(7):1871–1883
Nicoll BC, Gardiner BA, Peace AJ (2008) Improvements in anchorage provided by the acclimation of forest trees to wind stress. Forestry 81(3):389–398
Nilsson C, Goyette S, Bärring L (2007) Relating forest damage data to the wind field from high-resolution RCM simulations: case study of Anatol striking Sweden in December 1999. Glob Planet Chang 57:161–176
Otto H-J (2000) Waldbauliche Erfahrungen nach Sturmkatastrophen-eine Rückschau in Niedersachsen (Silvicultural experience after wind-throw catastrophs—a retrospect view in Lower Saxony). Forst und Holz 55(12):371–376
Phillips JD, Marion DA, Turkington AV (2008) Pedologic and geomorphic impacts of a tornado blowdown event in a mixed pine-hardwood forest. Catena 75(3):278–287. doi:10.1016/j. catena.2008.07.004
Quine CP (1991) Recent storm damage to trees and woodlands in southern Britain. Research for practical Arboriculture. For Comm Bull, vol 97. HMSO, London
Quine CP, Bell PD (1998) Monitoring of windthrow occurrence and progression in spruce forests in Britain. Forestry 71(2):87–97 Quine CP, Humphrey JW, Ferris R (1999) Should the wind
disturbance patterns observed in natural forests be mimicked in planted forests in the British uplands? Forestry 72(4):337–358 Ray D, Nicoll BC (1998) The effect of soil water-table depth on root-plate
development and stability of Sitka spruce. Forestry 71(2):169–182 Rockel B, Woth K (2007) Extremes of near-surface wind speed over
Europe and their future changes as estimated from an ensemble of RCM simulations. Clim Change 81:267–280
Ruel JC, Pin D, Cooper K (1998) (Research note.) Effect of topography on wind behaviour in a complex terrain. Forestry 71(3):261–265
Schär C, Durran DR (1997) Vortex formation and vortex shedding in continuously stratified flows past isolated topography. J Atmos Sci 54:534–554
Schelhaas MJ, Nabuurs GJ, Sonntag M, Pussinen A (2002) Adding natural disturbances to a large-scale forest scenario model and a case study for Switzerland. For Ecol Manage 167(1–3):13–26
Schelhaas MJ, Nabuurs GJ, Schuck A (2003) Natural disturbances in the European forests in the 19th and 20th centuries. Gl Ch Biol 9 (11):1620–1633. doi:10.1046/j.1529-8817.2003.00684.x Schiesser H-H, Pfister C, Bader J (1997) Winter storms in Switzerland
North of the Alps 1864/1865–1993/1994. Theor Appl Climatol 58:1–9
Schindler D, Grebhan K, Albrecht A, Schonborn J (2009) Modelling the wind damage probability in forests in Southwestern Germany for the 1999 winter storm‘Lothar’. Int J Biometeorol 53(6):543– 554. doi:10.1007/s00484-009-0242-3
Schmidt M, Hanewinkel M, Kandler G, Kublin E, Kohnle U (2010) An inventory-based approach for modeling single-tree storm damage— experiences with the winter storm of 1999 in southwestern Germany. Can J For Res 40(8):1636–1652. doi:10.1139/x10-099 Schmöckel J (2005) Orographischer Einfluss auf die Strömung
abgeleitet aus Sturmschäden im Schwarzwald während des Orkans“Lothar”. Universität Karlsruhe (TH), Karlsruhe Schmöckel J, Kottmeier C (2008) Storm damage in the Black Forest
caused by the winter storm“Lothar”—part 1: airborne damage assessment. Nat Hazards Earth Syst Sci 8:795–803
Schüepp M (1950) Wolken/Wind und Wetter. Forschung und Leben, Büchergilde Gutenberg, Zürich
Schüepp M, Schiesser HH, Huntrieser H, Scherrer HU, Schmidtke H (1994) The winterstorm“Vivian” of 27 February 1990: about the meteorological development, wind forces and damage situation in the forests of Switzerland. Theor Appl Climatol 49:183–200 Schütz JP, Götz M, Schmid W, Mandallaz D (2006) Vulnerability of
spruce (Picea abies) and beech (Fagus sylvatica) forest stands to storms and consequences for silviculture. Eur J Forest Res 125 (3):291–302. doi:10.1007/s10342-006-0111-0
Steiger JH, Fouladi RT (1992) R2. Available from: http://www. statpower.net/Software.html. Accessed 16 Aug 2009
Steinhauser F (1951) Über die Windverstärkung an Gebirgszügen. Ein Beitrag zur Frage der Beeinflussung der Luftströmungen durch Gebirge. Theor Appl Climatol 2:39–64
Toriumi R, Katsuchi H, Furuya N (2000) A study on spatial correlation of natural wind. J Wind Eng Ind Aerodyn 87(2–3):203–216 Trenberth KE, Jones PD, Ambenje P, Bojariu R, Easterling D, Klein
Tank A, Parker D, Rahimzadeh F, Renwick JA, Rusticucci M, Soden B, Zhai P (2007) Observations: surface and atmospheric climate change. In: Solomon S, Qin D, Manning M et al (eds) Climate change 2007: the physical science basis. Contribution of Working Group I to the Fourth Assessment Report of the Intergovernmental Panel on Climate Change. Cambridge University Press, Cambridge, United Kingdom and New York, NY, USA Usbeck T, Wohlgemuth T, Dobbertin M, Pfister C, Burgi A, Rebetez
M (2010a) Increasing storm damage to forests in Switzerland from 1858 to 2007. Agric For Meteorol 150(1):47–55. doi:10.1016/j.agrformet.2009.08.010
Usbeck T, Wohlgemuth T, Pfister C, Volz R, Beniston M (2010b) Wind speed measurements and forest damage in Canton Zurich (Central Europe) from 1891 to winter 2007. Int J Climat 30 (3):347–358. doi:10.1002/joc.1895
Vanomsen P (2006) Der Einfluss der Durchforstung auf die Verankerung der Fichte hinsichtlich ihrer Sturmresistenz, vol 16532. Diss. ETH. Eidgenössische Technische Hochschule Zürich, Zürich
WSL, BUWAL (eds) (2001) Lothar. Der Orkan 1999. Ereignisanalyse. Eidg. Forschungsanstalt WSL, Bundesamt für Wald, Schnee und Landschaft BUWAL, Birmensdorf, Bern
Xi WM, Peet RK, Decoster JK, Urban DL (2008) Tree damage risk factors associated with large, infrequent wind disturbances of Carolina forests. Forestry 81(3):317–334
Yoshida T, Noguchi M (2009) Vulnerability to strong winds for major tree species in a northern Japanese mixed forest: analyses of historical data. Ecol Res 24(4):909–919. doi: 10.1007/s11284f-008-0566-1