Simultaneous Measurement
of the Trace Elements Al, As, B,
Be, Cd, Co, Cu, Fe, Li, Mn, Mo,
Ni, Rb, Se, Sr, and Zn in Human
Serum and Their Reference
Ranges by ICP-MS
R. FORRER,*
,1K. GAUTSCHI,
2AND
H. LUTZ
11
Clinical Laboratory, Department of Internal Vetinary Medicine,
University of Zürich, Winterthurerstrasse 260, 8057 Zürich,
Switzerland; and
2Centre for Laboratory Medicine,
State Hospital, Aarau, AG 5001, Switzerland
Received February 14, 2000; Revised July 13, 2000;Accepted July 21, 2000
ABSTRACT
The goal of this article was to establish reference ranges of the concentration of trace elements in human serum and to compare these results with those reported by other authors. We describe the sample preparation and measurement conditions that allow the rapid, precise, and accurate determination of Al, As, B, Be, Cd, Co, Cu, Fe, Li, Mn, Mo, Ni, Rb, Se, Sr, and Zn in human serum samples (n = 110) by inductively coupled plasma–mass spectrometry (ICP-MS). Accu-racy and precision were determined by analyzing three reconstituted reference serum samples by comparison with other methods and by the standard addition procedure.
The advantages of the ICP-MS method include short time of analysis of the elements mentioned, low detection limit, high preci-sion, and high accuracy. Disadventages include a high risk of conta-mination due to the presence of some of the elements of interest in the environment, the relatively delicate sample handling, and the high cost of the equipment.
0163–4984/01/8001–0077 $14.25
Index Entries: Reference ranges; trace elements; human serum; ICP-MS; GF-AAS; aluminum; arsenium; boron; beryllium; cadmium; cobalt; copper; iron; lithium; manganese; molybdenum; nickel; rubid-ium; selenrubid-ium; strontrubid-ium; zinc.
INTRODUCTION
The measurement of trace elements is increasingly attracting interest from physicians because deviations in trace element uptake and/or metabolism are known to be related to certain disfunctions. Some trace elements form part of enzymes [e.g., Se in glutathionperoxidase (1) and copper in tyrosinase, ascorbic acid oxidase, cytochrome oxidase, uricase, and superoxid dismutase]. Others are involved in the synthesis of hor-mones [e.g., Se in the formation of trijodothyronin (1,2)]. Some trace ele-ments are known to be associated with certain diseases if they are present in the body in abnormally low concentrations: Hemolytic anemias can develop in Zn deficiency and some form of coronary heart diseases are associated with Cu and Zn deficiency (3). Molybdenum is the coenzyme of different enzymes (xanthine oxidase, aldehyde oxidase, and sulfite oxi-dase) involved in the detoxification of xenobiotic compounds (4). Sele-nium and zinc are potent antioxidants involved in cellular defense against free radicals (5).
On the other hand, pathologically high levels of trace elements are also of importance: Morbus Wilson is characterized by abnormally high concentrations of Cu in the liver and hemochromatosis by accumulation of Fe in several tissues. Several trace elements have been documented as being involved in blood pressure control (hypertension: Cd, Cr defi-ciency, Mg, etc.) (6).
Some trace elements may lead to intoxications in humans and ani-mals if ingested in high concentrations, such as cadmium, thalium, lead, zinc, selenium, and copper.
With the advent of newer technologies like inductively coupled plasma– mass spectrometry (ICP-MS) several of the medically interesting ele-ments can now be quantitated precisely and accurately simultaneously. It was the goal of the present article to establish reference ranges of several trace elements using a simple procedure for the preparation of serum samples that allows the simultaneous measurement of different elements by ICP-MS.
MATERIAL AND METHODS
Sample Preparation and Reagents
One hundred ten native blood samples were collected from humans of different ages and both sexes directly into vacutainer trace elements
tubes (Vacutainer System Europe B.P. No. 37-38241 Meylan Cedex-France, Becton Dickinson). Immediately after coagulation, the samples were centrifuged at 2000g and the serum was stored at −20°C until
analy-sis. For the separation of the serum of the blood sample, serum–plasma separators were used (Sure-Sep. II Jr. Organon Teknika Corporation, Durham, NC, USA). The serum samples where diluted 1 to 10 with 10% acetic acid with 0.1% Triton X-100, and rhodium and germanium were added as internal standards to correct the matrix-induced ion signal fluc-tuations and instrumental drifts (20 µg/L).
Standard and Reference Sera
Freeze-dried reference sera, normal and elevated level, from UTAK Lab-oratories Inc. (Valencia, CA, USA) and Seronorm (Nycomed Pharma, Oslo, Norway) were used for method validation. Deionized water (18 M⍀/cm2) was prepared by Elgastat Maxima (Elga Ltd., Wycombe, Bucks, UK) and was used for sample dilution and standard preparation. Acetic acid (Microselect, Art. # 45726, Fluka AG, Buchs, Switzerland) was used to acidify standards and samples. Merck ICP-MS multielement standard solution (Merck VI, Darmstadt, Germany) served as the external calibra-tion. Rhodium and germanium (1000 µg/mL in 20% HCl (Johnson Matthey GmbH, Karlsruhe, Germany) were the internal standards throughout all measurements. Additionally, for standard additions arsenic plasma stan-dard solution (Art. # 013836), Boron ICP stanstan-dard solution in 1% NH4OH (Art. # 22802), copper ICP standard solution in 5% HNO3(Art. # 22808), beryllium ICP standard solution in 5% HNO3 (Art. # 13848) (Specpure, Alfa Aesat, Johnson Matthey GmbH, Karlsruhe, Germany), and lithium atomic spectroscopy standard solution (Art. # 62373) (Fluka, Buchs, Switzerland). Triton X-100 (Sigma, Art. # 90002-93-1) was added as a detergent to all measured solutions at a concentration of 0.1‰ v/v. For sample preparation, 13-mL polypropylene tubes with screw caps were used (Sarstedt AG, Sevelen, Switzerland, Article # 46.390.001). Before use, they were cleaned with citric acid (Merck KGaA, Darmstadt, Germany, Art. # 1.00244.1000) at pH 2 and then with Extran (sodium hydroxide solu-tion) at pH 10 (MA 01 alcaline; Art. # 1.07555, Merck KGaA, Darmstadt, Germany) and then rinsed with deionized water (18 M⍀/cm2).
Instrumentation and Conditions
of Measurement
The ICP-MS measurements were done using a Varian UltraMass™ ICP-MS system (Varian Optical Spectroscopy Instruments, Melbourne, Aus-tralia). The plasma source was 99.998% argon (Carbagas, Bern, Switzerland). The following elements (nuclide used) were measured with the ICP-MS: Al (27), As (75), B (11), Be (9), Cd (111), Co (59), Cu (65), Fe (57), Li (7), Mn (55), Mo (95), Ni (60), Rb (85), Se (77/82), Sr (88), and Zn (66).
Acetic acid as a carbon source at the optimum concentration of 10% v/v was used for matrix matching for all elements measured: the calibration, matrix matching, and instrument conditions as described in refs. 7and 8.
Statistical Analysis
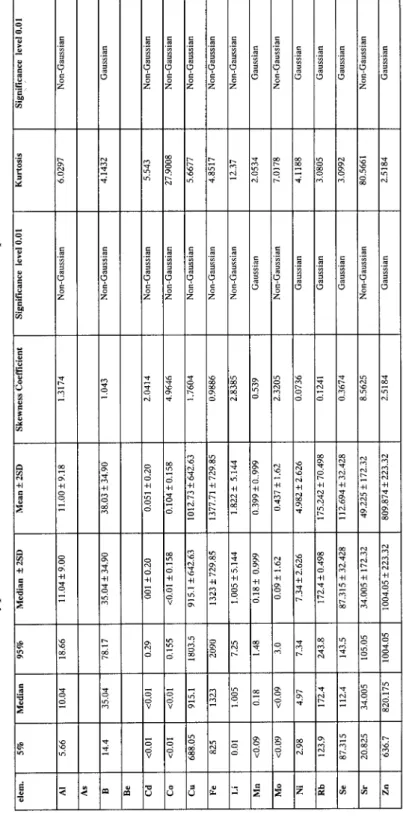
All data were statistically evaluated using the Microsoft Excel com-puter program with the statistics add-in Astute (DDU Software, The Uni-versity of Leeds, Old Medical School, Leeds, UK). The box-and-whiskers plots were used to define the 5%, 50%, and 95% quantiles for the differ-ent elemdiffer-ents (9). The correlation between the atomic absorption and the ICP-MS methods was studied by a regression analysis according to Pear-son and Harley (10).To determine whether or not the element studied is normally distributed in the population, the data were analyzed by nor-mal probability plotting (11,12). The skewness and kurtosis coefficients and their significance levels of 0.01 (13) are summarized in Table 7. For the comparison of the median values of the copper in males and females, the Wilcoxon–Mann–Whitney U-test was used (14).
RESULTS
Calibration
The calibration was performed using a blank and four standard con-centrations (0, 2, 5, 10, and 20 µg/L) for each element measured.
Linearity
The linear range for the elements tested was determined using a porcine serum sample that was spiked with 500 µg/L of the elements Al, Cd, Co, Cu, Li, Mn, Mo, Ni, Rb, and Sr and with 5000 µg/L of the ele-ments As, B, Be, Fe, Se, and Zn. The spiked sera were diluted using the identical nonspiked serum sample. For all elements, the measurements were highly linear up to the 500 and 5000 µg/L spiked value, respec-tively (data not shown).
Accuracy and Precision
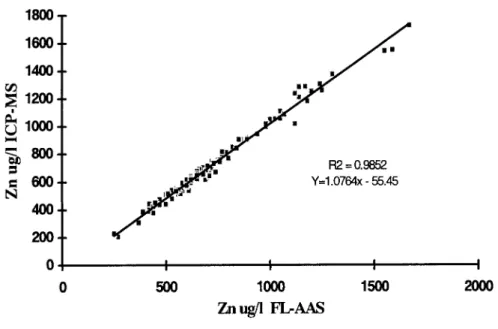
The accuracy (validation) of methods was determined by means of the analysis of three control reference sera (UTAK, normal and elevated level; Nycomed, Seronorm). The results are shown in Tables 1–3. The precisions are displayed as CVs (coefficients of variation). In addition, the concentration of the elements Al and Se was also determined by graphite furnace–atomic absorption spectrometry (GF-AAS) and flame atomic absorption spectrometry (FL-AAS) for Cu and Zn. The correlation of results obtained by ICP-MS and AAS were calculated. A typical linear
relationship correlation is shown in Fig. 1 for Zn. There was generally a close correlation between the two methods with coefficients between 0.96 and 0.99. The accuracy of the method for the analysis of manganese, arsenic, cobalt, nickel, molybdenum, and cadmium was performed using the method of standard addition. The recovery of the standard added to each determined element was 98 ± 16%. The precision within series and from day to day, the standard deviations, and the limits of detection are summarized in Table 4. The limit of detection is defined as the mean value of the blank increased by three standard of deviations.
Reference Ranges
The reference ranges for the 16 elements studied are summarized in Table 5. For copper, it was found that the reference values for males and
Table 1
Comparison of Results Measured by ICP-MS with Those Provided by the Manufacturer for Different Elements in a Normal Control
Reference Serum (UTAK, Normal Level, Batch 9430)
Note: Results are given in µg/L. The coefficient of variation (CV) of five in-dividually prepared sample aliquots are given.
*n.d. = not detected.
Table 2
Comparison of Results Measured by ICP-MS with Those Provided by the Manufacturer for Different Elements in a High-Level Control
Reference Serum (UTAK, Elevated Level, Batch 9429)
Note: Results are given in µg/L. The coefficient of variation (CV) of five in-dividually prepared sample aliquots are given.
*n.d. = not detected. 1)Provided by the manufacturer.
Table 3
Comparison of Results Measured by ICP-MS with Those Provided by the Manufacturer for Different Elements in Nycomed Seronorm Trace
Elements Control Serum (Batch 010017)
Note: Results are given in µg/L. The coefficient of variation (CV) of five individually prepared sample aliquots are given.
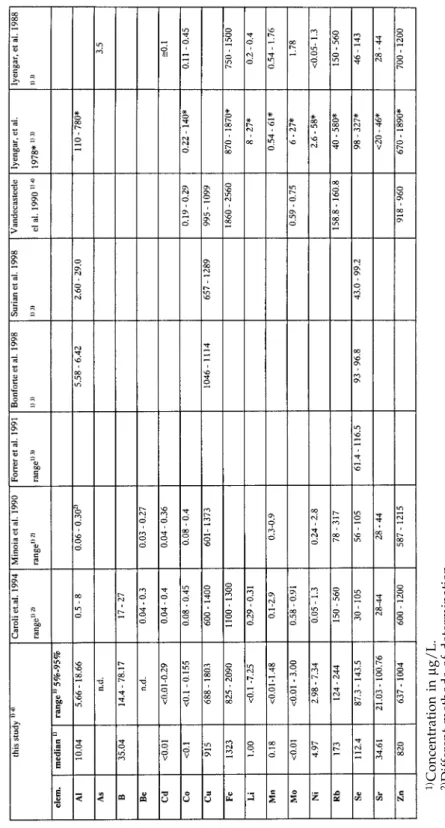
females differed significantly (p < 0.0014, Wilcoxon–Mann–Whitney U test). Therefore, the ranges for both males and females are given separately. In Table 6 reference ranges published by different research groups (15–19) are compiled. In Table 7, the type of distribution for the different elements in the population is given.
DISCUSSION
The ICP-MS technology is a very elegant procedure for assessing various elements simultaneously. The simultaneous measurement of dif-ferent analytes allows for one sample preparation; at the same time, the probability of cross-contamination is minimal. The elaboration of assay conditions for the 16 elements described in this report proved to be cum-bersome and time-consuming. However, after all conditions had been established, measurements became very efficient: on average, 20 samples of each of the 16 analytes can be measured per hour without the need for extended sample preparation.
The major problems with this method arise from background inter-ferences originating from plasma gases, gases entrapped in the plasma, or traces originating from the sample solvent. In addition, spectral inter-ferences by other elements and several isotopic combinations may be a disadvantage. The system has to be adjusted to minimize the formation of polyatomics, oxides, and doubly-charged ions. Hsiung et al. describe the major interferences in biological samples (20).
In the present study, the accuracy for the different elements was determined by analyzing reference control sera, by comparison of ICP-MS results with those obtained by flame-AAS and GF-AAS and, in some cases, by spiking of samples with known amounts of pure elements. The accuracy observed was found to be quite satisfactory. Seven elements detected in reference control sera fell well within the acceptable range provided by the manufacturer (Tables 1–3); the accuracy for the remain-ing five elements was demonstrated by standard addition methodology. The precision (CV) found for within-series conditions on average was 1.70% with a maximum CV for B of 4.67%. As expected, the day-to-day precision was somewhat lower. To compare the reference ranges deter-mined in the present study in human sera with those found by other
84 Forrer, Gautschi, and Lutz
Table 4
Precision Within-Series and from Day-to-Day, Standard Deviation, and Limits of Detection of the Element Measured
authors is difficult. There is a lack of coherence in the levels of trace ele-ments found by various laboratories. One possible explanation for the different ranges of trace elements comes from the fact that with higher analytical sensitivity, the presence of contaminants becomes increasingly important. This is especially the case with elements that are physiologi-cally present at very low concentrations, such as chromium, manganese, nickel, vanadium, and aluminum.
Contamination by extraneous metals originating from the environ-ment is particularly important in the case of aluminum, chromium, and
Table 5
Ranges of 16 Trace Elements in Sera Collected from 110 Healthy Human Donors
*n.d. = not detected.
1)The ranges are given as mean ± SD.
2)To display the actual distribution—in the form of the 5th, 50th, and 95th
percentile.
3)n = 39. 4)n = 71.
86 Forrer, Gautschi, and Lutz
T
able 6
Comparison of the Ranges Established in This Work with Values in the Literatur
e
1)Concentration in
µg/L.
2)Dif
fer
ent methods of determination.
T
able 7
T
ype of Distribution of the Dif
fer
manganese, which are common contaminants of airborne dust and the devices used (21–24). In view of this, sampling conditions become crucial for the correct measurement of trace elements. Important items for cor-rect sample collection are (I) use of the corcor-rect tubes and/or corcor-rect de-contamination methods of containers, (II) sampling equipment (needles and catheters, syringes, anticoagulants, centrifuges, and decantation), and (III) purity of the reagents.
In their article, Pineau et al. describe the possibilities for avoiding contaminations from collection, handling, and preparation of the sample under general conditions of a clean laboratory (23). Another important aspect for correct measurement is the selection of the appropriate mate-rial (e.g., serum vs plasma vs whole blood vs biopsies). Another expla-nation for discrepant reference ranges may reside in the use of different measurement principles. Even if the accurancy of two methods is identi-cal when normal sera are tested, differences may be found as a result of different matrix effects such as variation in the protein concentration. A further explanation for differences in reference ranges may be found in different statistical procedures used by the authors. Unfortunately, many of the elements are not normally distributed, as shown in this study. In many articles, the reference ranges for each analyte are given as means ± SD as the observed range without specification (15,16,25,26). Ranges determined by this approach are only correct if the analyte stud-ied is normally distributed. By calculating the 5th and 95th quantiles using the box-and-whiskers plot technique, correct reference ranges can be calculated independent of the type of distribution (9).
There are a few specific possibilities of matrix effects that may inter-fere with ICP-MS methods. Vandecasteele et al. (27) and other authors discussed that the results obtained for elements with masses < 82 are, in general, unsatisfactory. The explanation given for this observation was the limited resolution of the quadrupole mass spectrometers used for ICP-MS. A number of spectroscopic interferences have been reported
(28). In elements with masses of less than 82, interferences are the result
of the formation of polyatomics in the quadrupole caused by isotopes of elements other than the analytes or by polyatomic species with the same nominal m/z value as the analyte isotope (27,29). The authors stated that, without special sample pretreatment (in order to remove or reduce sources of polyatomic interferences) and using conventional pneumatic nebulization for sample introduction, the determination of Al, As, Cr, Mn, Ni, and Se in serum can not be correctly calculated, as the apparent concentrations significantly exceed the real concentrations. The combina-tion of chlorine introduced via the sample with argon from the plasma can give rise to the formation of polyatomic ions, which might interfere with the measurement of selenium isotopes (7). Furthermore, the intro-duction of carbon-derived polyatomics present in the sample are known to lead to an increased background in the measurement of the element with a m/z < 82 (30). The addition of carbon (as methanol, propan-2-ol,
glycerol, and others) in combination with increased plasma power input enhances the signal-to-noise ratio for elements with a m/z < 82 in induc-tively coupled plasma–mass spectrometry (7,8). The addition of an opti-mal concentration of carbon causes an increase in the formation of CCl+, which is assumed to compete with the formation of ArCl+ and thereby causes a reduced signal for this type of interferences.
In ICP-MS, the method of standard addition is primarily used to overcome matrix-induced signal enhancement or suppression, but this method is impractical for the analysis of samples with a limited sample volume as is usually the case with clinical sample material. External cal-ibration with matrix matching of the blank and the external calcal-ibration solution for the organic matter is the method of choice for overcoming matrix-induced effects on signal intensities. The addition of acetic acid with a concentration optimum of 10% (v/v) used for matrix matching in clinical samples was found to lead to signal enhancement for high elec-tron volt elements such as Se and As (8).
With respect to the correct measurement of different elements by ICP-MS, the following comments can be made. Aluminum has to be measured shortly after dilution. Otherwise, an increase of the Al signal was seen. Probably Al is released from the plastic container and/or con-tamination of the control sera from the pipet tips. Our values are in agreement with those of Caroli et al. (15). In this study, no As was detected in the sera of healthy donors. However, elevated levels present in serum would have been detected, as can be concluded from samples spiked with 1000 µg/L and diluted down to 3 µg/L As (data not shown). Boron is important for optimal calcium and, thus, bone metabolism (31). The boron concentration ranges in serum found in this study are higher than the values published elsewhere (15,32). The interpretation of the concentrations of boron has to be made very carefully because the tailing effect of the adjacent 12C mass peak which can lead to higher values, and, on the other hand, it has to be considered that the measurements were made with a glass torch and contamination of boron from this glass is possible. Also, it is to be considered that the PVC transfer tubing (tubing from the spray chamber to the torch) tends to readily hold onto boron, producing very long rinse times and reduced signal (carryover from one sample to the next). Beryllium was not detected under the measurement conditions in the sera of healthy donors described here. With the addi-tion of pure Be to porcine serum with a low level of this element, it could be shown that levels up to 2 µg/L would have been detected (data not shown). The Cd level is increased in smokers, as tobacco is rich in Cd
(33,34). In this study, we did not record whether blood donors were
smokers. The values found in our study are comparable to the values described by Minoia et al. (16) and Caroli et al. (15). The values men-tioned for cobalt by Caroli et al. and Minoia et al. are higher than the val-ues found in this study (15). The tendency to higher valval-ues for female subjects are confirmed by Underwood (35). These authors showed that
the Cu values increased during pregnancy and when oral contraceptives were taken. Iron, like chromium, is one of the most difficult elements to determine with ICP-MS. Many interferences have to be considered when Fe is analyzed. In addition, Fe is ubiquitous in the laboratory, which may lead to exogenous contaminations. Even purified water used for dilu-tions contains this element in small amounts and has to be considered in the blank. The iron determination in serum with ICP-MS is the total iron. This includes the transferrin iron and the hemoglobin iron, whereas the photometric method measures only the transferrin iron. The reference values for Fe determined in this study with ICP-MS are some-what higher than those published elsewhere (15). Vanhoe and cowork-ers (45) mentioned the difficulties for the determination of iron because for all four isotopes significant interferences occur. As in the case of Cu, the total protein concentration plays an important role for interferences because of the variable content of carbon. Lithium plays an important role in the medical field as a treatment for manic depressive illnesses. The doses required for effective therapy are relatively high and may be close to the levels at which the element becomes toxic. The results for that element have to be interpreted with the proviso that it is known that Li in solution has a strong affinity to glass and plastic surfaces, and, therefore, memory effects are an important consideration during an ana-lytical run (36). Therefore, our values may by slightly higher than the true values of Li present in the samples. The reference ranges for man-ganese established in this study agree with the values found by Caroli et al. (15). The ranges for molybdenum described here are slightly higher than the published values (15,37). Nickel seems to be related with vitamin B12 and methionin metabolism (31). Our values ranging from 2.98 to 7.34 µg/L are much higher than the ranges indicated by Caroli et al. and Minoia et al. No firm explanation can be offered for this dis-crepancy. The interpretation of the results have to be made carefully because in the equipment used, the sampler and skimer cones are man-ufactured using Ni. The reference range for rubidium determined in this study is similar to those described by Woittiez (38). The selenium refer-ence values determined in this study were found to be higher than those established earlier by GF-AAS (17). It is related to their content in the diet, as described by Sieber et al. (39). The range established corresponds to that described by different authors (17–19,40,41) and others. Stron-tium could adversely affect bone metabolism (42), but it should also be remembered that it has even been proposed as an effective agent against osteoporosis (43). The ranges of Sr in this study are more extended than that found by other authors (25,34). For zinc, we found an excellent cor-relation with the FL-AAS method. The Zn levels are subject to strong variations caused by stress, medication, fasting, or pregnancy (44). The reference range found in this study corresponds to that mentioned in the literature (15).
CONCLUSIONS
Multielement determinations in clinical samples such as serum can be performed directly and rapidly with ICP-MS. A great number of spec-tral interferences were encountered in the analysis of this biological materials. Careful sample preparation methods have to be established especially for Se, Al, Mn, Fe, and Zn if external calibration procedures are to be used. Matrix matching is essential when dealing with high electron volt elements like Se and As in biological samples or any sample matrix containing significant amounts of organic matter. Acetic acid was chosen for this technique (8). When reference ranges are used to evaluate con-centrations of various analytes, the respective reference ranges have to be considered.
REFERENCES
1. G. N. Schrauzer, Selen, Neue Entwicklung aus Biologie, Biochemie und Medizin, Johann Ambrosius Barth Verlag, Heidelberg, (1999).
2. J. Versieck and R. Cornelis, Trace elements in human plasma or serum, CRC, Boca Raton, FL (1989).
3. M. Krachler, M. Lindschinger, B. Eber, N. Watzinger, and S. Wallner, Trace elements in coronary heart disease: impact of intensified lifestyle modification, Biol. Trace Ele-ment Res.60,175 (1997).
4. X. M. Luo, H. J. Wei, and S. P. Yang, Inhibitory effects of molybdenum on esophageal
and forestomach carcinogenesis in rats, J. Natl. Cancer Inst. 71, 75 (1983).
5. M. A. Alfieri, F. Y. Leung, and D. M. Grace, Selenium and zinc levels in surgical
patients receiving total parenteral nutrition, Biol. Trace Element Res. 61, 33 (1998).
6. F. L. Hubert, Effects of elements on blood pressure, Biol. Trace Element Res. 58, 1
(1997).
7. E. H. Larsen and S. Sturup, Carbon-enhanced inductively coupled plasma mass
spec-trometric detection of arsenic and selenium and its application to arsenic speciation,
J. Anal. Atomic Spectrom. 9, 1099 (1994).
8. R. Forrer, K. Gautschi, A. Stroh, and H. Lutz, Direct determination of selenium and
other trace elements in serum samples by ICP-MS, J. Trace Elements Med. Biol. 12, 240 (1998).
9. E. Eggenberger and R. Thun, Eine graphische Methode zur Darstellung von
Mess-werten, Schweiz. Arch. Tierheilk. 126, 199 (1984).
10. E. S. Pearson and H. O. Hartley, Biometrica Tables for Statisticians, Cambridge (1966). 11. M. J. Gardner and D. G. Altman, Statistics with Confidence: Confidence Intervals and
Sta-tistical Guidelines. British Medical Association, London (1989).
12. D. G. Altman, Practical Statistics for Medical Research, Chapman & Hall, London (1991). 13. R. Jones and B. Payne, Clinical Investigation and Statistics in Laboratory Medicine, ACB
Venture Publications (1997).
14. L. Sachs, Angewandte Statistik, Springer Verlag, Berlin (1984).
15. S. Caroli, A. Alimonti, E. Coni, F. Petrucci, O. Senofonte, and N. Violante, The
assess-ment of reference values for eleassess-ments in human biological tissues and fluids: a sys-tematic review, Crit. Rev. Anal. Chem. 24, 363 (1994).
16. C. Minoia, E. Sabbioni, P. Apostoli, R. Pietra, L. Pozzoli, M. Gallorini, et al., Trace
ele-ment reference values in tissues from inhabitants of the European community, I. A study of 46 elements in urine, blood and serum of Italian subjects, Sci. Total Environ. 95,89 (1990).
17. R. Forrer, K. Gautschi, and H. Lutz, Comparative determination of selenium in the serum of various animal species and humans by means of electrothermal atomic absorption spectrometry, J. Trace Elements Electrolytes Health Dis. 5, 101 (1991). 18. G. Bonforte, M. Surian, B. Dozio, R. Scanziani, A. Baj, S. Colombo, et al., Plasma
or whole blood concentrations of trace elements in patients treated by haemo-diafiltration with on-line prepared substitution fluid, Nephrol. Dial. Transplant. 13, 29 (1998).
19. M. Surian, G. Bonforte, R. Scanziani, B. Dozio, A. Baj, L. Della Vedova, et al., Trace elements and micropollutant anions in the dialysis and reinfusion fluid prepared on-line for haemodiafiltration, Nephrol. Dial. Transplant. 13, 24 (1998).
20. C. S. Hsiung, J. D. Andrade, R. Costa, and O. A. Ash, Minimizing interferences in the quantitative multielement analysis of trace elements in biological fluids by induc-tively coupled plasma mass spectrometry, Clin. Chem. 43, 2303 (1997).
21. J. D. Kopple, M. E. Swendseid, M. A. Holliday, A. C. Alfrey, and P. F. Gulyassy, Rec-ommendations for nutritional evaluation of patients on chronic dialysis, Kidney Int. Supplement, 2, 249 (1975).
22. J. Ahlmen, Some pollutants of dialysis water, Lakartidningen, 77, 2431 (1980). 23. A. Pineau, O. Guillard, P. Chappuis, J. Arnaud, and R. Zawislak, Sampling conditions
for biological fluids for trace elements monitoring in hospital patients: a critical approach, Crit. Rev. Clin. Lab. Sci. 30, 203 (1993).
24. D. Knopp, G. Unger, and R. Niessner, Organic trace element pollution in water—a potential health risk for long-term dialysis patients, Zentralblatt Hyg. Umweltmed. 195, 509 (1994).
25. V. Iyengar and J. Woittiez, Trace elements in human clinical specimens: evaluation of literature data to identify reference values, Clin. Chem., 34, 474 (1988).
26. M. Krachler, G. Wirnsberger, and K. J. Irgolic, Trace element status of hemodialyzed patients, Biol. Trace Element Res. 58, 209 (1997).
27. C. Vandecasteele, H. Vanhoe, R. Dams, and J. Versieck, Determination of trace ele-ments in human serum by inductively coupled plasma–mass spectrometry. Compar-ison with nuclear analytical techniques, Biol. Trace Element Res. 26–27, 553 (1990). 28. E. H. Evans and J. J. Giglio, Anal. Atomic Spectrom. 8, 1 (1993).
29. S. H. Tan and G. Horlick, Appl. Sperctrosc. 40, 445 (1986). 30. R. C. Hutton, Anal. Atomic Spectrom. 1, 259 (1986).
31. F. H. Nielsen, New Essential Trace Elements for the Life Sciences, Biol. Trace Element Res. 26–27, 599 (1990).
32. W. B. Clarke, M. Koekebakker, and R. D. Barr, Analysis of ultratrace lithium and boron by neutron activation analysis and mass spectrometric measurement of helium-3 and helium-4, Appl. Radiat. Isot. 38, 735 (1987).
33. L. Friberg and M. Vahter, Assesment of exposure to lead and cadmium through bio-logical monitoring: results of UNEP/WHO global study, Environ. Res. 30, 95 (1980). 34. G. V. Iyengar, Radiochemical separations for inorganic trace elements in some
bio-logical reference materials, food, tissues, and body fluids, J. Radioanal. Nucl. Chem.
110,503 (1987).
35. E. J. Underwood, Trace Elements in Human and Animal Nutrition, 4th ed., Academic, New York (1977).
36. K. E. Jarvis, A. L. Gray, and R. S. Houk, Handbook of Inductively Coupled Plasma Mass Spectrometry, Blackie Academic & Professional Press, New York, eds.: A. R. Date and A. L. Gray (1994).
37. J. Versieck, J. Hoste, F. Barbier, L. Vanballenberghe, J. De Rudder, and R. Cornelis, Determination of molybdenum in human serum by neutron activation analysis, Clin. Chim. Acta 87, 135 (1978).
38. J. R. W. Woittiez, Elemental analysis of human serum and serum protein fractions by thermal neutron activation, Kursivc Dissertation, University of Amsterdam (1983). 39. R. Sieber, M. Haldimann, and B. Zimmerli, Se-Status der SchweizerInnen und Beitrag
der Landwirtschaft, Agrarforschung, 6, 441 (1999).
40. M. Haldimann, T. Y. Venner, and B. Zimmerli, Determination of selenium in the serum of healthy Swiss adults and correlation to dietary intake, J. Trace Elements Med. Biol. 10, 31 (1996).
41. G. Morisi and M. Patriarca, Variations in the serum levels of Se according to age and sex in a sample of Italian population, Acta Chim. Hung. 128, 581 (1991).
42. J. Ondahl and H. DeLuca, Strontium induced rickets: metabolic basis, Science 192, 60 (1976).
43. M. L. Brandi, New treatment strategies: ipriflavone, strontium, vitamin D metabolites and analogs, Am. J. Med. 95(Suppl. 5a), 69S (1993).
44. G. V. Iyengar, Concentrations of 15 trace elements in some selected adult human tis-sues and body fluids of chemical interest from several countries: results from a pilot study for the establishment of reference values, Report of the Nuclear Research Center (1985).