ABSTRACT. Background and aims: The present study examines the usefulness of a newly developed instrument, the Martin and Park Environmental De-mands (MPED) Questionnaire, to measure the level of self-reported environmental demands of day-to-day events faced by adults aged 35 to 84 years, partic-ularly as these demands influence forgetfulness in taking medications. Methods: The MPED has two scales including Busyness, which addresses the den-sity or pace of daily events to which an individual at-tends; and Routine, addressing the predictability or routinization of events independent of density. The MPED was administered to a sample of 121 rheuma-toid arthritis patients, along with a baseline assess-ment battery measuring age, education, employ-ment status, household size and other factors that might influence self-perception of Busyness and Routine. Results: The scale showed good internal consistency and external validity. Higher levels of en-vironmental demand were negatively correlated with age and positively correlated with employment, household size and medication-taking errors. There was a significant independent association between Busyness and adherence errors even after controlling for the effects of these sociodemographic variables. Conclusions: The MPED is recommended when trying to assess the general daily level of environ-mental demands.
(Aging Clin Exp Res 2003; 15: 77-82)
©2003, Editrice Kurtis
INTRODUCTION
The focus of the present study is on the development of a simple instrument to assess interindividual differ-ences in the interface between persons and the
envi-ronmental demands of day-to-day events with which they cope. This is an area that has been insufficiently studied in different age groups spanning the course of life, i.e., in life span samples, although it has been recognized that differentially stimulating environments might exist at different times in the life course (1). These environmental characteristics could, in turn, in-fluence further cognitive functioning in two ways. Per-haps individuals who experience a stimulating and di-verse environment will function better cognitively in late adulthood (2-4), but it is also possible that chronic overstimulation and overcommitment might result in so many immediate demands on cognitive resources that such high levels of engagement might result in consid-erable everyday forgetfulness (5).
It is still an empirical question if self-reports of being busy are the result of an interaction between subjective perceptions and particular properties of the environ-ment, a personality trait which tends to attribute de-mand to any environment, or a reduced ability to cope with everyday tasks leading to an increased sense of de-mand from the environment. It is also conceivable that there might be persons who objectively are very busy according to normative standards, but who are so well organized that they would deny being busy. However, we recently observed that self-reports of busyness were the single best predictor of the everyday memo-ry task of remembering to take medications (6). We found that although there were substantial age-related declines in speed and working memory in our life span sample, the older adults nevertheless showed su-perior medication adherence compared to middle-aged adults. The middle-middle-aged individuals reported be-ing busier than older adults, and this contextual variable was more important in predicting adherence than
cog-The Martin and Park Environmental Demands
(MPED) Questionnaire: Psychometric properties
of a brief instrument to measure self-reported
environmental demands
Mike Martin1and Denise C. Park2
1Department of Gerontopsychology, University of Zürich, Zürich, Switzerland, 2Beckman Institute,
University of Illinois at Urbana-Champaign, Urbana, Illinois, USA
Key words: Coping skills, environmental stimulation, life span, medication adherence, memory task, older adults, self-report.
Correspondence: M. Martin, Dept. of Gerontopsychology, University of Zürich, Schaffhauserstrasse 15, CH-8006 Zürich, Switzerland. E-mail: [email protected]
nitive function or medication beliefs. Thus, it may be important to measure and possibly control the level of environmental demands in cognitive aging studies, particularly when one is attempting to study every-day memory.
At present, there are four main instruments that assess some aspect of environmental demands or en-vironmental complexity. All assume that enen-vironmental demands may influence individual performance or be-havior even after controlling for the influence of indi-vidual differences in time management or coping skills. First, there are measures attempting to indicate general life complexity (7, 8). Complexity is indicated by a combination of variables measuring, among others, social status, dissatisfaction with life, noise in the en-vironment, and family dissolution. Although the measure is related to maintainance of cognitive performance (7), the wide range of variables included makes this instru-ment time-consuming to administer and difficult to terpret. Second, assuming that major life disruptions in-dicate important contextual moderators of function, lists of life events (e.g., 9, 10) are used to indicate environmental demands. Life events have been related to outcomes like depression and physical disorders, but by capturing rather outstanding and exceptional de-mands, they seem less useful in indicating the “normal” range of everyday environmental demands. Third, as-suming that everyday, minor disruptions indicate envi-ronmental demands, measures of daily hassles (11, 12) have been used. The focus of these measures typ-ically is on smaller events that are bothersome or in some way negative. Fourth, a number of indirect mea-sures of environmental demands are conceivable, i.e., social network size or perceived financial, social or environmental stress (13), but these measures are not very fine-grained, and their relation to cognitive func-tioning across the life course is unclear. Although these direct and indirect measures of demand are useful, life might be demanding in other ways, i.e., when working in a stimulating, creative job with a high level of inde-pendent decision-making and adequate financial re-wards. Hence, a general measure of environmental demands should include different demand aspects. Overall, what is lacking is a short, economic, and reli-able measure to assess individual differences in the level of self-reported environmental demands, focusing on a wide range of different contextual aspects of dai-ly living.
As an alternative to existing measures, we developed the Martin and Park Environmental Demands (MPED) Questionnaire, an instrument to measure self-reports of how busy people are or how many environmental de-mands they report. We hypothesized that there would be two components to environmental demands: Busy-ness and Routine. We assumed these would be
inde-pendent factors indicating the density of obligations (busyness) vs the amount of daily routines guiding be-havior across a typical day (predictability of events). Busyness items were designed to measure the density of events and the amount of time available in this context to perform tasks. Routine items were designed to in-dicate how frequently individuals try to follow a regular routine in their behaviors in everyday life. As an ex-ample, a physician who sees a patient every 15 minutes might be intensely busy, but highly routinized, in his/her day. In contrast, a seismologist who waits for earth-quakes to occur, might be low on the busyness scale, but have little routine in his/her daily life.
In the present study, we established the measurement properties of this activity scale. Second, we related the measure to a number of external criteria. We expected that as older adults have fewer job-related obligations and a smaller social network, there should be a negative cor-relation between environmental complexity and age, and a positive correlation between establishing rou-tines and age. Third, we examined if larger social net-works are positively related to environmental demands. Finally, we tested if a lower level of self-reported envi-ronmental demand, but not age, was related to correct medication-taking behaviors, as suggested by earlier work (6). We should note that we developed the MPED for use in a prior study (6), and reported its relationship to medication adherence embedded within a complex structural equation model. The psychometric properties of the MPED, however, as well as the questions that comprise the instrument have not been published, and this is the focus of the present analysis.
METHODS Study design
Data for this study came from a prior study of med-ication adherence in rheumatoid arthritis patients (6). A direct observation or survey approach was used to study predictors of non-adherence. The comprehensive baseline assessment included, among other things, de-mographic information, health measures, frequency of social contacts, task/role involvement, obligations, and the MPED. In the following four weeks, medication errors were measured using MEMS technology (medi-cation bottles that measure exactly when medi(medi-cations are taken out) for all prescribed medications.
Sample
A total of 121 community-dwelling individuals (100 women and 21 men), aged 34 to 84 (mean 56.07, SD 12.74), all participants of a medication adherence study for rheumatoid arthritis patients (6), participated in the study. Participants were recruited from newspa-per advertisements, posters placed in physicians’ offices, and patient organizations. The participants were well
educated; 96% had completed high school and 66% had completed some college. All patients had at least an eighth grade education and 20/30 corrected vision. In-dividuals who had been hospitalized in the past six months or who reported receiving assistance managing their medications were excluded. There were no sig-nificant differences across five age groups (34-44, 45-54, 55-64, 65-74, and 75-84 years with Ns of 27, 33, 25, 25, and 11, respectively) in health symptoms, subjective health, number of medications taken, or ed-ucation. The study participants seemed to be compa-rable to representative non-arthritis samples with respect to cognitive abilities (6) and depression. To see if our sample might be more depressed than non-arthritis or non-disease samples, we compared their CES-D depression scores (14) with those of recently studied, representative samples of General Practice patients and of healthy adults (15). The mean depression score in our sample (mean 11.1, SD 10.5) and the percent-age of persons at or above a cut-off score of 23 (10.7%) were close to those of healthy adults (mean 10.5, SD 7.8, 11.1%).
Measures
Environmental demands were measured by the 11 MPED items displayed in Table 1; 7 items measuring
Busyness and 4 items measuring Routine. Participants were told this was a questionnaire about how their days usually go. They were instructed to think carefully about their responses and to try to be as realistic as pos-sible in their judgments. Participants were then asked to place an “X” in the appropriate blank for each item as it applied to them.
To validate the scale, several external criterion variables from the assessment battery of the medication adherence study were used. Overall, we expected measures indicat-ing the frequency of social contacts, the involvement in various tasks and roles, and social or instrumental obli-gations to be related to the amount of Busyness, be-cause these factors are likely to increase the number of un-planned situations in everyday life. In turn, a higher level of Busyness, but not age, was expected to relate to med-ication-taking errors (6). In other words, we hypothe-sized that the level of self-reported environmental de-mands rather than age, education, and household size would predict individual differences in the performance of everyday tasks.
Information on gender, age, education, employment status and household size was obtained as part of a de-mographic questionnaire. Education was reported as Grades 8-11, High School degree, Some college, College degree, or Post-graduate. Household size was reported as the total number of persons living in the respondents’ household. Employment included Not currently ployed, Currently employed part-time, or Currently em-ployed full-time.
In the 4 weeks of medication monitoring, biweekly medication error rates were calculated for each participant, for each prescribed medication. The individual medication error rates for each medication were calculated by divid-ing the total number of medication errors in a weekly or biweekly period by the total number of prescribed doses for that period. An error occurred if a participant either omitted or took an extra dose of medication. To minimize the influence of the transition to be monitored, we used only data from the second biweekly period in the analyses. Preliminary analyses showed no systematic differences across types of medications (e.g., arthritis, NSAIDS, tihypertension, thyroid, cardiovascular, gastrointestinal, an-tidepressant, folic acid, nutritional supplements, and oth-er medications). Thoth-erefore, oth-error rates woth-ere avoth-eraged ovoth-er all medications for each participant (6).
RESULTS
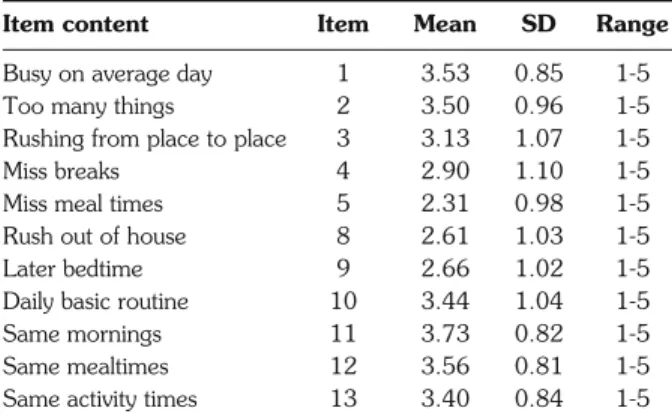
On all MPED items, subjects used the complete range of possible responses from 1 to 5, with higher ratings indicating higher levels of Busyness or Rou-tine (Table 2). Items had been constructed on the as-sumption that Busyness (items 1-7) and Routine (items 8-11) were two independent factors. In order to test this assumption empirically, we first computed inter-item Table 1 - Items of the Martin & Park Environmental Demands
(MPED) Questionnaire. Busyness Items
1. How busy are you during an average day?
2. How often do you have too many things to do each day to ac-tually get them all done?
3. How often do you find yourself rushing from place to place try-ing to get to appointments or to get thtry-ings done?
4. How often are you so busy that you miss scheduled breaks or rest periods?
5. How often are you so busy that you miss your regular meal times?
6. How often do you rush out of the house in the mornings to get to where you need to be?
7. How often do you have so many things to do that you go to bed later than your regular bedtime?
Routine Items
8. How often do your days follow a basic routine?
9. How often do you get out of bed in the morning and go to bed at night at about the same time?
10. How often do you eat all of your meals at the same time each day and night?
11. How often do you engage in activities at home at a specific time (i.e., read the paper after work, watch a particular television show, children, hobbies, etc.)?
Possible answers to the first question were: 1 = Not busy at all, 2 = Rarely busy, 3 = Somewhat busy, 4 = Very busy, and 5 = Extremely busy. Possible answers to all other questions were: 1 = Never, 2 = Rarely, 3 = Sometimes, 4 = Often, and 5 = Very often.
correlations (Table 3). The correlations among Busyness items and among Routine items generally seemed to be larger than the correlations between Busyness and Routine items.
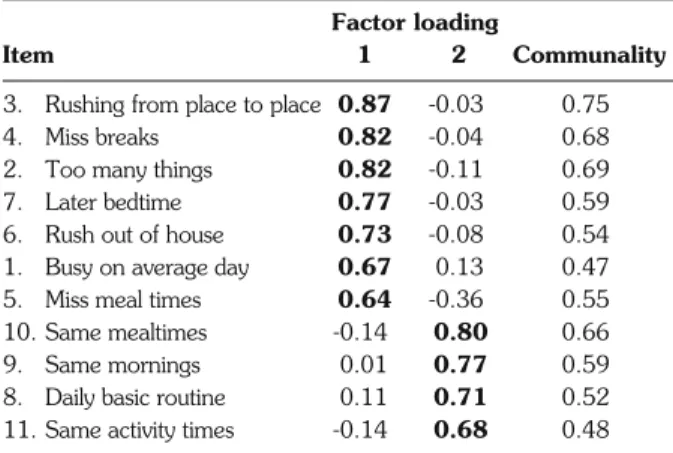
We expected that an exploratory factor analysis would support the internal structure of the questionnaire with two interpretable factors Busyness and Routine, with the respective items loading high on one and low on the other factor. We conducted an exploratory fac-tor analysis with Varimax rotation, limiting the solution to two factors (Table 4). Only the first two factors had an eigen-value above 1. The 2-factor solution explained 59.24% of the variance. The eigen-values of the two ro-tated factors were 4.15 (37.71% of the variance) for Factor 1 (Busyness) and 2.37 (21.53% of the variance) for Factor 2 (Routine). Both factors were almost inde-pendent, with a correlation of only r = 0.13. All Busy-ness items loaded highly on Factor 1 and low on Factor 2. In addition, all Routine items loaded highly on Factor 2 and low on Factor 1.
We then examined the internal consistency of the Busyness and Routine scales. In the analysis, Cronbach’s alpha for the 7 Busyness items was α = 0.88, and for the 4 Routine items it was α = 0.74. Compared to the Busyness scale, the internal consistency of the Routine scale might have been underestimated due to the smaller number of items included.
To investigate the external validity of the two scales, we correlated the scale factor scores with external criterion variables, based on three assumptions. First, because old-er adults are less busy, probably because of fewold-er job obligations and a smaller social network, we would expect a negative correlation of Busyness with age (and a positive correlation of Busyness with employment). In contrast, be-cause older adults might be more likely to stick to daily rou-tines to avoid forgetting things, we would expect a positive correlation between Routine and age. The second as-sumption was that a larger household size should relate to more obligations and more non-routine events, i.e., a positive correlation between Busyness and household size, but not between Routine and household size. Third, based on our earlier findings, we assumed that Busyness was an important factor in predicting medication adherence (6). We examined this same question in the present study with simple correlations rather than with complex structural equation models that included many factors, expecting medication-taking errors to be strongly related to Busyness, but not to age.
The findings from this study generally supported our assumptions. First, there was the expected negative correlation between Busyness and age (r=-0.27, p<0.05), and a positive correlation between Busyness and employment (r=0.34, p<0.01), but there was no significant relation between Routine and age (r=0.07, p>0.43) or employment (r=-0.03, p>0.70). Second, there was the expected correlation between Busyness and household size (r=0.32, p<0.01), but not between Table 2 - Means and standard deviations of MPED items.
Item content Item Mean SD Range
Busy on average day 1 3.53 0.85 1-5
Too many things 2 3.50 0.96 1-5
Rushing from place to place 3 3.13 1.07 1-5
Miss breaks 4 2.90 1.10 1-5
Miss meal times 5 2.31 0.98 1-5
Rush out of house 8 2.61 1.03 1-5
Later bedtime 9 2.66 1.02 1-5
Daily basic routine 10 3.44 1.04 1-5
Same mornings 11 3.73 0.82 1-5
Same mealtimes 12 3.56 0.81 1-5
Same activity times 13 3.40 0.84 1-5
Table 3 - Correlations of MPED items.
1 2 3 4 5 6 7 8 9 10 11 1 — 2 0.58** — 3 0.61** 0.71** — 4 0.42** 0.65** 0.66** — 5 0.24** 0.45** 0.52** 0.57** — 6 0.31** 0.50** 0.53** 0.55** 0.43** — 7 0.37** 0.52** 0.57** 0.54** 0.50** 0.64** — 8 0.16 -0.06 0.04 0.04 -0.10 0.01 0.03 — 9 0.05 -0.07 -0.03 -0.00 -0.27** -0.07 -0.10 0.39** — 10 -0.01 -0.21* -0.15 -0.19* -0.37** -0.14 -0.04 0.44** 0.48** — 11 -0.15 -0.16 -0.15 -0.08 -0.22* -0.14 -0.09 0.31** 0.40** 0.46** — *p<0.05, **p<0.01.
Routine and household size (r=0.03, p>0.70). Third, there was the expected correlation between Busyness and medication errors in the last 2 weeks of the moni-toring period (r=0.38, p<0.001), but no significant re-lation between age and medication errors (r=-0.15, p>0.09). When relating the MPED to sociodemographic variables, we also observed that those who were more busy were more highly educated (r=0.29, p<0.01).
To examine if the MPED scales simply measured the same effects as the sociodemographic control vari-ables on medication errors, we conducted a stepwise multiple regression analysis to determine if Busyness was still predicting adherence errors in the last 2 weeks of the monitoring period after the effect of a combi-nation of these variables was partialed out. Results from the final model with all variables entered are displayed in Table 5.
We included age, education, employment, and size of household in a first step and Busyness and Routine in a second step. Results indicated that although the predictors of the first step made a significant contribution in
ex-plaining medication errors in the second biweekly period, the effect of Busyness remained significant. All analyses reported in this section were also conducted separately for women only, but the results differed only marginally from the results for the total sample.
DISCUSSION
Our findings suggest that a simple paper and pencil measure of self-reported environmental demands involv-ing independent factors of Busyness and Routine may be useful in characterizing contextual demands in the envi-ronment. The two scales of the MPED Questionnaire, Busyness and Routine, can be meaningfully related to ex-ternal criterion variables and everyday behavior. In fact, higher levels of environmental demands (high scores on the MPED) showed the expected negative correlation with age and positive correlations with employment, household size and medication-taking errors.
There are a few limitations in our approach. First, it would be desirable to have a larger sample to assess gen-eralizability. However, an inspection of the results of the factor analysis, the scale consistencies, and the size of the correlations reported suggests rather strong effects despite the relatively small sample size. It would be useful to study another group besides the rheumatoid arthritis sample. All of our subjects, however, were community-dwelling indi-viduals who characterized themselves and were indepen-dently characterized by a physician as having a “moderate” level of arthritis, so these were not severely ill individuals. Moreover, their cognitive function did not differ from age-matched control subjects tested on similar tasks (16), suggesting that, in terms of cognitive function, they were representative of a healthy population (6). In addition, the sample under examination did not seem to differ from non-disease samples with respect to levels of de-pression as indicated by the CES-D (15).
It would also be useful to know how the MPED scales are related to other constructs like life events and daily hassles. Since life events indicate rather extreme environmental conditions and the measurement of dai-ly hassles focuses on the negative and bothersome as-pects of everyday life, we would assume a small con-struct overlap, but would nevertheless expect the MPED to account for independent variance relative to these other scales.
CONCLUSIONS
In summary, the MPED is a short and economic tool with high levels of scale consistency and an acceptable lev-el of external validity. In future research on cognitive functioning, the MPED could be used either as an ex-planatory variable or as an important control variable complementing the traditional control measures of edu-cation and general intelligence. The MPED allows one to take into consideration the fact that adults experience Table 4 - Summary of items and factor loadings using a varimax
orthogonal two-factor solution for the MPED (N=121). Factor loading
Item 1 2 Communality
3. Rushing from place to place 0.87 -0.03 0.75 4. Miss breaks 0.82 -0.04 0.68 2. Too many things 0.82 -0.11 0.69 7. Later bedtime 0.77 -0.03 0.59 6. Rush out of house 0.73 -0.08 0.54 1. Busy on average day 0.67 0.13 0.47 5. Miss meal times 0.64 -0.36 0.55 10. Same mealtimes -0.14 0.80 0.66 9. Same mornings 0.01 0.77 0.59 8. Daily basic routine 0.11 0.71 0.52 11. Same activity times -0.14 0.68 0.48
Table 5 - Multiple regression analysis of variables predicting medication errors in the last 2 weeks of the monitoring period.
β R2 ΔR2 Step 1 0.085* 0.085* Age 0.018 Employment 0.035 Education -0.092 Size of household 0.193 Step 2 0.202*** 0.117*** Busyness 0.322*** Routine -0.153 *p<0.05, ***p<0.001.
great interindividual differences in the number of obliga-tions and environmental demands across the life span. The instrument may help to answer the empirical question of whether self-reports of being busy are the result of an interaction between subjective perceptions and particular properties of the environment, a personality trait which tends to attribute demand to any environment, or a re-duced ability to cope with everyday tasks leading to an in-creased sense of demand from the environment. By al-lowing adjustment for individual differences in environ-mental characteristics that, in turn, are partly related to in-dividual differences in socioeconomic status, cognition and intelligence, the MPED represents a useful tool for basic research as well as diagnostic purposes.
ACKNOWLEDGEMENTS
This work was supported by grant 3RO1-AG09868 from the Na-tional Institute on Aging, awarded to D.C. Park, D. Birchmore, and C. Hertzog.
REFERENCES
1. Schooler C, Schaie KW. Cognitive functioning and social struc-ture over the life course. Norwood, NJ: Ablex, 1987. 2. Hultsch DF, Hammer M, Small BJ. Age differences in cognitive
performance in later life: Relationships to self-reported health and activity life style. J Gerontol 1993; 48: 1-11.
3. Schooler C. The workplace environment: Measurement, psy-chological effects, and basic issues. In Friedman SL, Wachs TD, Eds. Measuring environment across the life span. Washington, DC: APA, 1999: 229-48.
4. Willis SL. Towards an educational psychology of the older adult learner: Intellectual and cognitive bases. In Birren JE, Schaie KW, Eds. Handbook of the psychology of aging, 2nded. New York: Van Nostrand Reinhold, 1985: 818-47.
5. Park DC, Gutchess AH. Cognitive aging and everyday life. In Park DC, Schwarz N, Eds. Cognitive aging: A primer. Philadelphia, PA: Psychology Press, 2000: 217-32.
6. Park DC, Hertzog C, Leventhal H, et al. Medication adherence in rheumatoid arthritis patients: Older is wiser. J Am Geriatr Soc 1999; 47: 172-83.
7. Gribbin K, Schaie KW, Parham IA. Complexity of life style and maintenance of intellectual abilities. J Soc Iss 1980; 36: 47-61.
8. Schaie KW, Gribbin K. Einflüsse der aktuellen Umwelt auf die Per-sönlichkeitsentwicklung im Erwachsenenalter [Environmental in-fluences on personality in adulthood]. Z Entwicklungspsychol Päd Psychol 1975; 7: 233-46.
9. Glass TA, Kasl SV, Berkman LF. Stressful life events and de-pressive symptoms among the elderly. J Aging Health 1997; 9: 70-89.
10. Orrell MW, Davies ADM. Life events in the elderly. Int Rev Psy-chiatry 1994; 6: 59-71.
11. Almeida DM, Kessler RC. Everyday stressors and gender dif-ferences in daily distress. J Person Soc Psychol 1998; 75: 670-80.
12. Lu L. Daily hassles and mental health: A longitudinal study. Br J Psychol 1991; 82: 441-7.
13. Martin M, Grünendahl M, Martin P. Age differences in stress, so-cial resources and well-being in middle and older age. J Gerontol Psychol Sci 2001; 56: 214-22.
14. Radloff LS. The CES-D scale: A self-report depression scale for research in the general population. J App Psychol Meas 1977; 1: 385-401.
15. Verdier-Taillefer M, Gourlet V, Fuhrer R, Alperovitch A. Psy-chometric properties of the Center for Epidemiological Studies-De-pression Scale in Multiple Sclerosis. Neuroepidemiol 2001; 20: 262-7.
16. Park DC, Smith AD, Lautenschlager G, et al. Mediators of long-term memory performance across the life span. Psychol Aging 1996; 11: 621-37.