Journal of Environmental Polymer Degradation, Vol. 5, No. 2, 1997
Review of the Kinetics of Alkaline Degradation of Cellulose in
View of Its Relevance for Safety Assessment of Radioactive
Waste Repositories
L. R. Van Loon l'z a n d M. A. Glaus 1
The degradation of cellulose (a substantial component of low- and intermediate-level radioactive waste) under alkaline conditions occurs via two main processes: a peeling-off reaction and a base- catalyzed cleavage of glycosidic bonds (hydrolysis). Both processes show pseudo-first-order ki- netics. At ambient temperature, the peeling-off process is the dominant degradation mechanism, resulting in the formation of mainly isosaccharinic acid. The degradation depends strongly on the degree of polymerization (DP) and on the number of reducing end groups present in cellulose. Beyond pH 12.5, the OH- concentration has only a minor effect on the degradation' rate. It was estimated that under repository conditions (alkaline environment, pH 13.3-12.5) about 10% of the cellulosic materials (average DP = 1000-2000) will degrade in the first stage (up to 105 years) by the peeling-off reaction and will cause an ingrowth of isosaccharinic acid in the interstitial cement pore water. In the second stage
(105-106
years), alkaline hydrolysis will control the further degradation of the cellulose. The potential role of microorganisms in the degradation of cellulose under alkaline conditions could not be evaluated. Proper assessment of the effect of cellulose degradation on the mobilization of radionuclides basically requires knowing the concentration of isosaccharinic acid in the pore water. This concentration, however, depends on several factors such as the stability of ISA under alkaline conditions, sorption of ISA on cement, formation of sparingly soluble ISA-salts, etc. A discussion of all the relevant processes involved, however, is far beyond the scope of the presented overview.KEY WORDS: Cellulose; alkaline degradation; peeling off; isosaccharinic acid; kinetics.
I N T R O D U C T I O N
Low- and intermediate-level radioactive waste (L/ILW) contains substantial amounts o f cellulosic ma- terials. In Switzerland, about 50 % o f the organic waste planned to be emplaced in the repository for low and intermediate radioactive waste (L/ILW-repository) is cellulosic [1]. The use o f large amounts o f cement for constructing the repository causes an alkaline environ- ment (pH o f the cement pore water remains above 12.5 for periods of the order of 105 years [2]). It is well-
Paul Scherrer Institute, Laboratory for Waste Management, CH-5232 Villigen PSI, Switzerland.
2 To whom correspondence should be addressed.
97
known in the literature that cellulose is unstable under alkaline conditions and will degrade to water-soluble, low molecular weight compounds [3]. The type o f deg- radation products formed depends strongly on the com- position o f the solution in contact with the cellulose. In the presence o f Ca 2+, a primary cation in cement pore water, isosaccharinic acid (ISA) will be the main deg- radation product [4, 5]. Isosaccharinic acid (Fig. I) is assumed to f o r m - - i n analogy with gluconic acid (Fig. D--stable complexes with tri- and tetravalent radio- nuclides such as A m 3+ and Pu 4+ [6-8] and might lower their sorption on the cement phase [9]. This would lead to an enhanced release o f such radionuclides to the geo- and biosphere.
When trying to assess the potential effect o f the
98 Van Loon and Glaus
COOH COOH
I I
COOH H--C--OH H--C--OH
i i
HOH2C--C--OHI HO--C--HI
~ H2
(~H 2 H--C--OH H~C--OH
I I
H--C--OH H--C--OH H--C--OH
I I I
CH20H CH20H CH20H
isosaccharinic a c i d gluconic acid metasaccharinic acid Fig. 1. Chemical structures of isosaccharinic acid, gluconic acid, and
metasaccharinic acid.
presence of cellulose in a repository, it is very important to have an idea of the concentration range of ISA in the cement pore water, because the concentration of a li- gand, together with the stability of the complex formed, is one of the key parameters governing the ultimate ef- fect of complexation on sorption. The concentration of ISA in the cement pore water depends on several fac- tors, such as the
9 amount of cellulose emplaced in the cement (cel- lulose loading),
9 degradation kinetics of cellulose, 9 stability of ISA formed,
9 sorption of ISA on the cement phase, and 9 formation of sparingly soluble ISA-salts with,
e.g., calcium.
The first two factors are directly related to the degra- dation of cellulose, whereas the others have to do with the properties of the degradation product itself or with the interaction between the degradation product and re- pository components and, consequently, are not directly related to the degradation of cellulose. In this overview, we focus only on the factors that are directly related to the degradation process of cellulose.
Bradbury and Sarott [9] assumed, in their overview of sorption of radionuclides on cement, that the degra- dation of cellulose occurs instantaneously and com- pletely and that isosaccharinic acid is the main degra-
dation product. The ISA concentration based on this assumption depends on the cellulose content of the re- pository. High cellulose contents lead to ISA concentra- tions high enough (up to 0.1 M) to complex virtually all of the radionuclides present so that no sorption occurs. Such an assumption is very conservative. A more real- istic picture, however, can be obtained when informa- tion on the following questions is available and taken into account:
9 Is the degradation of cellulose such a fast process that it is reasonable to assume an instantaneous degradation? and
9 Will cellulose be degraded completely to ISA? In the following, we try to answer these questions based on information available in the literature. We discuss the mechanisms and kinetics of the alkaline degradation of cellulose in detail w.r.t, their consequences on the long-term degradation of cellulose in a cementitious re- pository.
C E L L U L O S E
Cellulose is the most abundant organic material on earth. It is the main component of plant sources, serving as the structural material by which plants, trees, and grasses sustain the strength to stay upright. It occurs in almost-pure form in cotton fibers (90%) and, to a lesser extent, in flax (80%), jute (60-70%), and wood (40- 50%). Cellulose is a linear macromolecule composed of up to 10,000 (1,4)-/~-D-glucopyranose units (Fig. 2), and only the configuration of the C1 position is different from that of amylose that is made of (1,4)-c~-D-glucopyranose [10].
The cellulose molecule has a nonreducing end and a reducing one. The reducing end is a latent aldehyde and, like an aldehydo function, responds to both reduc- tion and oxidation processes. As will be seen later, the reducing end group plays a key role in the alkaline deg-
CH20H
HIgH
I H O r CH20HI
I
OH m oI
OH nonreducing endFig. 2. Chemical structure of cellulose.
CH 2 OH H H H H H
I/H
I
I
H OH n-2 reducing endReview of the Kinetics of Alkaline Degradation of Cellulose 99
O-%
crystalline region amorphous region crystalline region
Fig. 3. Microfibrillic structure of cellulose [12]. ( e ) Reducing end group; (9 nonreducing end group.
radation of cellulose. The cellulose molecular chains are ordered into strands as cellulose microfibrils through in- ter- and intramolecular hydrogen bonding [11]. These microfibrils have crystalline and amorphous regions (Fig. 3). The alkaline degradation takes place in the amorphous regions of cellulose [12, 13].
C E M E N T P O R E W A T E R
The chemistry of cement pore water has been dis- cussed in detail by Bemer [2] and Neall [14]. The com- position is determined to a large extent by the compo- sition of the cement and the water flow through the repository. The evolution of the pore water chemistry can be grossly divided into three stages. In the first stage, the dissolution of NaOH and KOH--present in cement as "impurities"--causes a (Na,K)OH cement pore water saturated with respect to Ca(OH) 2. The pH of this initial pore water lies around 13.4 (the concentration of O H - is 0.3 M) and the Ca concentration is about 2 mM. In the second stage, when all NaOH and KOH has been leached out, the composition of the pore water is deter- mined by the dissolution of Ca(OH)2. The pH of the pore water falls to 12.5 and the Ca concentration lies around 20 mM. In the third stage--when all the Ca(OH)2 has dissolved--the pH falls further and hydrated Ca-Si phases (CSH-gels) start dissolving.
Based on assumptions made for the water flow and the permeability and porosity of the cement, the pH of the cement pore water was calculated to remain above 12.5 for periods of the order of 105 years [2].
D E G R A D A T I O N O F C E L L U L O S E U N D E R A L K A L I N E C O N D I T I O N S
Peeling-Off Reaction
General
The peeling-off reaction is an endwise degradation process by which a reducing end group is split off from
the cellulose chain, resulting in soluble degradation products such as isosaccharinic acid. The peeling-off re- action is controlled by two competing reactions: a pro- gressive shortening of the cellulose molecule in which glucose units are progressively eliminated from the cel- lulose molecule (starting at the reducing end group) and a stopping reaction in which the reducing end group is converted to an alkalistable end group while it is still attached to the cellulose chain. The stopping reaction can be subdivided into a chemical and a physical stop- ping reaction. The former is the transformation of a re-
ducing end group into a stable metasaccharinic acid (Fig. l) end group. The latter implies that a reducing end group reaches the crystalline region of the cellulose and is no longer accessible to alkali [12]. The physical stop- ping reaction is not an abrupt process since there is a gradual transition from the amorphous to the crystalline region rather than a distinct interface. A schematic pre- sentation of the peeling-off reaction is given in Fig. 4.
General Reaction Kinetics
The kinetics of the peeling-off reaction of cellulose have been studied in detail by Haas et al. [12]. They
performed kinetic studies on hydrocellulose (prepared from cotton) with a degree of polymerization (DP) of 166 at different temperatures (ranging from 65 to 132 oc) in 1.25 M NaOH solutions. The liquid/solid ratio in their studies was so high (100/1) that the NaOH concentra- tion remained practically constant during the whole re- action time.
For the progressive chain degradation, at a constant concentration of O H - , the following equation can be
G - G - G - G - G - G - G - G - G - G r
1
Peeling off OH G - G - G - G - G - G - G r + nGe Chemical stopping G - G - G - G - G - G - G m s a Physical stopping G - G - G - G - G - G - G r , cFig. 4. Schematic presentation of the peeling-off reaction. G is a glu- cose monomeric unit (glucopyranose), Gm~a is a stable metasacchar- inic acid end group, Ge is a glucose unit eliminated, and n is the number of glucose units eliminated. Gr is a reducing end group in the amorphous region of the cellulose fiber and G~,c is a reducing end
1 0 0 V a n L o o n a n d G l a u s
written:
d ( Q )
-- k I 9 (Gr) (1)
d t
with (Ge) the mole fraction of glucose units eliminated, (Gr) the mole fraction of reducing end groups available for the reaction, and kt the pseudo-first-order rate con- stant. The mole fraction of a component is defined here as the number of moles of that component divided by the number of moles of all components in the system. For the system with cellulose described here, the num- ber of moles of all components equals the initial degree of polymerization (DP0). As an example, the mole frac- tion of Q is defined as
Ge
(Gr - (2)
O P o
Assuming that the glucose units are eliminated as iso- saccharinic acid (no fragmentation reaction), 3 Eq. (1) can also be written as
d(ISA)
= k, 9 (Gr) (3)
d t
where (ISA) is the mole fraction of isosaccharinic acid formed.
For the chemical stopping reaction, the following rate equation can be written:
d(MSA)
- k2 9 (G~) (4)
d t
where (MSA) is the mole fraction of stable metasac- charinic acid end groups formed and k2 the pseudo-first- order rate constant for the chemical stopping reaction.
Although no chemical reaction is involved in the physical stopping process, a similar rate equation can be written for this physical stopping reaction:
d(Gt)
- kcr 9 (G~) (5)
d t
where (Gt) is the mole fraction of reducing end groups not available for reaction and kcr is the formal rate con- stant of termination caused by inaccessibility.
31n the peeling-off reaction, the reducing end group is split off from the cellulose chain, resulting in the formation of an intermediate product Ge. The intermediate product reacts further via two reaction pathways to give the ultimate degradation products. Isosaccharinic acid is formed via an internal rearrangement of the intermediate product (benzilic acid type of rearrangement). Via a fragmentation reaction the intermediate molecule is split into smaller molecules such as lactic acid, formic acid, and acetic acid [3-5, 15, 16].
The decrease in reactive reducing end groups is caused by the two stopping reactions and can be com- bined as
d(G~)
- k2 " (Gr) + kcr'(Gr) = kt " (Gr) (6)
d t
where kt (kt = k2 q- kcr) is the total rate constant for chain termination.
At t = 0, (G0 = (GOo, the initial reducing end- group content. Integration of Eq. (6) gives
(GO = (G,)o 9 e -k''' (7) Substitution of Eq. (7) in Eqs. (1) and (3) gives
dCa~)
- k l " ( G ~ ) o " e - k ' ' t (8)
d t
d(ISA...~) _ kl " (G~)o " e - k t ' t (9)
d t
At t = 0, (Go) and (ISA) = 0 and Eqs. (8) and (9), after integration, give
k~ .t) (10)
(Ge) = ~ (Gr)o " (1 - e -k'
k~ .t) (11)
(ISA) = ~ (Gr)o 9 (1 - e -k' Substitution of Eq (7) in Eqs. (4) and (5) gives
d(MSA) - kl " (Gr)o 9 e - k t ' ' (12) d t and d(Gt) dt - k c r " (Gr)o " e - k ' ' t (13) At t = 0, (MSA) and (Gt) = 0 and integration of Eqs. (12) and (13) gives k2 .t) (MSA) = ~ (G~)o " (1 - e -k' (14) and
kcr
e - k t " t ) (Gt) = ~ t (G~)0 " (1 - (15) The maximum amount of (ISA) at t = oo can be cal- culated from Eq. (11):kl
(ISA)max = ~ (Gr)o (16) The maximum amount of cellulose degraded equals the maximum amount of glucose units peeled off and can
Review of the Kinetics of Alkaline Degradation of Cellulose 101
be written as
k 1
(cellulose degraded)max = (Ge)ma x = k t ( G r ) ~ (17)
From Eqs. (16) and (17) it can be deduced that (ISA)ma x and (cellulose degraded)max depend on the initial mole fraction of reducing end groups in the cellulose, (G00, and on the ratio o f the rate constants o f the propagation reaction and the stopping reactions.
The initial mole fraction of reducing end groups is defined as
moles of reducing end groups
(Gr) o = (18)
moles of glucose units in the chain The mole fraction of reducing end groups depends on the average amount o f reducing end groups in a cellu- lose molecule and on the degree of polymerization. Both these parameters have an effect on the amount of cel- lulose that will be degraded. In theory, one molecule of cellulose, containing n glucose units (degree o f poly- merization DP = n), has one reducing end group. In reality, not all cellulose molecules will have reducing end groups because the reducing end groups may have been transformed to nonreducing end groups during the pulping process [17-20]. Consequently, the mole frac- tion of reducing end groups in cellulose with DP = n is
1
0 < (Gr)0 < - (19)
n
The presence of one reducing end group per cellulose molecule will result in the m a x i m u m value o f the con- centration of reducing end groups (Gr)o for a cellulose molecule with DP = n and, consequently, results in the upper limit of the m a x i m u m a m o u n t of degradable cel- lulose.
The amount of isosaccharinic acid formed and also the amount of cellulose degraded by the peeling off re- action depend strongly on the degree of polymerization of cellulose. The larger the cellulose molecule, the lower the mole fraction o f reducing end groups [as can be seen from Eq. (18)] and the lower the extent of degradation (Fig. 5).
E f f e c t o f T e m p e r a t u r e o n t h e P e e l i n g - O f f R e a c t i o n K i n e t i c s
The rate constants kl, k2, kcr, and k t w e r e deter-
mined by Haas e t a l . [12] at different temperatures be-
tween 65 and 132~ and an O H - concentration of 1.25 M. The authors used hydrocellulose with DP = 166. The values are summarized in Table I.
0.012 , ~ ,
"O"OO 0.01
0.008 o'}o
9 "o 0.006 t ' - . . . ._o 0.004 DP = 5000 It. 0.002 . . . DP = 10000 s 0 i I I I I I I 0 50 100 150 200 250 300 350 400 T i m e ( d a y s )Fig. 5. Degradation of cellulose as a function of time at [OH-] = 0.3 M and 25~ for different degrees of polymerization (DP), The solid lines were calculated using Eq. (10), with k, = 3.65 9 10 2 h-~ and kt = 6.91 9 10 -4 h -~.
Values of these constants at lower temperatures can be estimated by applying the Arrhenius equation:
k = A 9 e -ea/n" r (20) or, in the linear form,
l o g k = l o g A - 0.434 " - -
Ea
(21)R . T with
A = Arrhenius parameter ( h - l) k = rate constant (h -1)
Table I. Overview of the Rate Constants for Cellulose Degradation (Peeling-Off Reaction) at Different Temperatures in 1.25 M NaOH
[121 T k~ k2 kcr k, (~ (h-') (h i) (h-') (h-') 2Y 0.0393 0 . 0 0 0 0 1 4 0.00073 h 0.00074 65 4 0.0041 0.057 0.061 78 17.8 0.031 0.263 0.29 87 46.3 0.097 0.64 0.74 100 147 0.50 1.60 2.10 132 1550 6.98 13.0 19.98
"Extrapolated by the Arrhenius equation (21):
logk I = 16.21 - 5249 9 1/T "" logkl (25~ = -1.41 -4- 0.35
logk2 = 17.12 - 6548 9 1/T ~ logk2 (25~ = -4.86 + 0.46
logkt = 13.86 - 5062 9 l I T ~ logkl (25~ = -3.13 + 0.44 b The value of kcr at 25 ~ was calculated from the extrapolated values
kt and k2 by using the equation kcr = kt - k2 because kcr is not a measured value but calculated from k t and k2.
102 Van Loon and Glaus
E a = activation energy (J 9 m o l - i )
R = universal gas constant (J 9 mol -I 9 K - i ) T = absolute temperature (K)
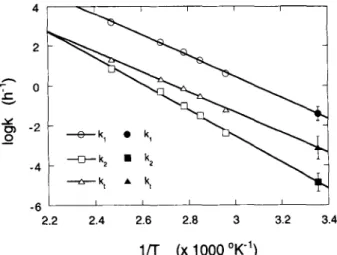
Plotting log k versus the reciprocal absolute tempera- tures yields a straight line with slope 0.434 9 EJR and intercept log A with the Y-axis. With these equations, values for kl, k2, and k t at 25~ were calculated (see Table I). The errors on the estimated values were cal- culated from the errors on the slope and the intercept of the regression line [21], the Student t value for (n - 1) = 4 degrees of freedom, and the 95 % confidence level. Figure 6 illustrates the Arrhenius equation for the dif- ferent reactions of the peeling off process. It is clearly shown that the relationship between the logarithm of the rate constants and the reciprocal of the absolute temper- ature is a linear one according to Eq. (21). The activa- tion energy (Ea) of the different reactions can be calcu- lated from the slope of the lines. The propagation reaction has an activation energy of 101 kJ 9 mo1-1 and the activation energy of the overall stopping reaction is 97 kJ 9 mol -~.
The extent of cellulose degradation by the peeling- off reaction depends on the ratio of the rate constants k~/ kt [Eq. 17] and, consequently, on the reaction temper- ature. At lower temperatures, the degree of degradation is smaller than at higher temperatures. This can be ex- plained properly by the slightly higher activation energy of the propagation reaction w.r.t, the overall stopping reaction. 0 2 - ,r {:~ -2 0 0 k 1 9 k 1 -6 t t t I i 2.2 2.4 2.6 2.8 3 3.2 3.4
1/T (x 1000 ~
Fig. 6. Arrhenius plot for the peeling-off reaction [chain propagation (k0, chemical (k2) and overall (k0 stopping reaction] of cellulose in 1.25 M NaOH. Open symbols represent experimental data [ 12]; filled symbols are extrapolated values. The error bars on the extrapolated values represent the 95 % confidence level estimated from the error on the slope and the intercept of the regression line.
Effect of Base Concentration on the Peeling-Off Reaction Kinetics
The concentration of O H - in the cement pore water in the initial stage of cement degradation is about 0.3 M and the Ca level is about 2 mM. To evaluate the deg- radation of cellulose under such repository conditions, the effect of pH (or O H - concentration) and the effect of Ca 2+ on the peeling-off reaction have to be discussed. The rate constants discussed in the previous section were derived for reaction conditions of 1.25 M NaOH in the absence of Ca. No further systematic studies on the ef- fect of [OH-] and [Ca 2§ on the rate constants (kl, k2, kcr , and kt) have been found in the literature for cellu- lose. Although no experimental data on the effect of O H - and Ca 2§ are available for cellulose, some data exist for other polymeric materials. Studies on amylose [22] and/3-(1-3)-glucans [23] showed that the hydroxyl ion does not participate in the rate-determining reaction step and that anionic species are involved in the peeling- off and chemical stopping reaction for these polysac- charides. It was further shown that the alkaline degra- dation of amylose with ot-(1-4)-glycosidic bonds (at temperatures < 120~ proceeds by the same reaction mechanisms as the alkaline degradation of cellulose with /~-(l-4)-glycosidic bonds [22], i.e.,
9 a chain propagation reaction (peeling off reac- tion), resulting in the formation of isosaccharinic acid; and
9 a chemical stopping reaction by which the re- ducing end group is transformed into an alkali- stable metasaccharinic acid end group.
A physical stopping reaction does not occur because amylose does not have a microfibrillar structure such as cellulose. Conclusions drawn from the study on amy- lose [22] are applicable to a large extent to cellulose.
The rate constant for the peeling-off reaction (k0 increased with the concentration of O H - until 0.3 M. Beyond 0.3 M, k~ remained constant (see Fig. 7). The rate constant for the chemical stopping reaction (k2) was negligibly small for a concentration of O H - below 0.1 M and could not be quantified. Beyond 0.3 M, k2 in- creased until the concentration of O H - reached a value of 1.5 M. Beyond 1.5 M, k2 remained constant. It was also observed that up to 0.1 M, amylose was completely degraded and that, for 0.1 M < [OH-] < 1.5 M, the extent of degradation decreased. Beyond 1.5 M, the ex- tent of degradation remained constant [22].
In analogy to amylose, it is assumed that the reac- tivity of the reducing end group in cellulose is propor- tional to its degree of ionization:
R e v i e w o f the K i n e t i c s o f A l k a l i n e D e g r a d a t i o n o f Cellulose 103
320
280
240
200
2::"-" 160
120
80
40
0
i i i0 0
0
I I I0
1
2
3
[OH] (M)
, 2kl o
t 11,5
k 2
..,.~
0.5 k 0 4Fig. 7. Dependence of rate constants for the peeling-off reaction (k0 and chemical stopping reaction (k2) of amylose on the hydroxyl con- centration at 100~ [22].
cellulose - Gr + O H - ,~ cellulose - G7 + H20 (22) The deprotonation constant is defined as
( G / )
K, - (23)
(Gr) 9 [OH- ]
where (G/-) is the mole fraction of deprotonated reduc- ing end groups and (GO is the mole fraction of proton- ated reducing end groups.
From the mass balance,
( G , ) t = (Gr) + ( G r )
and Eq. (23), it can be shown that
(24)
K, 9 [OH-]
(G~-) = "(GOt (25)
1 + K1 9 [ O H - ]
The rate equation for the propagation reaction can be written as
d(Ge)
dt = k[ 9 ( G r ) (26)
where k[ is the OH-independent first-order rate constant for the peeling-off reaction. Combining Eqs. (25) and (26) results in With d(Ge) K, 9 [OH-] = k~ 9 9 (GOt (27) dt 1 + K, 9 [OH-] K, 9 [OH-] kl = k~ 9 (28) 1 + K~ 9 [ O H - ]
Eq. (27) can be written as
d ( Q )
- k~ 9 (Gr) t (29)
dt
where k~ is the "conditional" OH-dependent rate con- stant.
Equation (29) is very similar to Eq. (1). The for- malism developed by Haas et al. [12] for the peeling- off reaction was a special case of the more general for- malism presented by Eq. (27) because their studies were performed at a high and constant concentration of O H - .
For the stopping reaction, a further deprotonation of the reducing end group is required so that a second deprotonation step has to be introduced. The rate equa- tion for the chemical stopping reaction can be written as
d(MSA)
- k~ 9 (G~-) (30)
dt
where k~ is the OH-independent first-order rate constant for the chemical stopping reaction and (G 2-) the mole fraction of twofold deprotonated reducing end groups.
Since at low temperatures the chemical stopping re- action plays a minor role in the overall stopping reaction of the alkaline degradation of cellulose (see Table I, k 2 << kcr), the dependence of k2 on the hydroxyl concen- tration is not discussed further here.
The effect of [OH-] on the physical stopping re- action was not studied by Lai and Sarkanen [22] be- cause, as already mentioned, such a stopping process does not occur in amylose. For cellulose, however, the following rate equation--based on Eq. (5)--can be writ- ten assuming that the reaction rate is proportional to the mole fraction of deprotonated end groups:
with d(Gt) K~ 9 [OH-] - k'r" (Gr)t (31) dt 1 + K 1 9 [OH-] K, 9 [OH-] p . k . = k . (32) 1 + K 1 9 [ O H - ]
Equation (31) is similar to Eq. (27) for the peeling-off reaction. This similarity can be justified as follows. Since the physical stopping reaction occurs when a re- ducing end group reaches the crystalline region of the cellulose fiber, its rate will depend strongly on the rate of the peeling-off reaction. The faster the peeling-off re- action, the faster a reducing end group will reach the crystalline region. Consequently, the rates of both re- actions have to be strongly correlated. The ratio kl/kcr is constant and equals kt/kcr.
From the considerations made above, the maxi- mum amount of cellulose that will be degraded can be
104 Van Loon and Glaus written as
kl
(cellulose degraded)max = (Ge)max = ~ (Gr)0 (33)
where kl and k t are the intrinsic (i.e., OH-independent) rate constants. Because o f the assumption that the rate of stopping is proportional to the rate o f degradation, the extent o f cellulose degradation is independent o f the O H - concentration. This was experimentally confirmed by Machell and Richards [24], who did not see an effect of the alkali concentration on the extent o f cellulose degradation in the range 0.125 M < [ O H - ] < 1.25 M. For a concentration of O H - higher than 2 M, a signifi- cant effect o f [ O H - ] on the extent of degradation was observed. At these concentrations, however, the struc- ture o f cellulose is changed (transition o f crystalline to amorphous cellulose), resulting in a higher accessability of the cellulose to O H - [25].
The reaction rate, however, depends on the con- centration o f O H - . The values o f the first-order rate constants for cement pore water conditions (i.e., [ O H - ] = 0.3 M) can be calculated by applying the following equation:
with
K 1 9 [ O H - ]
ki.o.3 = kl " (34)
1 + K~. [OH-]
ki,0. 3 = rate constant for [ O H - ] = 0.3 M
kl = intrinsic rate constant [ O H - ] = concentration o f OH (M)
K~ = deprotonation constant for the deprotonation o f C r O H o f the reducing end group (K I =
30)
The values o f k~ were calculated by applying Eq. (34) for [ O H - ] = 1.25 M and the values o f ki,l.25 at 25~ as summarized in Table I.
The values o f the different rate constants for 0.3 M O H - and 2 5 ~ are summarized in Table II. The differ-
Table II. Overview of the Rate Constants for Cellulose Degradation by the Peeling-Off Reaction for 25~ and Different
OH- Concentrations
[OH-] k, k2 kc~ kt
(M) (h-1) (h-') (h-1). (h-')
1.25 3.93E-2 1.40E-5 7 . 3 1 E - 4 7.45E-4 0.3 b 3.65E-2 1.30E-5 6 . 7 8 E - 4 6.91E-4 a kcr = k, - k2.
b Calculated by Eq. (34).
ence in rate constant between 1.25 and 0.3 M O H - is very small because Kl o f the reducing end group is = 30 or the deprotonation constant pK a = 12.5 [22, 23, 26]. Beyond pH 13, the reducing end groups are almost com- pletely deprotonated.
Effect of Ca 2+ on the Peeling-Off Reaction Kinetics
Ca 2+ has a significant effect on the peeling-off re- action [4, 5, 24, 27]. Ca 2§ seems to catalyze the ben- zilic acid type of rearrangement, leading to the forma- tion o f ISA. Also, the chemical stopping reaction is catalyzed. The overall effect o f the presence o f Ca 2+ is a lower degree of degradation and the formation o f rel- atively more ISA at the expense o f side products. No systematic kinetics studies on the alkaline degradation of cellulose in presence o f Ca 2 § have been performed.
Base-Catalyzed Cleavage of Glycosidic Bonds (Alkaline Hydrolysis)
General Mechanisms and Reaction Kinetics
Besides the peeling-off reaction, the base-catalyzed cleavage o f glycosidic bonds is another important pro- cess in the alkaline degradation o f cellulose that needs to be discussed in detail. The kinetics o f alkaline hy- drolysis have been studied by Lai and Sarkanen [28], Lai [29], and Franzon and Samuelson [30].
Alkaline hydrolysis o f cellulose could not be stud- ied separately from the peeling-off reaction because hy- drolysis produces new reducing end groups, initiating a peeling off reaction.
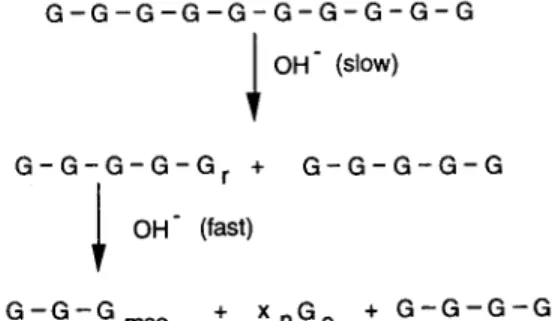
As illustrated in Fig. 8, the degradation is initiated by cleavage of a glycosidic bond. The newly formed reducing end groups give rise to a chain degradation
G - G - G - G - G - G - G - G - G - G I OH" (slow)
G - G - G - G - G r + G - G - G - G - G
OH" (fast)
G - G - G m s a + X n G e + G - G - G - G
Fig. 8. Schematic overview of the alkaline degradation of cellulose by the base-catalyzed cleavage of glycosidic bonds and the peeling- off reaction. Gr = reducing end group, G .... = alkali-stable meta- saccharinic acid end group, Ge = glucose units eliminated as ISA or other products; and x, = the number of peeled-off glucose units.
R e v i e w o f the K i n e t i c s o f A l k a l i n e D e g r a d a t i o n o f C e l l u l o s e 105
(peeling-off) process by progressively converting the terminal units to isosaccharinic acid and other products (see previous section).
A few mechanisms are known for the base-cata- lyzed cleavage of glycosidic linkages. For cellulose, an internal nucleophilic substitution (SNi) was found to be the most evident one [29]. The SNi mechanism for base- catalyzed cleavage of glycosidic bonds can be divided into two processes [31]. In the first step, a deprotonation reaction occurs:
K
GlcOH + O H - ~ ~ H20 + G l c O - (35) In the second step, the intermediate product (GlcO-) is transformed:
k
G l c O - - degradation products (P) (36) where GlcOH is the glycoside (cellulose in our case) and G l c O - is the anionic intermediate. K is the equilib- rium constant between neutral and ionic glycosides (de- protonation constant) and k is the specific rate constant in the conversion of anionic intermediates to degrada- tion products. The latter is the rate-determining step in the overall reaction. The rate of alkaline degradation of glycosides can be expressed as
d(P)
- k 9 ( G l c O - ) (37)
dt
where (P) represents the mole fraction of glycosides re- acted after time t (or the mole fraction of degradation products formed) and ( G l c O - ) is the mole fraction of ionized, intermediate glycosides at time t.
The "deprotonation" constant K is defined as (GlcO-)
K = {(GlcOH)o - (GlcO-) - (P)} [ O H - ] (38) where (GlcOH)o is the mole fraction of glycosides at t = 0. Combination of Eqs. (37) and (38) yields a rate equation, which is integrated to give
(GlcOH) o - (P) K . k 9 [ O H - ] In (GlcOH)o = - 1 + K " [ O H - ] " t (39) If K . k " [ O H - ] kobs = (40) 1 + K . [OH-]
where kob ~ is the pseudo-first-order rate constant of the reaction, Eq. (39) becomes
(GlcOH)o - (P)
In = -kobs " t (41) (GlcOH)o
Franzon and Samuelson [30] studied the alkaline deg- radation of cellulose at 170~ in 1.25 M NaOH. They observed a change in DP of the cellulose and a weight loss. The overall degradation was found to be the result of two processes: the cleavage of glycosidic bonds (re- suiting in a decrease in DP), followed by a peeling-off reaction starting from the newly created reducing end group (resulting in weight loss). The amount of cellu- lose units peeled off after each chain break (Xn) was
shown to be constant (x,, = 65) and independent of the DP within a wide range. The rate-controlling step in the overall degradation process is the cleavage reaction.
The amount of cellulose left after degradation (Y) was found to be related to the degradation time (t) by the following equation:
In (Y) = - k 9 t (42) with
Y = fraction of cellulose left k = rate constant (h - t )
t = time (h)
Lai and Sarkanen [28] studied the alkaline degradation of cellulose at different temperatures between 146 and 186~ in 1.25 M NaOH. They came to conclusions similar to those of Franzon and Samuelson [30] and showed that the rate of degradation conformed with the following equation:
In (Y) = - - k o b s 9 x n 9 t (43)
with
Y = fraction of unreacted cellulose t = time (h)
k o b s = rate constant ( h - i )
x,, = average number of glucose units peeled off (x. = 65)
Equations (42) and (43) are very similar. Since the num- ber of glucose units peeled off for each chain break (x,) is constant, it can be integrated in the rate constant as was done by Franzon and Samuelson [30]:
kobs " xn = k (44)
Effect of Temperature on the Reaction Kinetics
Lai and Sarkanen [28] determined the rate con- stants for the degradation of cellulose in 1.25 M NaOH at different temperatures between 146 and 185 ~ Table III summarizes their results. A rate constant for 25~ was calculated by applying the Arrhenius equation [see Eq. (21)]. Figure 9 illustrates the temperature depen- dence of the rate constant. At a temperature of 25~
106 Van Loon and Glaus
Table I I l . Rate Constants for Degradation of Cellulose in 1.25 M
OH (from Ref. 28 with the Exception of the Data for 170~ from
Ref. 30) Temperature kob s 9 x n (~ (h-') 256 2 . 1 7 " 10 - t ~ 146 4 . 0 0 . 10 -3 165 2 3 . 0 " 10 -3 170 3 8 . 7 " 10 -3 185 129" 10 -3
aExtrapolated by applying the Arrhenius equation (21): log(kobs 9 x,)
= 15.41 - 7461 9 I / T ~ log(kobs " x,) = --9.66 + 0.17.
the rate constant is about 7 orders of magnitude lower than at 146~ The base-catalyzed cleavage of glyco- sidic bonds is very sensitive to temperature.
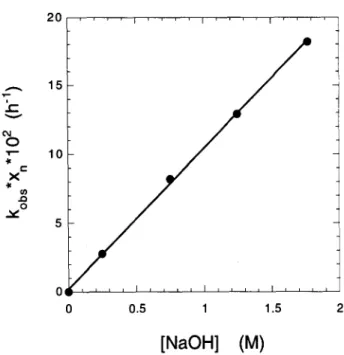
Effect of Base Concentration on the Reaction Kinetics Lai and Sarkanen [28] found a linear dependence of kobs " x, on the concentration of O H - for 0 M < [OH] < 2 M. Figure 10 illustrates this dependence for the degradation of cellulose at 185~ Assuming that a similar linear relationship is valid for lower reaction temperatures, a rate constant for the degradation of cel- lulose in 0.3 M O H - at 25~ can be calculated by ap- plying the following equation:
kobs, l.25 9 X n
k~ " X n = 1.25 9 0 . 3 (45)
and results in a value of kob, " x, = 5.25 9 10 -11 h -1 for 25~ i t'- .-.= x ,4o v .go
o
-...%
,
- - ~ - - measured values " 2 -4 -6 -8 -10 I I 2 2.5 3 3.5 1/T (x 1000 ~Fig. 9. Arrhenius plot for the alkaline hydrolysis of cellulose in 1.25 M OH [28, 30]. v r o
I-
e- X .1r 09 ,.,O 2 0 15 10 0~ 0 0.5 1 1.5 2 i i , , i , , , , i , , , , I . . . . ~ = = = l ~ h l t l i t l l l l l l l[NaOH] (M)
Fig. 10. Dependence of k,,b,~ 9 x , on the concentration of O H - at
185~ [28].
Effect of C a 2+ o n the Reaction Kinetics
No information is available on the possible effect of Ca 2 § on the base-catalyzed hydrolysis of cellulose.
RELEVANCE FOR PERFORMANCE ASSESSMENT
In earlier safety assessment studies [1, 9], it was assumed that cellulose was degraded instantaneously and completely to isosaccharinic acid, resulting in high con- centrations of ISA in the cement pore water. From the kinetic data discussed in this work, it is clear that this is not the case. Depending on the DP of the cellulose and on the number of reducing end groups, only a small fraction of cellulose will degrade almost instantaneously to isosaccharinic acid. The rest of the cellulose will de- grade slowly by alkaline hydrolysis. In this section, we calculate the degree of degradation of cellulose (under conditions like those of a L/ILW-repository) caused by the peeling-off reaction and base-catalyzed hydrolysis, based on the information described above.
The parameters needed for calculating the degra- dation of cellulose are the kinetic parameters of the peel- ing-off reaction (k0, the overall stopping reaction (k,), and the alkaline hydrolysis (kob,) and the mole fraction of reducing end groups (Gr)o. As discussed earlier, the mole fraction of reducing end groups depends on the
Review of the Kinetics of Alkaline Degradation of Cellulose 107
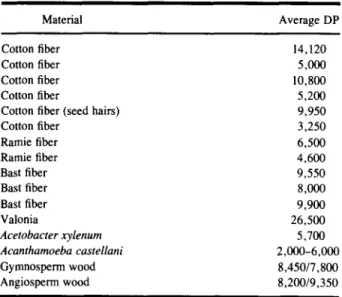
Table IV. Average Degree of Polymerization (DP) of Native
Cellulose of Different Origins (from Ref. 32)
Material Average DP
Cotton fiber 14,120
Cotton fiber 5,000
Cotton fiber 10,800
Cotton fiber 5,200
Cotton fiber (seed hairs) 9,950
Cotton fiber 3,250 Ramie fiber 6,500 Ramie fiber 4,600 Bast fiber 9,550 Bast fiber 8,000 Bast fiber 9,900 Valonia 26,500 A c e t o b a c t e r x y l e n u m 5 ~700 A c a n t h a m o e b a castellani 2,000-6,000 Gymnosperm wood 8,450/7,800 Angiosperm wood 8,200/9,350 ] " ~ ) . . . I . . . I . . . I . . . ~ . . . F . . . I . . . I . . . I . . . I . . .
r 1 further cleavage followed by peeling off-
r
"~ initial peeling off
"~ 0.8 reaction , ~ . - ~ 0.6 o.4 ~ 0.2 U. L , p,,,,,I . . . I . . . I . . . I . . . t . . . I . . . I 10 .3 10 "1 101 10 a 10 s 0 r Time, (years)
Fig. 11. Overall degradation of cellulose with DP = 1000 and having one initial reducing end group per cellulose molecule, at 25~ and 0.3 M O H - as a function of time. The solid line shows the remaining cellulose calculated by Eq. (46) using (Gr)o = 0.001, k= = 3.65 9 10 -2 h -L, kt = 6.91 " 10 -4 h -I, and k,,b~ ' x = 5.25 9 10 -It h -I.
number of reducing end groups and on the the degree of polymerization of the cellulose. The molecular weight (or degree of polymerization) of cellulose and the amount of reducing end groups depend strongly on the origin of cellulose and on the pulping process used. Consequently, it is difficult to predict the extent of cel- lulose degradation without making some assumptions. For the average number of reducing end groups, we take the conservative value of one per cellulose molecule. The molecular weight of native cellulose has been stud- ied intensively. A summary overview is given by Mo- rohoshi [32] and presented here in Table IV. Similar values were also published by Goring and Timell [33]. High-temperature pulping processes (T > 150~ par- tially degrade native cellulose by the hydrolysis reac- tion, decreasing its average DP. The average DP of cel- lulose in paper and cotton lies around 1000-2000. A value of 1000 is taken as a representative value for cel- lulose present in radioactive waste. The kinetic con- stants summarised in Table II for [OH-] = 0.3 M were used and it was assumed that the pH of the cement pore water stayed constant for 106 years.
The degradation reaction starts with the fast peel- ing-off reaction and stops when all reducing end groups have been transformed to stable end groups or reducing end groups no longer accessible to O H - (after about 2 years). The further reactions are then the very slow cleavage of glycosidic bonds followed by a fast peeling- off reaction starting from the newly created reducing end groups. The overall degradation of cellulose for this case can be expressed by combining Eqs. (10) and (43) as
follows:
(cellulose left) = (1 - ( k l / k t ) " ( G r ) o ekobs 9 x, 9 l " (1 - e-k"t)) (46) Figure 11 illustrates the overall degradation of cellu- lose. In this scenario, we have a fast ingrowth of ISA in the cement pore water from the beginning on, reach- ing its maximum value after about 2 years. A further increase in ISA is expected to occur very slowly when the transport of ISA out of the repository is ignored.
Proper assessment of the degradation of cellulose on the fate of radionuclides in a repository requires a more detailed discussion of the concentration of ISA in the cement pore water of a repository. This concentra- tion depends on several factors and processes such as the cellulose loading, the degradation kinetics, the sol- ubility of sparingly soluble Ca-salts of ISA, the sorption of ISA on cement, the stability of ISA under alkaline conditions, and the water flow through the repository. Such a discussion is far beyond the scope of this paper and, therefore, will be discussed elsewhere [34, 35].
SUMMARY
Two processes are involved in the alkaline degra- dation of cellulose: the fast peeling-off reaction and the slow base-catalyzed cleavage of glycosidic bonds (al- kaline hydrolysis).
Based on the kinetic data available for these two processes, the full degradation of cellulose under near-
108 Van Loon and Glaus
field conditions existing in a cementitious L/ILW-re- pository ([OH-] = 0.3 M, 25~ was estimated to take 105-106 years. In the relatively short initial stage, about 1-10% (depending on the degree of polymerization of cellulose and on the average amount of reducing end groups) of the cellulose will degrade by the peeling-off reaction and yield mainly isosaccharinic acid. After this initial stage, the degradation will continue by both base- catalyzed cleavage and the peeling-off reaction, the for- mer controlling the overall reaction rate.
For performance assessment purposes, it can be as- sumed that only a part of the cellulose (1-10%) will degrade in the first 104 years after repository closure in- stead of taking a complete and instantaneous degrada- tion. This can be justified by the kinetic data available in the literature.
The temperature has a large effect on the degrada- tion rate of cellulose. The extent of degradation, how- ever, is affected much less because both the propagation reaction and the stopping reaction are equally sensitive to temperature and the ratio of the two reaction rates determines the extent of degradation. Raising the tem- perature from 25 to 100~ will increase the extent of degradation by 30%. This is important because in the initial stage of cement hydration, the temperature is higher. The effect of temperature on cellulose degrada- tion is limited and hence does not need to be taken into account.
Because of uncertainties in the kinetic data, addi- tional studies on the kinetics of cellulose degradation are necessary. Especially, the effect of Ca 2 § on the peeling- off and stopping reaction and the effect of [OH-] need to be further investigated.
A C K N O W L E D G M E N T S
The authors would like to thank Dr. E. Wieland, Dr. M. Bradbury, and Dr. J. Pearson Jr. (all from PSI) for giving useful comments to improve the manuscript. This work was partly financed by the Swiss National Cooperative for the Disposal of Radioactive Waste (NAGRA).
REFERENCES
1. NAGRA (1994) Endlager far schwach- und mittelaktive Abfdlle
(Endlager SMA). Bericht zur Langzeitsicherheit des Endlagers SMA am Standoff Wellenberg (Gemeinde Wotfenschiessen, NW),
NAGRA Technical Report NTB 94-06, NAGRA, Wettingen, Switzerland.
2. U. Bemer (1990) A Thermodynamic Description of the Evolution
of Pore Water Chemistry and Uranium Speciation During the Degradation of Cement, PSI-Bericht 62, Paul Scherrer Institute, Villigen, Switzerland. (Also published as NAGRA Technical Report NTB 90-12, NAGRA, Wettingen, Switzerland)
3. R. L. Whistler and J. N. BeMiller (1958)Adv. Carbohydr. Chem.
Biochem. 13, 289-329.
4. M. J. Blears, G. Machell, and G. N. Richards (1957) Chem. Ind.
Aug. 24, 1150-1151.
5. G. Machell and G. N. Richards (1960) J. Chem. Soc. A2, 1932-
1939.
6. D. T. Sawyer (1964) Chem. Rev. 64, 633-643.
7. A. D. Moreton (1993) Mater. Res. Soc. Syrup. Proc. 294, 753-
758.
8. B. F. Greenfield, G. F. Holtom, M. H. Hurdus, N. O'Kelly, N. J. Pilkington, A. Rosevaer, M. W. Spindler, and S. J. Williams
(1995) Mater. Res. Soc. Syrup. Proc. 353, 1151-1158.
9. M. H. Bradbury and F. A. Sarott (1995) Sorption Databases for
the Cementitious Near-Field of a L/ILW Repository for Perfor- mance Assessment, PS1-Bericht 95-06, Paul Scherrer Institute, Villigen, Switzerland. (Also published as NAGRA Technical Report NTB 93-08, NAGRA, Wettingen, Switzerland.) 10. K. Okamura (1991) in D. N.-S. Hon and N. Shiraishi (Eds.),
Wood and Cellulosic Chemistry, Marcel Dekker, New York and Basel, pp. 89-112.
11. H. Kr~ssig (1985) in J. F. Kennedy, G. O. Phillips, D. J. Wed-
lock, and P. A. Williams (Eds.), Cellulose and Its Derivatives:
Chemistry, Biochemistry and Applications, Marcel Dekker, New York, Chichester, Brisbane, pp. 3-25.
12. D. W. Haas, B. F. Hrutfiord, and K. V. Sarkanen (1967) J.
Appl. Polym. Sci. 11,587-600.
13. M. Lewin (1985) in J. F. Kennedy, G. O. Phillips, D. J. Wed-
lock, and P. A. Williams (Eds.), Cellulose and Its Derivatives:
Chemistry, Biochemistry and Applications, Marcel Dekker, New York, Chichester, Brisbane, pp. 27-35.
14. F. Neall (1994) Modelling of the Near-Field Chemistry of the
SMA Repository at the Wellenberg Site, PS1-Bericht 94-18, Paul Scherrer Institute, Villigen, Switzerland.
15. E. Sjrstrrm (1977) TAPPI60, 151-154.
16. Y. Z. Lai (1991) in D. N.-S. Hon and N. Shiraishi (Eds.), Wood
and Cellulosic Chemistry, Marcel Dekker, New York and Basel, pp. 455-523.
17. A. R. Procter and R. H. Wiekenkamp (1969) Carbohydr. Res.
10, 459-462.
18. A. R. Procter and H. M. Apelt (1969) TAPPI 52, 1518-1522.
19. J. R. G. Bryce (1980) in J. P. Casey (Ed.), Pulp and Paper,
Chemistry and Chemical Technology, Vol. 1, 3rd ed., John Wiley & Sons, New York, pp. 429-436.
20. V. L. Chiang and K. V. Sarkanen (1984) J. Wood Chem. Tech-
nol. 4, 1-18,
21. J. C. Miller and J. N. Miller (1988) Statistics for Analytical
Chemistry, Ellis Horwood, Chichester.
22. Y. Z. Lai and K. V. Sarkanen (1969) J. Polym. Sci. C 28, 15-
26.
23. R. A. Young, K. V. Sarkanen, P. G. Johnson, and G. G. Allan
(1972) Carbohydr. Res. 21, 111-122.
24. G. Machell and G. N. Richards (1958) TAPPI 41, 12-16.
25. Y. Z. Lai and D. E. Ontto (1979) J. Appl. Polym. Sci. 23, 3219-
3225.
26. T. Vuorinen and E. Sjrstrrm (1982) Carbohydr. Res. 108, 23-
29.
27. R. L. Colbran and G. F. Davidson (1961) J. Textile Inst. 52,
T73-T87.
28. Y. Z. Lai and K. V. Sarkanen (1967) Cellulose Chem. Technol.
1,517-527.
29. Y. Z. Lai (1981) The Eckman Days, Vol. 2. International Sym-
posium on Wood and Pulping Chemistry, Stockholm, June 9-12, pp. 26-33.
Review of the Kinetics of Alkaline Degradation of Cellulose 109
30. O. Franzon and O. Samuelson (1957) Svensk Papperstidning 23,
872-877.
31. Y. Z. Lai (1972) Carbohydr. Res. 24, 57-65.
32. N. Morohoshi (1991) in D. N.-S. Hon and N. Shiraishi (Eds.),
Wood and Cellulosic Chemistry, Marcel Dekker, New York and Basel, pp. 331-392.
33. D. A. I. Goring and T. E. Timell (1962) TAPPI45, 454-460.
34. L. R. Van Loon and M. A. Glaus (1997) in preparation.
35. M. H. Bradbury and L. R. Van Loon (1997) Cementitious Near-
Field Sorption Databases for Performance Assessment of a L/ILW Repository in a Palfris Marl Host Rock, PSI-Bericht (in preparation), Paul Scherrer Institute, Villigen, Switzerland. (Also published as NAGRA Technical Report NTB 96-04, NAGRA, Wettingen, Switzerland.)


![Fig. 5. Degradation of cellulose as a function of time at [OH-] = 0.3 M and 25~ for different degrees of polymerization (DP), The solid lines were calculated using Eq](https://thumb-eu.123doks.com/thumbv2/123doknet/14863066.636112/5.876.457.795.126.365/degradation-cellulose-function-different-degrees-polymerization-solid-calculated.webp)
![Fig. 7. Dependence of rate constants for the peeling-off reaction (k0 and chemical stopping reaction (k2) of amylose on the hydroxyl con- centration at 100~ [22]](https://thumb-eu.123doks.com/thumbv2/123doknet/14863066.636112/7.876.78.417.124.354/dependence-constants-reaction-chemical-stopping-reaction-hydroxyl-centration.webp)