COMPONENT AND FAULT IDENTIFICATION IN A MACHINE STRUCTUPE USING AN ACOUSTIC SIGNAL
by
AFARIN ORDUBADI
MSc. Polytechnic Institute of New York (1976)
SUBMITTED IN PARTIAL FULFILLMENT OF THE REQUIREMENTS FOR THE
DEGREE OF DOCTOR OF SCIENCE
at the
MASSACHUSETTS INSTITUTE OF TECHNOLOGY May 1980
Massachusetts Institute of Technology
II 1980
Signature of Author
Departme of Mechanical Engineering Mfy 2, 1980 Certified by /I Richad H. Lyon Thesis Supervisor Accepted by Warren Rohsenow Chairman, Departmental Committee ARCHIVES
MASSACHUSETTS OF TECHNOLOGY,iNSNiT:T:
JUL 29 1980
LIBRARIES
VI
-2-COMPONENT AND FAULT IDENTIFICATION IN A MACHINE STRUCURE USING AN ACOUSTIC SIGNAL
by
AFARIN ORDUBADI
Submitted to the Department of Mechanical Engineering on May 16, 1980 in partial fulfillment
of the requirements for the Degree of Doctor of Science in Mechanical Engineering
ABSTRACT
Analytical approach to vibration signature analysis for fault detection has been considered impractical because of the dif-ficulties in defining a sufficiently accurate vibration transfer function, VTF. The feasibility of such analysis has been demon-strated in this study by accurate reconstruction of the cylinder pressure of a diesel engine using measured acceleration on the block.
Determining VTF in structures with complicated geometries requires understanding the exact vibration transfer mechanisms in
the machine structures. The vibration on the surface of the machine is the result of traveling wave propagation in the structure as well as formation of resonances because of the reflections from the engine boundaries and interfaces. The VTF of both modes of vibration transfer for the diesel engine studied was modeled. The VTF was measured on a non-running engine and an operating engine. This latter VTF was modi-fied to result in three other VTFs; one representing multipath
propagation, one single path propagation, and one a simple resonance. The five VTFs were used for estimating cylinder pressure from engine block acceleration measured at several operating conditions of the engine. The accuracy of reconstructed cylinder pressures was determined by comparing it with the measured cylinder pressure. The accuracy was evaluated quantitatively using several performance indices.
3
-The estimated cylinder pressures using measured VTF on
non-running and operating engine was satisfactory. However, the most accurate estimate of cylinder pressure was obtained by using the modified VTF which represents multipath propagation. This VTF re-mained unchanged during a reasonable period of engine life under nor-mal wear and was insensitive to variations resulting from re-assembly
of the engines.
Simulated leak of an engine injector and the location of a faulty cylinder was detected using the above method. A technique to separate the effect of secondary vibration sources such as piston slap in engines is suggested. The results of this study can be
generalized for machines other than engines. Possibilities for on-line application of this method is discussed.
Thesis Supervisor: Title:
Richard H. Lyon
4
-ACKNOWLEDGEMENT
In the years to come, I'll remember MIT with pride and a warm feeling toward all the people who helped me during the course of my studies. I am grateful to all of them.
I am honored to have worked with Professor Richard H. Lyon, his wise guidance and intelligent criticism made the research a
rewarding experience for me.
I am grateful for the enthusiasm and active participation of members of my doctorate committee; Dr. Richard R. DeJong,
Prof. H. Paynter and Prof. P. Houpt. Their creative suggestions contributed substantially to the results of this study.
I would like to express my gratitude to J. W. Slack, III, for his technical advice and assistance and in particular for his friendship and moral support, and to M. Toscano for her numerous administrative help and editing and typing the manuscript of this thesis.
The assistance of W. Finley, W. S. Laird, A. Felch and N. Parsons in operating the engine and data acquisition is greatly appreciated.
-5-for providing me the access to computer facilities at RLE and Cambridge Collaborative, Inc. and to G. M. Glass for helping me in using the latter facility.
The encouragement of my family, and especially my mother throughout these years is greatly appreciated.
Finally, there is a special thanks due to Jeanne R. Pamilla, without her I would have never come this far.
This research was partially supported by an ONAC-EPA sub-contract from Cambridge Collaborative Inc. to MIT.
6 -TABLE OF CONTENTS Page 2 ABSTRACT... ACKNOWLEDGEMENT... TABLE OF CONTENTS... LIST OF FIGURES... GLOSSARY OF SYMBOLS... DEFINITIONS... CHADTED 1 NTMTDUICTT CHAPTER II: CHAPTER III MN .I.I...JI...
1.1 Several Studies in Acoustic Signature
Analysis... MODELING THE SYSTEM... 2.1 Modeling the System... 2.2 The Excitation -- Cylinder Pressure... 2.3 Vibration Propagation... 2.3.1 Input Inertance... 2.4 Wave Propagation in the Engine... 2.5 The Resonant Response and the Modes of
the Engine... 2.6 Additional Sources of Excitation in
Engine -- Piston Slap... 2.7 Cepstral Analysis and Echo Removal...
EXPERIMENTAL ESTIMATION OF THE VIBRATION TRANSFER FUNCTION...
3.1 The Vibration Transfer Non-Running Engine... Function of the .... #... ... 0 ... . 4 6 9 14 17 19 26 30 31 35 45 46 48 52 54 55 58 63 :
7
-TABLE OF CONTENTS (CONTINUED)
Page
CHAPTER IV:
3.1.1 Processing Technique... 3.1.2 The Path through the Piston... 3.1.3 The Path through the Head... 3.1.4 The Total Vibration Transfer Path... 3.2 Measurements on the Running Engine... 3.2.1 The Cylinder Pressure... 3.2.2 Acceleration of the Engine Block... 3.3 The Vibration Transfer Function of the
Operating Engine... 3.3.1 The Processing Technique...1 3.3.2 Vibration Transfer Function...1 ESTIMATION OF EXCITING FORCES FROM ACCELERATION....1 4.1 Performance Indices...1 4.2 Inverse Filtering -- Processing Technique,
Stability an Causality...1 4.3 Deconvolution of SVTF from the Engine Block
Acceleration...1 4.4 Deconvolution of DVTF1 from Engine Block
Acceleration...1 4.5 Deconvolution of DVTF2 from the Engine
Block Acceleration...1 4.6 Deconvolution Using DVTF3 and DVTF4...1 4.7 Cepstral Analysis in Estimating Cylinder
Pressure...1 66 67 68 74 79 82 90 99 02 09 15 18 27 31 37 44 48 50
8
-TABLE OF CONTENTS (CONTINUED)
Page CHAPTER V: CHAPTER VI: REFERENCES. APPENDIX A: APPENDIX B:
4.8 Comparison of the VTFs -- Conclusion... VIBRATION ANALYSIS IN FAULT DIAGNOSIS... 5.1 Fault Diagnosis in Engine... 5.2 A Technique to Eliminate the Effect of
Piston Slap... 5.3 Fault Diagnosis in Machine Structure
--Generalization... 5.4 Practical Consideration... CONCLUSION...
THE INSTRUMENTS USED... ENGINE SPECIFICATIONS... 155 159 160 166 171 173 178 184
- 9
-LIST OF FIGURES
No. Page
2.1 Theoretical Cylinder Pressure Trace for a Diesel Engine... 38 2.2 Compression and Combustion Cycles of Cylinder Pressure... 40 2.3 Cepstrum of Measured Cylinder Pressure for John Deere Diesel
Engine... 42 2.4 Cepstrally Windowed Cylinder Pressure -- Samp. #1 7.5
Pressure Measured on Engine Operating at Full Load... 44 2.5 Propagation Impulse Response in 3/16 in Steel at a Distance
of (a) .5 Meters, (b) 1 Meter, (c) 1.5 Meters... 51 3.1 Observation Points on Engine... 62 3.2 Experimental Set Up to Measure Vibration Transfer Function of
Non-Running Engine... 65 3.3a Magnitude of SVTF -- Point 2A to (A) Piston #1, (B) Piston #4.. 69 3.3b Phase of SVTF -- Point 2A to (A) Piston #1, (B) Piston #4... 70 3.4a Magnitude of SVTF -- Point 2B to (A) Piston #1, (B) Piston #4.. 71 3.4b Phase of SVTF -- Point 2B to (A) Piston #1, (B) Point #4... 72 3.5 Magnitude of Measured Input Inertance (A) Piston (B) Cylinder
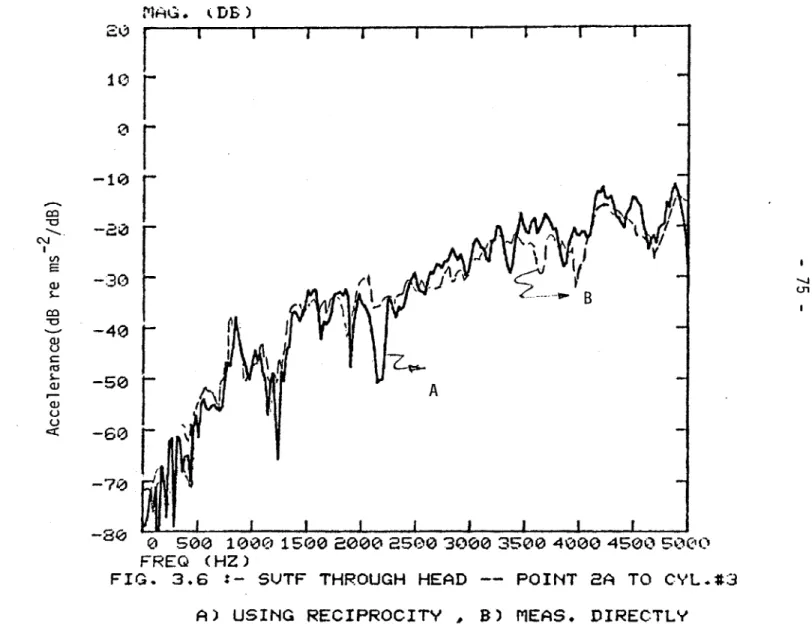
Head... 73 3.6 SVTF Through Head -- Point 2A to Cyl. #3 (A) Using
Reciprocity (B) Meas. Directly... 75 3.7 Magnitude of SVTF through Head -- Point 2A (A) to Cylinder #1
(B) to Cylinder #4... 76 3.8a Magnitude of Total SVTF -- Point 2A to: (A) Cylinder #1,
(B) Cylinder #4... 77 3.8b Phase of Total SVTF -- Point 2A to: (A) Cylinder #1, (B)
Cylnider #4... 78 3.9 Experimental Set-Up for Measurements on Operating Engine... 81
- 10
-LIST OF FIGURES (CONTINUED)
No. Page
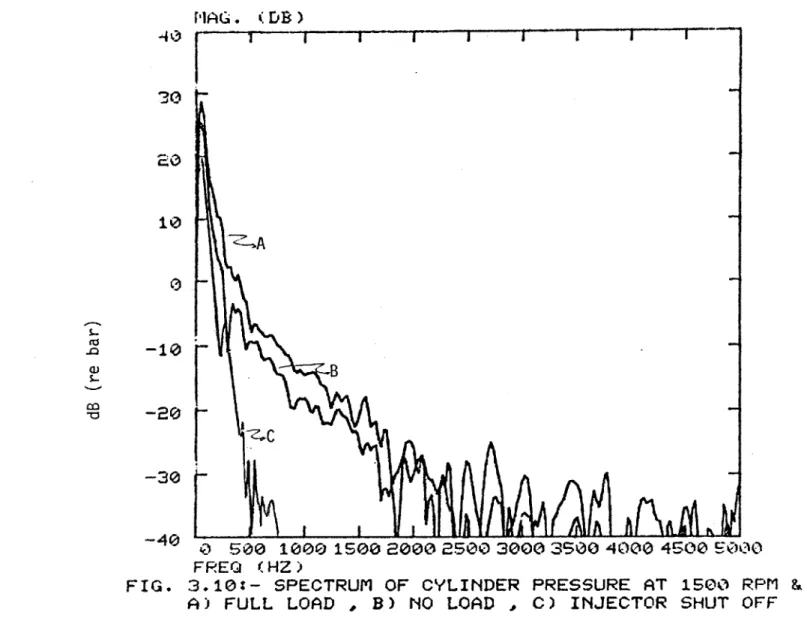
3.10 Spectrum of Cylinder Pressure at 1500 RPM and
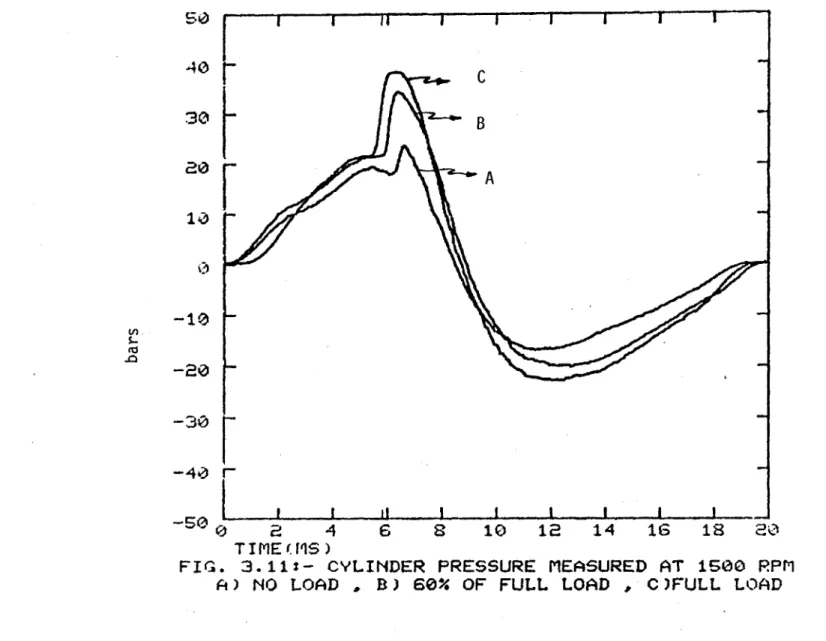
(A) Full Load, (B) No Load, (C) Injector Shut Off... 83 3.11 Cylinder Pressure Measured at 1500 RPM (A) No Load,
(B) 60% of Full Load, (C) Full Load ... 84 3.12 Cylinder Pressure Trace at 2500 RPM and (A) 50% of
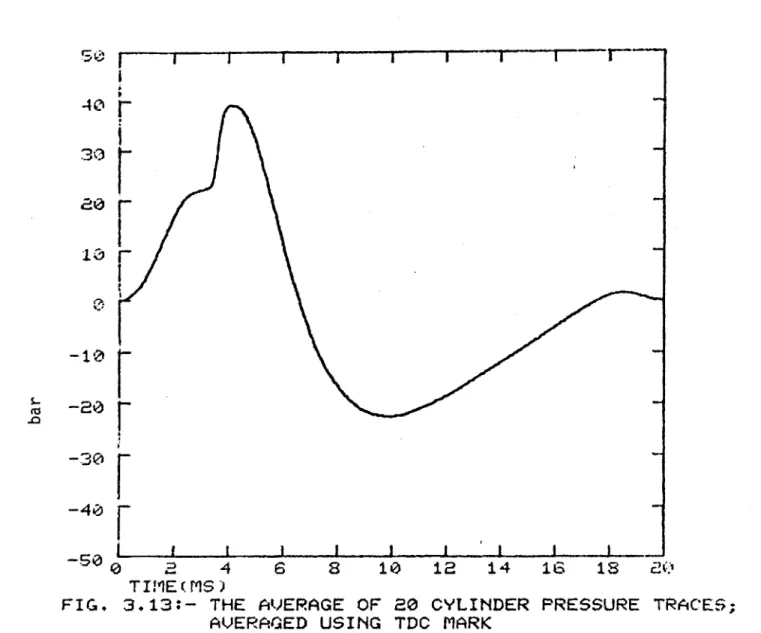
Full Load, (B) No Load... 86 3.13 The Average of 20 Cylinder Pressure Traces; Averaged
Using TDC Mark... 88 3.14 The Average of 20 Cylinder Pressure Traces Averaged
Using Constant Time Gating... 89 3.15 Acceleration at Point 2A, Excited by Firing of Cylinder #4
at 1500 RPM and 60% Load... 91 3.16 Measured Acceleration on Engine for Several Engine
Cycles... 92 3.17 Acceleration at Point 2A --- 1500 RPM and (A) Full Load,
(B) No Load... 93 3.18 Constructed Accel. from the Phase of Measured Accel.
and a Flat Mag. -- Point 2A at 1500 RPM, 80% Load... 94 3.19 Accel. at Point 2A When Injector is Shut the Measured
Cylinder Pressure is also Shown... 96 3.20 Cepstrally Smoothed Acceleration with a Symmetric Window
with Length of 40 Samples... 97 3.21 Acceleration Measured on Points 2A and 2B Simultaneously. 98 3.22 The Flow Chart for Program "PROCESS"... .. 103
3.23 Thresholded Cylinder Pressure... 105 3.24 Flow Chart of Program "CEPSTRA ... 106 3.25 Magnitude of Measured and Model Vibrat. Trans. Function
- 11
-LIST OF FIGURES (CONTINUED)
No. Page
3.26 Unwrapped Phase of VTF -- (A) Point 2A to Cyls. 1 and
4, (B) 3/16 in Thick Steel Plate at Distance 0... 111 3.27 Model Input Inertance ... 112 4.1 Auto Correlation of Cylinder Pressure Along with Two
Estimates of IT -- (A) Using Cor. VTF, (B) Using
Wrong VTF... 122 4.2 Cylinder Pressure High Pass Filtered at 200 Hz... 124
4.3 Estimated Pressure in Cylinder #1 from Accel at Point 2A, using SVTF to (A) Cyl. #1, (B) Cyl. #4
--60% Load... 132 4.4 Estimated Pressure in Cylinder #4 from Accel. at
Point 2A, Using SVTF to (A) Cyl. #4, (B) Cyl. #1,
--60% Load... 133 4.5 Estimated Pressure in Cylinder #4 Using SVTF -- 1500 rpm
No Load... 138 4.6 Estimated Pressure Using DVTF1 at 1500 RPM and 60% Load
in (A) Cylinder #1, (B) Cylinder #4... 141 4.7 Estimated Pressure in Cylinder #1 Using DVTF1
--1500 RPM, No Load... ... 142 4.8 Estimated Pressure in Cylinder #1 from Accel at
Point 2A, Using DVTF1 to (A) Cylinder #1,
(B) Cylinder #4 -- Full Load... 143 4.9 Estimated Pressure in Cylinder #4 Using DVTF1
12
-LIST OF FIGURES (CONTINUED)
No. Page
4.10 Estimated Pressure in Cylinder #1, from
Acceleration at Point 2A at 60% Load -- (A) Using
Corr. VTF, (B) Using Wrong VTF... 146 4.11 Estimated Pressure in Cylinder #1 Using DVTF2
--1500 RPM, No Load... 147 4.12 Pressure in Cylinders #1 and #4, Constructed
from Acceleration Measured Prior to Reassembly
of Engine -- 60% Load... 149 4.13 Estimated Pressure in Cylinder #1 Using DVTF3
--1500 RPM, 60 Load... 151
4.14 Estimated Pressure in Cylinder #4 Using DVTF4
--1500 RPM, 60% Load... ... 152 4.15 Estimated Pressure in Cylinders 1 and 4, Using
Cepstrum -- 1500 RPM, Full Load... 154 5.1 The Effect of Injector Leak on Cylinder Pressure
(A) Normal Cylinder., (B) Small Leak, (C) Large
Leak -- 60% Init. Load... 163 5,2 Estimated Cylinder Pressure at 1500 RPM and 60%
Load (A) Normal Cylinder (B) Cylinder with
13
-LIST OF FIGURES (CONTINUED)
Estimated Cylinder Pressure at 1500 RPM and No Load, (A) Normal Cylinder (B) Cylinder with Injector Leak... Estimated Cylinder Pressure by Predictive Method Using
(A) Model VTF, (B) Cepst. Smoothed VTF -- 60% Load... No. 5.3 154 Page 165 170
14 -A(w) DVTF E (w) F(w) FT I (W) P(W) R. S T SVTF Frequency Impulse response Wavenumber Sample number GLOSSARY OF SYMBOLS Acceleration
Vibration transfer function of operating engine Error Force Fourier transform input inertance Cylinder pressure Correlation Sample variance Sampling period
Vibration transfer function measured on non-running engine
Vibration transfer function Acceleration
Bending phase speed Phase speed Force VTF a(n) cb Cph f(n) f h (n) k n
15
-GLOSSARY OF SYMBOLS (CONTINUED) p (n) p,(n) P2 (n) t u (n) v (n) w(n) S(n) P S Pxl ,x 2 SUBSCRIPTS c d r p Cylinder pressure Compression cycle Combustion cycle Time Unit step Variance Weighting function
Ratio of vibration transfer function for piston slap to vibration transfer function for combustion force
The ratio of piston slap to combustion Kronecker delta
Damping loss factor Error
Surface density
Correlation coefficient of two signals x1 and x2 Radian frequency
Combustion forces Direct propagation Reverberant field Piston Slap
16
-GLOSSARY SYMBOLS (CONTINUED)
Superscript
Estimated signal Cepstrum
17
-DEFINITIONS
Following definitions has been used in this report. Cepstrum(^):
Convolution(*):
Data record:
Discrete time, sample number, n,:
Linear time system, LTI:
Linear constant coefficient difference
equation:
of a signal is the inverse fourier
transform of logarithm of fourier transform of the signal x(n) = FT~(zn F T(x(n)). of two signals, xl(n), and x2(n), y(n) is defined as:
n
y(n) = x I(n)*x 2(n) = Y )x2(k-n).
k=-00
A finite sequence used for processing. Integer multiples of sampling period T. A linear system for which if
y(n) is the response to input x(n), then the response to x(n-k) is y(n-k).
A subclass of LTI systems for which input and output are related by a Mth order difference equation. The impulse response of the system is then represented as the sum of M exponentials
M-1 n
h(n) = Z (bk) k=0
- 18
-DEFINITIONS (CONTINUED) Minimum Phase Signal/
System: Signal:
Sequence, x(n):
A stable system/signal with stable inverse.
A functional that conveys information.
A signal that is defined only for n 'nteger multiples of a sampling period, T. A
sequence or discrete time signal may arise by sampling a continuous signal or may be generated directly from a digial process.
- 19
-CHAPTER I: INTRODUCTION
Early detection of failures within a system is important in preventing further damage to the system and other possible
hazardous consequences. Fault detection and monitoring have been the subject of much research in system dynamics and control. In compli-cated systems, direct access to a particular part of the system is not often possible or practical. In such cases, a transformed
version of the output signal of the subystem under study is measured at the periphy of the system and is used in monitoring its
operation.
If the transformation is broad band and linear, the transformed signal is a replica of the original signal, e.g., the transformation of a mechanical signal to an electrical signal in a transducer. The measured signal is equivalent to the output signal and can be used directly to control the operation of the system. In practice, the transformation is often narrow band, complicated and sometimes nonlinear, such as acoustic emission of signals from cracks. In this case, in order to use the observed signal for
monitoring or fault detection, the effect of the transformationmust be either minimized (recovery of original signal), or the changes in the observed signal must be related to the abnormalities that occur
20
-The observable manifestation of the output signal of a system is sometimes called the signature of the system. When a particular event occurs within the system, the changes in the normal pattern of the system signature is called signature of the event. This system signature can be of any physical nature; optical, electrical, acoustical, etc.
Traditionally, the acoustical signatures of
physical systems are considered good indicators of the operations of the system. Just as doctors use heart beats to diagnose
the status of a patient's health, mechanics "listen" to an engine in order to detect its problems. The vibration signal of a mechanical structure is the result of fluctuating forces acting within the system and the changes in the signature represent the changes in these
forces. The radiation of vibration from surfaces of the machine produces an acoustical signal.
Two methods are used in detection of faults through vibration signals; analytical and data base pattern recognition. The analytical approach is one which relates the features in the ob-served signal to system changes by determining the transformation between the original signal/event and the observed signal. The transfer function TF, of the transformation can be used to recover the original output signal. The major difficulty in using this method is in defining the transfer function in a complex system.
21
-In the data base pattern recognition method, a set of features in the signature which are related to the faults in the system are identified experimentally. Based on measurements taken on "normal" and "faulty" systems, several criteria are established for discriminating between the two. This method is very useful when the exact transformation between the original signal and its
signature is not known, is difficult to find, or when the trans-formation is nonlinear. The disadvantages of the data base method are that accuracy of results require collecting a large amount of data. In addition, the processing usually involves manipulation of large matrices. Also, the uncertainty in associating a particular feature to a particular fault may never be as small as desired. However, the development of fast computers with large memories has made this method very popular.
In seismology, signature analysis has been used to recover the seismic wavelets from the measured vibration signal excited by a source hundreds of miles away. The vibration signal is trans-ferred through the earth. In these studies, the earth is modeled as a layered medium. The properties of impulse response of the earth
is determined. This impulse response is used to deconvolve the re-ceived vibration and to recover the seismic wavelets. The success of these studies show that when the TF of the path system is
known, the analytical approach to vibration signature analysis is feasible. In most machines, determining the vibration transfer
22
-function, VTF, is difficult as a result of the complicated geometry of the machine.
The relationship between fluctuating forces in a machine and vibration of its surface have been the subject of many studies in machinery noise control. The main purpose of these studies is in modifying the vibration trasfer path to reduce the surface vibration and, therefore, the radiated noise. For these studies, an approxi-mate estimation of the magnitude of the VTF is sufficient.
Usually, an error of 3 to 5 dB in magnitude is acceptable and the phase characteristics are neglected. Because of the uncertainty in defining the mechanism of the VTF and the contaminating effect of different sources on surface vibration, some researchers have
stated that recovery of input forces from surface vibration is not practical .
Most studies on vibration signature analysis have been con-centrated on the data base method. Some of these studies, aimed at
finding features to detect particular failure(s) had limited success, especially in monitoring flight instrumentation and nuclear
reactors [2]. However, it is reported that some of the heavily financed programs that attempt to collect a huge amount of data re-garding features to detect faults have failed as a result of a lack of proper analysis.
23
-The aim of this study is to show that modeling an acoustical system with an accurate input-output relationship is feasible. De-termining a vibration transfer function, VTF, for machine that is accurate enough for fault diagnosis purposes does not vary from one run to another is the goal. Such a VTF should be linear, insensitive to practical variation of the machine properties in assembly and remains unchanged during a reasonable period of life of the machine under normal wear. This VTF can be used either in reconstruction of the internal forces of the machine from its surface vibration, or in reflecting the changes in the forces as a result of malfunction on the surface vibration.
The approach of this research is to define a VTF for the machine, to use the VTF in recovery of the input signal from the
vibration at the surface, and to evaluate the procedure by comparing the estimated and measured inputs. When there are ambiguities in-volved in modeling the VTF, several VTFs based on different possible models are determined and the performance of each in accurate re-construction of input under different operating conditions of the machine are evaluated and compared. This approach not only
identifies the best VTF for fault diagnosis, but gives an insight to vibration transfer mechanisms in the machine. This method is suitable for studying a variety of machine structures such as engines, turbines, airplanes, sewing machines, etc. In addition,
24
-the acoustic signature of other physical and biological systems can be analyzed using this method, .e.g., heart beats.
The particular system under study for this research was a four-cylinder naturally aspirated diesel engine. The particular "input" of interest to the system is the combustion force; the ob-served signal or "output" is the block acceleration and the TF is the VTF of the engine between a cylinder and a fixed observation point on the engine. In addition to diagnosis of malfunction in cylinder pressure, the possibility of localizing the faulty component by the above method is investigated. Some of the faults in the engine operation which affect the combustion force or equivalent cylinder pressure, are injector malfunctions and deposits inside the cylinders. In addition, there are malfunctions which are reflected in piston slap, such as piston ring malfunction. The VTF of a machine also changes as a result of a drastic change in mechanical properties such as a crack at the components of the engine which transfer vibration.
The vibration produced by combustion force is transferred to the block through two paths: piston-crankshaft-bearing path and the path through the head
[31.
The acceleration at any point on the engine block is the result of propagated waves as well as there 25 re
-flections from boundaries of the system. The VTF of the engine should represent both the directly propagated waves as well as the echoes. In this study, two types of VTF, one representing propa-gation mode, and the other, resonance mode of the engine Vibration transfer and the combination of both types of VTF are considered. The performance of these VTFs in estimating cylinder pressure is evaluated. Both types of VTF are common in most machine structures.
This study is not concerned with the particular problem of fault diagnosis in diesel engines. Rather it uses the engine to demonstrate the feasibility of fault diagnosis in machine structures using vibration signal(s). ,The engine is a typical example of a machine, and many of the problems encountered in defining VTF and recovering the input forces in engine are similar to those that exist in other complicated mechanical systems. The signal processing techniques used were all general. The classical linear filtering methods which do not rely on any particular properties of the signal were used extensively.
The first Chapter of this report is concerned with review of the previous studies done on related subjects. Chapter II is concerned with modeling the system, input signal and different VTFs. The measurement and processing techniques to obtain VTF on running and non-running engines as well as the determined VTFs is discussed in Chapter III. In all, five VTFs were measured or.-derived from the data.
26
-In Chapter IV, the deconvolution of acceleration signals with the measured/constructed VTFs to obtain estimates of the input cylinder pressure is studied. These estimated pressure signals are compared with the measured pressure signal to evaluate the accuracy of
estimation and the performance of the VTF. The application of this method in fault diagnosis in engines, an algorithm to eliminate the effect of sources other than combustion as well as practical con-siderations in implementing the method are the subjects of Chapter V.
1.1 Several Studies in Acoustics Signatures Analysis
Acoustics signature of a machine has been used to detect the status of the machine for many years. Development of high quality transducers and real time spectrum analysis has made this type of analysis more feasible for industrial usage. In this
section some of the studies on acoustics signatures analysis are mentioned.
The relationship between excessive vibration of a rotary machine and problems such as machine imbalances, misalignments and
improper installation has been studied in classical mechanics. In the past twenty years, industrial usage of vibration level for detection of these faults have increased and several vibration criteria has been developed (4).
27
-Fault diagnosis using vibration level is limited to detection of malfunctions that effect first few harmonics of the exciting forces. A recent study by NASA is concerned with de-tection of bearing failures using high frequency acoustics emission of the bearings [5].
Early detection of failures in nuclear reactors is
essential. Monitoring the core components of a reactor using the noise emission of these components has been studied extensively [6]. These studies were focused on finding a data base pattern
recognition scheme for automatic monitoring of the plant.
Statistical and pattern recognition scheme were also used in quality control of gear boxes. The level and spectrum of the noise generated by the gear box was used to distinguish the faulty gears by an electronic device [7].
As a result of research in speech processing, many new processing techniques such as cepstrum analysis (see definition) has been developed. The usage of this new technique in detection of gear malfunction has been proposed [8].
The changes in transfer characteristics and mechanical impedance of components were also used in diagnosing their failure
28
-One of these studies were concerned with the relationship between the failure of a bearing and its seal and the input inertance of the
bearing support [9]. In another study on off shore platforms, the dynamic response of the platform were used to detect its
structural problems [10].
Undoubtedly the most extensive research on acoustic signature analysis to date has been in the fields of seismology and geophysics. In the past 20 years development of fast computers and the field of digital signal processing has helped the growth of research in these fields.
In seismology, reconstruction of seismic wavelets occurred hundreds of miles from the observation point is desired. It has been shown that when the general characteristics of the path system, in this case, earth,is known, reconstruction of wavelets is possible [11]. In geophysics, accurate determination of the impulse response of the earth is desired for detection of minerals and specially petroleum.
The idea of analytical approach to vibration signature analysis has been initiated by the results of recent studies on correlation between the exciting forces in a machine and is generated noise as well as the research in modeling vibration
transfer function [3]. Studies on relation between generated noise of a diesel engine and engine operating condition have shown a high
29
30
-CHAPTER II: MODELING THE SYSTEM
The machine used for this study is a John Deere Model 419 diesel engine. The engine has four cylinders and is four-stroke, naturally aspirated, and directly injected. The balancing shafts on the engine decrease inertial forces. The "input" signal to the system is defined to be the combustion force, the "output" is the acceleration on the engine block, and the "transfer function" is the vibration transfer function, VTF, between the combustion force and the engine block acceleration.
In addition to the combustion force, there are other sources of excitation in the engine, such as piston slap and the opening and closing of the valves. The most important of these forces is piston slap [13]. Piston slap is more of an impulse-like excitation than is the combustion force pulse.
All of the excitation forces are sequential, i.e., the
cylinders fire one after another, and the acceleration caused by the excitation of one cylinder attenuates before the next cylinder fires. The secondary sources are also sequential. Generally, their time of occurrence is different from that of the combustion force.
The vibration caused by the combustion force propagates throughout the system via piston, crank shaft and bearings, and the engine head. The engine is not an infinite system; therefore,
31
-acceleration at any point on the engine block is the result of direct vibration propagation as well as reflections from the
boundaries of the system. The engine may be modeled as a "reverberant" system if the engine of the reflected vibration waves is higher than that of the directly propagated waves. If the directly propagated vibration energy is dominant, the reverberant vibration is neglected and hence the vibration transfer is treated as a multipath wave propagation in a dispersive medium.
Modeling the engine as a system and the conditions under
which it may be simplified to a single input-single output system is the subject of this Chapter. In addition, the characteristics of the combustion force or equivalent cylinder pressure will be studied. The vibration transfer in the engine and the techniques to measure
it as well as the effects of secondary sources on VTF will be discussed.
2.1 Modeling the System
The engine, in general, is a multi-input, multi-output
system. Its inputs are combustion and other forces, and its output(s) are vibration (acceleration) of a given point(s) on the block. If the study of acceleration at a particular fixed observation point is desired, then the system is single output. The combustion force is sequential and the acceleration, excited by the firing of any
32
-If combustion is the dominant force, in a short time frame of about 1800 crank angle, the engine is treated as having a single input.
As the pistons move, the vibration transfer path of the engine varies slightly. However, the following assumptions are made:
(a) Although the combustion force is not impulsive, the duration of the force signal is short compared with the engine cycle [14].
(b) The variation in the transfer function during
occurrence of cylinder pressure is negligible [15]. Under the above assumptions, we will regard the engine as a linear time invariant system with a single input and a single output. The output acceleration at any observation point, a(n),
is the convolution of input force, f(n), and the system impulse response h C(n) to the force. In a short time window, No, equal to one-half of an engine revolution (1800 crank angle), the acceler-ation is:
a(n) = hc (n) * f(n) N1 < n < N1 + N0 (2.1) where n, discrete time (sample number) is equal to t/T and T is sampling period, N1 is the firing time of a particular cylinder, and the convolution of two signals is defined as:
33
-h a(n) = Z j=0
f(j) h c(n-j)
In order to account for the effect of all of the cylinders, a(n) is defined as:
4
a(n) = h (n)*f(n) 1=1
(2.2)
where fi(n) is the force inserted by the cylinder i and h.(n) is the impulse response of the system to a force applied at cylinder i. The force f. is proportional to pressure in cylinder i when cylinder fires; once every full cycle of engine, which in a four stroke engine is two revolutions. The force is zero otherwise. In each engine full cycle f. is:
f c a cylinder pressure (k-1) N0<n<kN0
k = 1,2,3,4 (2.3)
0 otherwise
where k is an integer that defines the firing order. Deere engine under study, the firing order is 1-3-4-2. the relation between i and k is as follows:
For the John Therefore,
34 -for k = k= 2 k =3 k =4 i= 3 i= 4 i= 2
To account for variation in the transfer path during combustion h(n) may be defined as time-invariant. In measuring VTF on non-running engine, h(n) is assumed to be time invariant.
The effect of forces other than combustion may be taken into account by modifying Eq. (2.2) to result in Eq. (2.4):
4 P
a(n) = I I
i=l k=1 fik(n) * hik(n) + (n)
where fik is the excitation force, hik is the time variant impulse response of VTF between observation point and diffferent force inputs
35
-and (n) is noise. The f ik's are of the general form of Eq. 2.3.
2.2 The Excitation -- Cylinder Pressure
The combustion in the cylinder is the principal excitation force in an operating engine under load. This force is associated with cylinder pressure of the operating engine:
f(n) = p(n) dA A
where A is the area of the piston top and p(n) and f(n) are cylinder pressure and the combustion force.
The variation of the cylinder pressure has the following five stages [16]:
(1) The Compression Cycle. During the early part of the process, before the injector opens, the air in the cylinder is compressed and pressure rises slowly. (2) Ignition Delay. After the injector valve opens, the
fuel is injected into the cylinder; however, the temperature is not high enough to cause ignition. The pressure may drop in this stage.
(3) Heat Release. Combustion occurs and pressure rises very rapidly (knocking).
- 36
-(4) Slow Burning. After a period of rapid pressure rise, fuel burns slowly, pressure rises slightly or stays steady.
(5) Pressure Drop. The expansion cycle begins and pressure drops rapidly.
The total pressure cycle last for about 900 crank angle. Typically, the pressure cycle starts at 20* crank angle before top dead center, TDC, and ends 600 to 70* crank angle after TDC (Fig. 2.1).
The pressure signal may be divided into two parts:
compression and combustion. The compression cycle varies slowly with crank angle. The combustion cycle has a short duration and
fluctuates rapidly. The operating condition of the engine affects the compression and the combustion cycles as well as the relative timing between the two. One cycle of the pressure signal, p(n) may be defined as:
p(n) = Alpl(n) + A2 2(n) u(n-n.) (2.5a)
where p,(n) is compression cycle, p2(n) is the combustion cycle, A 1 and A2 are gain factors, nk in the initiation of combustion and u(m)
is the step function
1 0 < m u(m) =
w
TABLE 2,1: PARAMETERIC REPRESENTATION OF CYLINDER PRESSURE
A; at 1500 rpm N S 256 Load (%) Full load 100 60 0 B: N5 50 0 at 2500 rpm = 160 Compression Cycle ,
A
1 (bar) 25 24.3 21.8 50 32.8 a a1 a2 a3 .7 .98 .8 .8 .7 .96 .8 .82 .7 .97 .8 .85 .7 .98 .83 .82 .7 .46 .81 .86 A2 n (bar) 50 41 46 51 14 72 37.14 32 14.2 56 Combustion Cycle b2 b .7 .7 .7 .7 .7 mag. .98 .98 .98 .93 .95 phase (rad x *b2 is a complex number 1 3) U~) 3.14 3.77 6.01 9.4 6.3 w 'p 0V30
T
(9919eb)
3JOA
AIMA
13
9rqpn3 9g29r-0 6 0i 9J5"T 9,U229iq i9bnrfyj Fo rls ioodT
0& G
001
%0& coE
l+
Os 0w
-o
08 :r.s 9-1001 0 a- 39
-The parameters Al, A2, P2(n) and n. are affected by the operating condition of the engine and its abnormalities. Detection of these parameters are important in diagnosing engine malfunction, e.g., the presence of deposits in the cylinder will decrease both A and A2; incorrect injector timing will effect n ; abnormalities in
injection system will change p2(n) and n.. The parameters are also affected by the load on the engine under normal conditions (see Chapter III). The measurements, as well as a literature study [17 ] indicate that the shape of the compression cycle does not change significantly with the operating condition of the engine.
For the John Deere engine, p(n) at different operating
conditions may be modeled from the measured cylinder pressure. The compression cycle, pl(n) is modeled by measuring the cylinder
pressure when the injector is shut off, therefore, no combustion occurs. The other parameters are found by measuring cylinder
pressure of the engine, operating at 1500 rpm and no load, as well as at 60% and 90% of full load.
The compression cycle, p,(n) is modeled with the first four harmonics of firing frequency wf (Fig. 2.2). The signal is not minimum phase and is rotated in time [18]:
3
pl(n) = I ak exp [jwfkT(n-ns)1 +ao (2.6) k=l
0p' compression combustion 0 2 4 TIME(MS) FIG. 2.2:-iI I I I I I I I 6 8 10 1a 14 16 Is 20
COMPRESSION AND COMBUSTION CYLINDER PRESSURE I 40 30 20 U) -o -30 --40 0p -50 CYCLES OF
or
41
-p2(n) is modeled with two poles and is minimum phase.
p2(n) = (b, )n + bo
(2.7)
The measured values of ak's, bk's and A1 and A2 for the engine operating at 1500 rpm under different loads is given in Table 2.1.
Changing speed will change the fundamental frequency of cylinder pressure. For p1(n) all frequency components will shift, but the combustion cycle p2(n) does not change significantly. The parameters found for the cylinder pressure measured at 2500 rpm is also given in Table 2.1.
Equation 2.5 is not a unique mathematical representation of the cylinder pressure. Another possible model for cylinder
pres-sure results from studying the cepstrwn of the signal [18]; The cepstrum of a signal is the inverse fourier transform of the
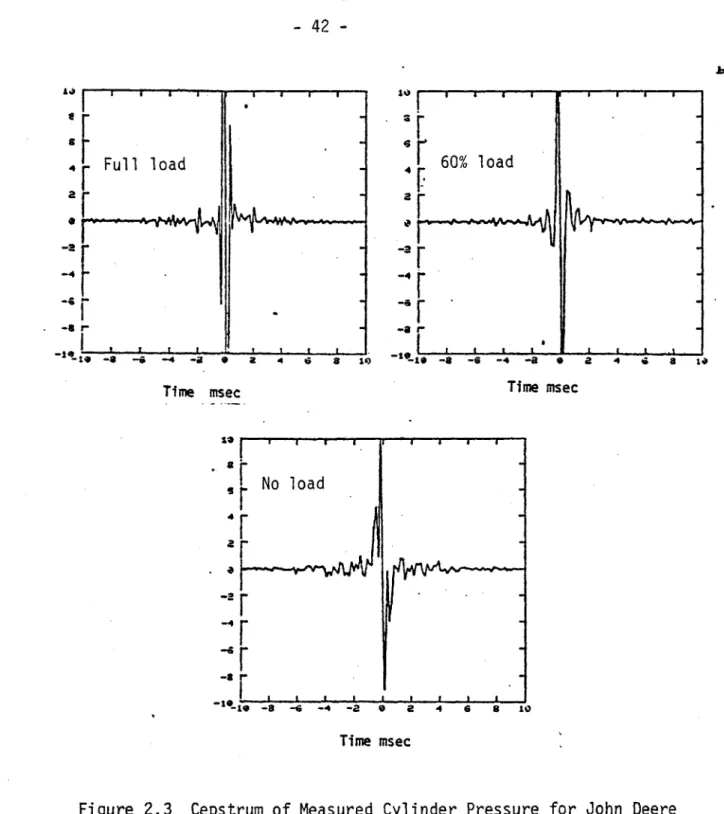
logarithm of its fourier transform. The cepstra of cylinder pres-sure under different loads (Fig. 2.3 ) depend on load for sample number, n, less than 100 and especially for 25 <n< 75. This ob-servation suggests that the cepstrum of cylinder pressure, p(n) can be modeled as the sum of two functions, p(n) and P(n) of which only pa(n) depends on load:
- 42 -jb 1. 4 Full load Time msec I I~ I I I I 4 6 8 4 -a -4 -4 -a 1')
r
60% oad
r
1T -8 -6 -4 -a Time S I a a msec No load -4 r -8 6 ie 4 6 8 10 Time msecFigure 2.3 Cepstrum of Measured Deisel Engine
(a) Full load (b) 60% load (c) No load
Cylinder Pressure for John Deere
-- 43
-where
P (n) = 0 for n> 75
pa(n) = 0 for n< 75.
The two signals can be easily separated by windowing p(n).
If p (n) and p (n) were the cepstra of the signals pa(a)
and p (n), taking the inverse cepstrum of both sides of Equation 2.6 will result in representing p(n) by convolution of the two signals
pa(n) and p (n):
p(n) = pa(n) * p (n) (2.9)
pa(n) is shown in Fig. 2.4.
The physical significance of p a(n) and p (n) is not clear at the present time. The spectrum of pa(n) varies slowly with frequency while the spectrum of p (n) is similar to that of a combination
filter and is periodic in frequency. This type of representation is useful in cepstral analysis of the acceleration (Section 5.4) Although cepstral domain analysis is a promising technique in
diagnosing faults in engines, a better knowledge of pressure signal is necessary before cepstral analysis can be applied successfully to fault detection problems. Special emphasis in understanding
0
so
40 30~ 20 ioj (A --20 -40 I I I I I I IK
2 4 6 8 10 12 14 16 TIME(MS)FIG. 2.4:- CEPSTRALLY WNDOWED CYLINDER PRESS. PRESSURE MEASURED ON ENGINE OPERATING AT
18 20 -- sAmp.# <
75
FULL LOAD W w 0 10 4:r-I45
-the combustion process and modeling variation of cylinder pressure with the operating condition is required.
2.3 Vibration Propagation
The vibration induced by the combustion force propagates through the engine to the block. The two major paths of propa-gation are: the piston-crank shaft-bearings and the head. The engine is both dispersive and finite. The reflections from the boundaries of the system form standing wave patterns and a reverber-ant field results. Acceleration at any point on the engine block is the sum of the directly propagated and reflected waves.
The average length of the directly propagated waves are shorter than that of the reflected ones. If boundaries of the system are far from the observation point and the system is moderately damped, directly propagated vibration is dominant. Similarly, when a medium with slow phase speed is excited by a transient force, the early part of resulting vibration is the directly propagated wave. However, if the attenuation in such a medium is low, as the number of reflections (echoes) increase and the medium responds as a reverberant system. Direct and
reverberant vibration is analogous to transient and steady responses of a system.
46
-The impulse response of the engine to the combustion force, h c(n) in Eq. 2.1 may be written as the sum of two impulse responses; one for propagated waves, hd(n), and one for the resonant response, h r(n)
hr(
hc (n) = hd(n) + hr(n) (2.10)
Eq. 2.1 will thus change to:
a(n) = p(n)*hd(n) + p(n)*hr(n) = ad + ar
where ad and a r are the "direct" and "reverberant" accelerations. In the frequency domain, the response to combustion forces, Hc(w) will be
Hc(w) = Hd(w) + Hr(w)
where Hd(w) and H r(w) have the forms of the transfer functions of an infinite dispersive medium and a finite reverberant system, respectively.
2.3.1 Input Inertance
Both Hd(w) and H r(w) are modeled as the product of an input inertance and a vibration transfer function. The input
- 47
-force. The acceleration transfer function, AT , is the relationship between input and received accelerations:
H(w) = I(w). AT(w) (2.11) where
A.
(o)
I(o) = in Fin(W andA
(e)
AT(w) = out in wwhere Ain (c), A out() and A out() and F in() are Fourier transforms of input, output accelerations and input force, respectively.
The effect of system boundaries on input inertance is neglected and I(w) is assumed to be the same for both vibration transfer modes of the engine; direct and reverberent. Measurements support this assumption (see Chapter III).
Predicting input inertance of the engine requires the knowledge of the reaction of the excitation surfaces to the com-bustion force. The force acts on the piston top and head
simultaneously. Major problems in finding I(w) are in defining geometrical distribution of cylinder pressure and the local reaction of piston top and head to the pressure. A theoretical solution to these problems is beyond the scope of this thesis. Measuring the
- 48
-input inertance for piston path as well as head (Chapter III) showed that:
(a) Input inertance to both paths are similar
(b) At low frequencies, below 1 kHz, I() behaves as a stiffness. The behavior of the input inertance at frequencies above 3 kHz approaches that of a mass. In the region 1 to 3 kHz, I(w) has two very damped resonances at 1500 Hz and 2500 Hz.
(c) In addition to these two resonances, input inertance to the piston path shows a damped resonance at 3 kHz. In general, input inertance of the engine is similar to that of a thick finite plate [19].
2.4 Wave Propagation in the Engine
The vibration generated at the piston/cylinder top propa-gates through many paths. The acceleration at any point on the block is the sum of the vibration transmitted through these paths, each with a different length and arrival time. Each path may contain several sections, each with a different phase speed. In addition, several types of waves, such as longitudinal, bending or torsional, may be excited simultaneously and propagated in each path or section of a path.
49
-The transfer function at a distance xi from the source -j (W,x i)
VT(,,x) = JVT(,x ) e where 1VT(w3 xi)j denotes the magni-tude and p(w,x.) is the phase of transform function. The phase of transfer function is:
(Wix ) = kx (2.12)
where the wavenumber k equals w/cph and cph is phase speed.
Bending waves are likely to be the dominant waves propa-gated below 2500 Hz in the engine. The phase speed of being waves Cb is:
B) 1/4 1/2
where ps is the surface density of the medium, and B = (Eh3/12(1-v 2 is the bending rigidity for a plate, where E is Young's modulus, h is the plate thickness and v is Poisson's ratio.
The phase of the transfer function for bending wave propagation is:
- 50
-Q 1/4 1/2
$(Wxi)=
(
) xiW (2.13)The magnitude of vibration transfer function, at distance x from the source, IVT(w,xi), depends on the damping loss factor, n of the medium and geometrical spreading:
|VT(w,x )| : exp (4.27 cbxin/w) (2.14)
where r is a function of the geometry of the system.
The propagation impulse response h p(n,x.) is the inverse Fourier transform of VT(w,xi). The impulse response for discrete time, n, is hd(n,xi) = hd(t=nT,x ) when n is an integer and T is
the sampling period. Neglecting frequency dependence of the magni-tude:
1/4 -3/2 1/2 2
hd(n,x ) a 3 n exp
(
/ T)
(2.15)1 2/+ T3 4 T n
The phase of transfer function and impulse response for several distances of .5, 1, 1.5, and 2 meters are plotted in Fig. 2.5. The propagation impulse response of the engine point on the engine block is the sum of impulse responses of different direct paths. The paths are those that are permissible by the engine geometry:
v A 10[ B
L
0
2 4 8 10 12 14 16 iS R. TIIE(M$)FIG. 2.5:-- PROPAGATION IMPULSE RESPONSE IN 3/16 INCH THiC' STEEL PLATE AT A DISTANCE OF (A) .5 M, (B) I N, (C1 1.5 v
52
-The impulse response of a point on the engine block is the sum of impulse responses of different paths. The paths are those that are permissible by the engine geometry:
h (n) = h (n,x.) . (2.16)
p ~ P 1
The path lengths vary between the shortest path permissible by geometry xs, and the longest path xe, possible in the time window, t , xe < twcb. The vibration propagated through the piston path is typically transferred via different bearings, there-fore, the path may be determined. Propagation through the head is much more complicated.
2.5 The Resonant Response and the Modes of the Engine
The transfer function of a resonant system, H(w) may be represented by its resonances and anti-resonances:
r-(WiW)2 + jwr.)
H ) = 1 (2.17)
r i ((W-)2 + jwr
where wi and w. are anti-resonance (zero) and resonance (pole) frequencies and r. and r. are losses in these frequencies. The relation between r and damping loss factor n is
53
-Poles and zeroes of the engine depend on its resonance modes and mode shapes. In general, calculating these modes for an engine is
complicated. Modeling the engine as a cascade of two port
sub-systems, each having simple modes and mode shapes, is a good way to analyze the complicated system. These subsystems are the parts of
the engine which participate in transmitting the vibration, such as piston, crank shaft, bearing and the block.
If the transfer function for a dispersive medium is added to Eq. 2.17, total VTF, Hr(qx) results:
Hq
t
i~((w-w)2 + jwrj)Hr(Wx) = re + (2.19)
The phase shift q in general is a continuous and monotically varying function of frequency. Experimental measurements of
vibration trasnfer function, VTF, is consistent with this model and shows a monotonically increasing phase.
The transfer function H(w,x) as represented by Eq. 2.17 is a minimum phase function. Therefore, its phase and magnitude are the Hilbert transform of each other [18]. The knowledge of either of the two, phase or magnitude, will define the other.
54
-2.6 Additional Sources of Excitation in Engine -- Piston Slap
Sources of vibration in an engine other than the combustion pulse are inertial forces, piston slap, valve opening/closing and other mechanical noises. The most important of these secondary forces at frequencies higher than several times firing frequency is piston slap. The characteristics of piston slap and the transfer paths between the force and the engine block has been and continues to be studied [20]. Some of the properties of piston slap are:
(a) Piston slap is an approximately impulsive source with a broad band spectrum.
(b) The magnitude of the force depends on speed, but its dependence to load is much less than that of the combustion force.
(c) Piston slap occurs 100 to 200 crank angle after TDC.
(d) The dominant transfer path for piston slap is through the top of the block.
These properties can be used to reduce the effect of piston slap; (b) and (d) are useful in selecting an operating condition and an observation point where the effect of piston slap on measured acceleration is minimal, and (a) and (c) suggest pro-cessing techniques to separate the effect of piston slap from combustion.
- 55
-Eq. 2.4 for two sources of excitation; combustion p(n) and piston slap, s(n) becomes
a(n) = p(n) * h p(n) + s(n) * h s(n) (2.20)
Piston slap can be used in diagnosis of faults in an engine, e.g., in the detection of a damaged ring. However, such an application requires better acknowledge of the piston slap and its transfer function. In this study, piston slap is treated as a noise rather than a signal. Reducing the effect of piston slap on meausured acceleration by proper selection of observation points and operating conditions as well as using special processing
techniques will be discussed.
2.7 Cepstral Analysis and Echo Removal
The impulse response of the engine to combustion forces h c(h) may be defined as the convolution of an impulse response representing the propagation in the medium, h (n), and a series of pulses renresenting multiple propagation paths and the reflections, hr(n); h (n)= h (n)* h (n) (2.21) c d r where hr(n) = 1 + ' a'k 6(n-nk) nk = integer (2.22) k
56
-The h d(n) for a dispersive media is the same as Eq. 2.15. In thefrequency domain the relationship between the Fourier transforms
of h c(n), h (n) and hr(n) or Hc(w), Hd (w) and Hr(w) are:
H c(w) H w .W
Hc~ =Hd(w) H(1)
H (w) H ( 1+-jnk (2.23)
Hc
)
=Hd(w
eJ+ nkak
Taking complex logarithm for both sides results in
ln Hco) = ln H (w) + ln [1 + a e jwnk (2.24) k k
The inverse Fourier transforms for both sides are the cepstra of the three impulse responses: hc (n), hr (n) and hd(n) [18]
hc (n) = hr (n) + hd(n) (2.25)
The cepstrum of a series of pulses is itself a series of pulses [11]. Therefore, hd( n) has the form:
hd(n) = 1 + [ rk 6(n-nk) (2.26)
k
The hd(n) tends to occupy the high time portion of the hc (n) while h p(n) is more concentrated around the origin. It should be noted that
- 57
-the cepstrum of impulse response of a dispersive medium of -the form of Eq. 2.15 spreads into the high time portion. However, the energy of the cepstrum is small when the value of n is large.
Eq. 2.25 suggests a very effective way to distinguish between reflected and propagated impulse responses. If nk' s are known, a cepstral domain filter may be designed to eliminate hd (n). This method is likely to be useful in removing reflected waves. The acceleration on the enaine block results from combining 2.26 and 2.1
in cepstrum domain:
a(n) = b(n) * h r(n) * hd(n) (2.27)
The cepstrum of the cylinder pressure p(n) spreads over both low and high time regions. Therefore, windowing a(n) will not deconvolve the signal. However, we will see that a combination of cepstral windowing/filtering and short time fast deconvolution gives good results in estimation of the combustion force and detection of fault in cylinder pressure.
- 58
-CHAPTER III: EXPERIMENTAL ESTIMATION OF THE VIBRATION TRANSFER FUNCTION
Determining the vibration transfer function, VTF, of a complicated system such as an engine requires the thorough know-ledge of transfer mechanisms and paths. One way to determine the VTF is to measure it. The measurements can be done by externally exciting the non-running engine with a known force and measuring block acceleration. On an operating engine, the VTF may be found by simultaneous measurements of cylinder pressure and block acceleration.
In this chapter, measuring VTF on both non-running and operating engine will be discussed. The data on the operating engine was also used to estimate the combustion force from block accel erati on.
The engine under study was a John Deere 4219 diesel. The engine has four cylinders with direct injection and is naturally aspirated. The VTF of operating engine, DVTF1 has been estimated under several load/speed conditions.
The VTF of the non-running engine, SVTF, was estimated by exciting the engine on the piston and measuring both the applied force and the resultant acceleration. The SVTF between all four cylinders and a number of observation points was measured.
59
-The cylinder pressure of the operating engine and the block acceleration were also measured in synchronization with a timing mark at TDC of piston #1. This set of data provided the timing information between the pressure/acceleration and the crank position.
The errors associated with measuring VTF on a non-running engine are as follows:
(a) The excitation force applied to the engine, e.g., by a shaker, is usually a point source, while the combustion force is distribution over the piston and the top of combustion chamber.
(b) The VTF is measured for one crank position, i.e., TDC.
kc) The behavior of VTF may be affected by the changes in the environmental condition of the operating engine such as temperature-and motion-caused stress and flow of different fluids.
Experiments have shown that changes in crank angle position of up to 40' does not affect the VTF significantly. The errors caused by applying the point force may be reduced by measuring VTF for several force locations and averaging the VTF.
60
-Measuring VTF on an operating engine eliminates the errors discussed. Unfortunately, the VTF determined on a running engine, DVTF, is contaminated by the effect of secondary vibration sources, especially piston slap. Reducing the effect of piston slap requires studying the characteristics of piston slap and the VTF associated with it, VTP.
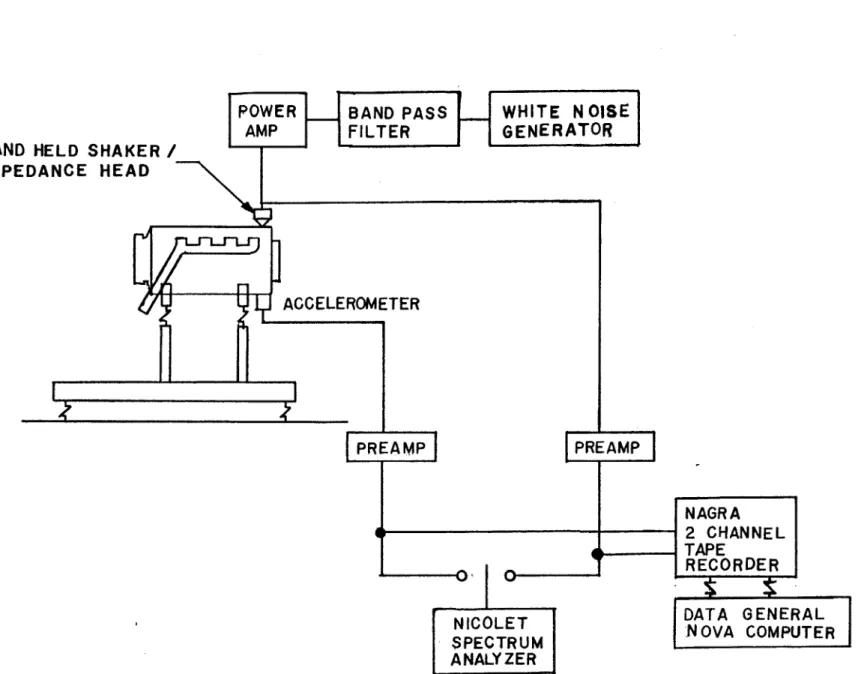
All of the measurements were recorded on a two channel Nagra tape recorder (see Appendix A). Data was processed on a Data General Nova computer with a 10 bit A/D converter. The sampling rate was
12.5 kHz. To avoid aliasing, the data was low pass filtered at 4 kHz. In addition to the two measured VTF's, variations in DVTF1 resulted in three other VTFs; one representing multipath direct propagation, DVTF2; one representing single path direct propagation, DVTF3; and one representing simple resonance DVTF4.
(See Table 3.1).
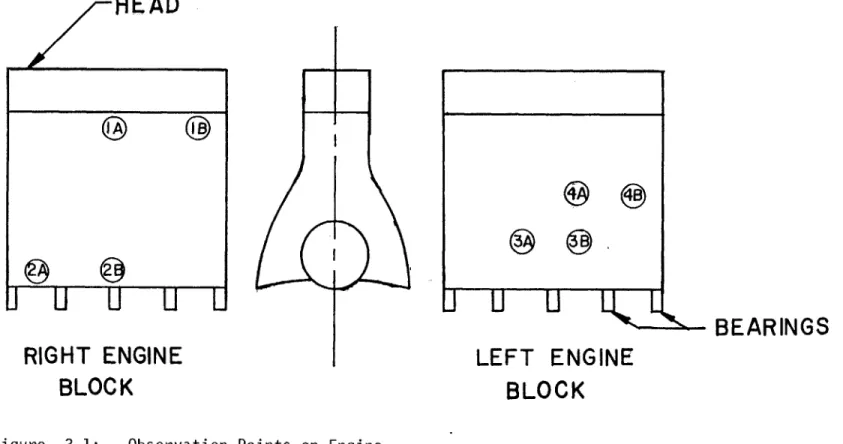
Four pairs of observation points were selected on the engine block (Fig. 3.1). The two points of each pair were on alternate cylinders, i.e., one and three or two and four. Two of the pairs: 1 and 2, were on the right engine block; the other
two pairs were on the left engine block. The first pair of points: la and lb were on the top of the engine block where the vibration will most likely be transferred through the head. The second pair of points were on the skirt of the engine, directly
61
-TABLE III-I
-DESCRIPTION OF DIFFERENT VIBRATION TRANSFER FUNCTIONSVTF
VTF Description
SVTF VTF measured on non-running engine DVTF1 VTF measured on operating engine
DVTF2 Represents multipath propagation, derived from data DVTF3 Represets single path propagation derived from
data
w
HEAD
J
U
U
UL
RIGHT ENGINE
BLOCK
BEARINGS
LEFT ENGINE
BLOCK
Figure 3.1: Observation Points on Engine
- 63
-on the bearings, where the pist-on path ~should be dominant. The other pairs were on the middle of the engine block. The VTF from all four cylinder/pistons were measured to all observation points.
3.1 The Vibration Transfer Function of the Non-Running Engine Two major vibration transfer
through the piston-crank-shaft bearing The SVTF of both paths were measured. by adding the two paths together.
When the non-running engine is the acceleration in frequency domain, A(w)
paths in the engine are and the cylinder head. The total SVTF was obtained
excited by a force, F(,), is:
F(w) = A(w) H(w) (3.1 )
The H(w) defined in Eq. 3.1 is for an applied point force. To estimate the cylinder pressure, H(w) should be corrected for the piston surface.
To excite the non-running engine, either an impulsive source or white noise is used. Using an impulse to measure the
im-pulse response is especially appropriate in studying the propagation transfer function. Using white noise excitation will emphasize steady state or the resonance response. However, the phase information in this type of measurement may be used to modify the measured transfer function