HAL Id: cea-02132948
https://hal-cea.archives-ouvertes.fr/cea-02132948
Submitted on 17 May 2019
HAL is a multi-disciplinary open access
archive for the deposit and dissemination of
sci-entific research documents, whether they are
pub-lished or not. The documents may come from
teaching and research institutions in France or
abroad, or from public or private research centers.
L’archive ouverte pluridisciplinaire HAL, est
destinée au dépôt et à la diffusion de documents
scientifiques de niveau recherche, publiés ou non,
émanant des établissements d’enseignement et de
recherche français ou étrangers, des laboratoires
publics ou privés.
radioligand
18
F-DPA-714 uptake in the brain of
genotyped healthy volunteers
Sonia Lavisse, Daniel Garcia-Lorenzo, Marie-Anne Peyronneau, Benedetta
Bodini, Claire Thiriez, Bertrand Kuhnast, Claude Comtat, Philippe Remy,
Bruno Stankoff, Michel Bottlaender
To cite this version:
Sonia Lavisse, Daniel Garcia-Lorenzo, Marie-Anne Peyronneau, Benedetta Bodini, Claire Thiriez, et
al.. Optimized quantification of translocator protein radioligand
18F-DPA-714 uptake in the brain of
genotyped healthy volunteers. Journal of Nuclear Medicine, Society of Nuclear Medicine, 2015, 56
(7), pp.1048-1054. �10.2967/jnumed.115.156083�. �cea-02132948�
Optimized Quantification of Translocator Protein
Radioligand
18
F-DPA-714 Uptake in the Brain of
Genotyped Healthy Volunteers
Sonia Lavisse1,2, Daniel García-Lorenzo3,4, Marie-Anne Peyronneau5, Benedetta Bodini3–6, Claire Thiriez1,2,7, Bertrand Kuhnast5, Claude Comtat5, Philippe Remy*1,2,7,8, Bruno Stankoff*3,4, and Michel Bottlaender5,9
1CEA-DSV-I2BM, MIRCen, Fontenay-aux-Roses, France;2CNRS-UMR9199, Universités Paris-Sud and Paris-Saclay,
Fontenay-aux-Roses, France;3Institut du Cerveau et de la Moelleépinière, Inserm-U1127 and Sorbonne University, UPMC-UMRS-1127, Paris,
France;4CNRS-UMR7225, Paris, France;5CEA-DSV-I2BM, SHFJ and IMIV, UMR1023 Inserm/CEA/Paris-Sud University, Orsay,
France;6Department of Neuroimaging, Institute of Psychiatry, King’s College London, London, England;7Neurology Department,
Centre Expert Parkinson, CHU Henri Mondor, AP-HP, Créteil, France;8Paris-Est University, Créteil, France; and9CEA-DSV-I2BM,
Neurospin, Gif-sur-Yvette, France
Translocator protein (TSPO) is expressed at a low level in healthy brain and is upregulated during inflammatory processes that may occur in neurodegenerative diseases. Thus, TSPO may be a suitable in vivo indicator of neurodegeneration. Here, we quantified the18
F-DPA-714 radioligand in healthy TSPO-genotyped volunteers and developed a method to eliminate the need for invasive arterial blood sampling. Methods: Ten controls (7 high-affinity binders [HABs] and 3 mixed-affinity binders [MABs]) underwent18F-DPA-714 PET with
arterial and venous sampling.18F-DPA-714 binding was quantified
with a metabolite-corrected arterial plasma input function, using the 1- and 2-tissue-compartment models (TCMs) as well as the Logan analysis to estimate total volume distribution (VT) in the regions of
interest. Alternative quantification methods were tested, including tissue-to-plasma ratio or population-based input function approaches normalized by late time points of arterial or venous samples. Results: The distribution pattern of 18F-DPA-714 was consistent with the
known distribution of TSPO in humans, with the thalamus displaying the highest binding and the cerebellum the lowest. The 2-TCM best described the regional kinetics of 18F-DPA-714 in the brain, with
good identifiability (percentage coefficient of variation, 5%). For each region of interest, VTwas 47.6%± 6.3% higher in HABs than in
MABs, and estimates from the 2-TCM and the Logan analyses were highly correlated. Equilibrium was reached at 60 min after injection. VTcalculated with alternative methods using arterial samples was
strongly and significantly correlated with that calculated by the 2-TCM. Replacement of arterial with venous sampling in these meth-ods led to a significant but lower correlation. Conclusion: Gen-otyping of subjects is a prerequisite for a reliable quantification of
18F-DPA-714 PET images. The 2-TCM and the Logan analyses are
accurate methods to estimate18F-DPA-714 V
Tin the human brain of
both HAB and MAB individuals. Population-based input function and tissue-to-plasma ratio with a single arterial sample are promis-ing alternatives to classic arterial plasma input function. Substitution with venous samples is promising but still requires methodologic improvements.
Key Words: PET; 18F-DPA-714; genotyped human; TSPO;
quantification
J Nucl Med 2015; 56:1048–1054 DOI: 10.2967/jnumed.115.156083
N
euroinflammation is implicated in many neurodegenerative diseases and microglial activation is suspected to play a role in the central nervous system (1). The identification of a PET radiotracer that can detect the microglial activation could prove to be a useful noninvasive approach to facilitate the characterization and under-standing of neurodegeneration.The translocator protein (TSPO) (18 kDa), which is located in the outer mitochondrial membrane, is widely distributed in many peripheral tissues and in the central nervous system (2). The abun-dance of TSPO is low in normal brain tissue but is markedly elevated in neuroinflammatory brain diseases. TSPO is thus con-sidered a promising target for the early imaging of microglial activation. The11C-PK11195 ligand was the first described TSPO
radioligand and has been extensively used in animal models and in patients with neurodegenerative diseases over the past 2 decades. Nevertheless, this ligand has many limitations, including strong nonspecific and plasma protein binding and low brain uptake. A second generation of TSPO radioligands with improved properties has since been developed, including11C-PBR28 ([methyl-11
C]N-ace-tyl-N-(2-methoxybenzyl)-2-phenoxy-5-pyridinamine), 18F-PBR111
(2-(6-chloro-2-(4-(3-18
F-fluoropropoxy)phenyl)imidazo[1,2-a]pyri-din-3-yl)-N,N-diethylacetamide),18F-FEDAA1106
(N-(5-fluoro-2-phenoxyphenyl)-N-(2-18F-fluoroethyl-5-methoxybenzyl)acetamide), 18F-FEPPA (N-2-(2-18
F-fluoroethoxy)benzyl-N-(4-phenoxypyridin-3-yl)acetamide),18F-PBR06 (N-(2,5-dimethoxybenzyl)-2-18
F-fluoro-N-(2-phenoxyphenyl)acetamide), 11C-DPA-713
(N,N-diethyl-2-[2-(4-11
C-methoxyphenyl)-5,7-dimethyl-pyrazolo[1,5-a]pyrimidin-3-yl]-acetamide), and 18F-DPA-714 (N,N-diethyl-2-(2-(4-(2-18
F-fluo- roethoxy)phenyl)-5,7-dimethylpyrazolo[1,5-a]pyrimidin-3-yl)acet-amide). Although some ligands radiolabeled with 11C are highly
specific for TSPO, with many advantages over the 11C-PK11195,
their short half-life considerably complicates their widespread use. Received Feb. 24, 2015; revision accepted May 12, 2015.
For correspondence or reprints contact: Sonia Lavisse, 18 Route du Panorama, 92260 Fontenay-aux-Roses, France.
E-mail: sonia.lavisse@cea.fr *Contributed equally to this work. Published online May 29, 2015.
COPYRIGHT© 2015 by the Society of Nuclear Medicine and Molecular Imaging, Inc.
Among the 18F-labeled compounds,18F-FEDAA1106 has showed
slow kinetics in healthy individuals and Alzheimer disease patients (3) not suitable for in vivo imaging and quantification of TSPO.18F-PBR06
(4) demonstrated favorable properties in healthy humans but produced brain-penetrant radiolabeled metabolites that could bias the binding quantification.18F-FEPPA and18F-PBR111 displayed favorable
prop-erties for imaging in healthy humans (5,6), although18F-FEPPA is
rapidly metabolized.
Recent preclinical studies (7–9) have identified18F-DPA-714 as
a promising TSPO ligand for in vivo imaging, and18F-DPA-714
has been used to quantify TSPOs in healthy subjects (10) and in amyotrophic lateral sclerosis, Alzheimer, or stroke patients (11–13). In most studies, quantification was performed without arterial sam-ples or metabolite analysis and was based either on a simplified compartmental model (the cerebellum as a reference region (10,12)) or on a cluster analysis (10,11,13).
Interestingly, Owen et al. (14) demonstrated in humans that second-generation TSPO tracers target 2 binding sites that lead to 3 affinity patterns: high-, low-, and mixed-affinity binders (HABs, LABs, and MABs, respectively). The recent TSPO radio-ligands, therefore, have to be evaluated by accounting for the TSPO genotype of each subject, which has not been the case so far for18F-DPA-714.
Here, we evaluated the ability of18F-DPA-714 to quantify the
TSPO in the brain of 10 healthy subjects with known TSPO ge-notype. Using arterial blood sampling and metabolite correction, we sought to determine the compartmental model that best de-scribed18F-DPA-714 cerebral uptake. We investigated whether the
total distribution volume (VT) could be properly identified and
differed as a function of the TSPO genotype. We determined the scan duration needed for stable VT estimates. Last, we studied
whether a population-based input function (PBIF) method or the use of venous sampling could provide accurate quantification while avoiding the need for invasive arterial blood sampling.
MATERIALS AND METHODS Study Design
Ten healthy volunteers (4 women and 6 men; age6 SD, 43.5 6 15.7 y) were included. Written informed consent was obtained from all partici-pants. All individuals were genotyped for the rs6971 polymorphism within the TSPO gene, and genetic analysis revealed 7 HABs and 3 MABs. Each participant underwent T1-weighted MR imaging (to delineate anatomic boundaries for region-of-interest [ROI] analysis) and18F-DPA-714 PET
scanning. A18F-DPA‐714 bolus was injected intravenously (201.4 6
26.3 MBq), and the dynamic PET acquisition lasted 90 min. During acquisition, sequential arterial and venous blood was sampled to gen-erate an arterial input function (AIF) and venous input function.
Supplemental data (available at http://jnm.snmjournals.org) provide details on volunteers, genetic analysis procedure,18F-DPA-714
syn-thesis, and imaging protocols.
18F-DPA-714 PET Quantification
Reconstructed dynamic data were realigned for motion correction according to the process of frame-to-reference image registration in Pmod (version 3.5; PMOD Technologies Ltd.).
All T1 MR images were automatically segmented using Freesurfer 5.3, which is documented and freely available for download online (http://surfer.nmr.mgh.harvard.edu/). Selected segmented ROIs were those described as having a moderate, low, or high density of TSPO in normal conditions (15): thalamus; caudate; putamen; hippocampus; white matter; cerebellum; and occipital, parietal, frontal, and temporal cortices. Data from left and right regions were averaged.
After coregistration (BrainVISA), the MR imaging–defined ROIs were applied to the dynamic PET scan to derive regional time–activity curves.
The 1- and 2-tissue-compartment model (1-TCM and 2-TCM, respectively) were applied to the dynamic PET data (Pmod). Blood volume correction was fixed at 5%. The outcome parameters VT, Vs
(specific volume of distribution), and kinetic rate constants were esti-mated for each region. Logan graphical analysis was tested with the fit starting at 30 min.
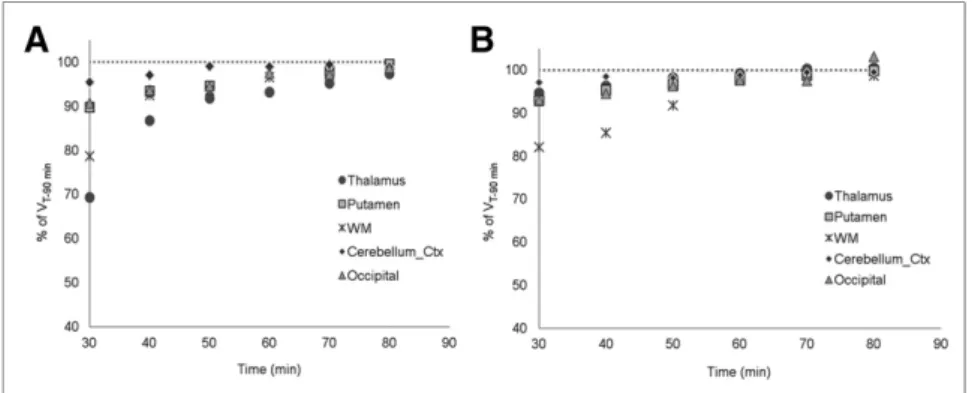
To investigate the scanning duration required for reproducible estimates of VT, a time-stability analysis was performed (2-TCM) by
analyzing reduced scan durations ranging from 90 (VT-90 min) to
30 min, with a 10-min step.
To simplify the quantification, the equilibrium state between the parent plasma P and the free ligand F compartments (and between free F and bound B ligand compartments) was estimated from the ratio of the concentrations in these 2 compartments (F/P and B/F) in the 2-TCM. At equilibrium, the ratio of brain tissue to AIF (ratioAIF)
cor-responds to the definition of the VTparameter and is proportional to
the receptor density (16). From equilibrium, these ratios were individ-ually calculated and were compared with the corresponding VT
extracted from 2-TCM analysis (VT-2TCM).
The equivalence between unchanged18F-DPA-714 concentrations
in venous and arterial plasma was also tested for each individual. At equivalence, the ratio obtained between the brain tissue and the unchanged venous plasma activity concentrations was calculated (ratiovein) and compared with VT-2TCM.
More details on18F-DPA-714 PET data quantification and PBIF
method are described in the supplemental data. PBIF
We used a leave-one-out approach based on all subjects: for each subject, a standard input function (SIF) was created by averaging the AIF of the 9 other subjects. The SIF was then normalized by the value of the individual AIF at time Ta(AIFTa) so that the SIF was dimensionless. To replace the arterial sample with the venous samples for the normalization of the SIF, we defined a linear function f(x) to estimate the value of AIF at time Tabased on venous samples. To evaluate the accuracy of the PBIF method, VTwas assessed with the Logan
graph-ical model using as input the original AIF (VT-Logan), the
arterial-based input function (VT-PBIF-AIF), or the venous-based input function
(VT-PBIF-vein).
FIGURE 1. 18F-DPA-714 representative SUV PET images (summed
from 60 to 90 min) showing axial, sagittal, and coronal views of HAB (A) and MAB (B) individual.
Statistical Analysis
Data are presented as the mean6 SD. Goodness of fit by the non-linear least-squares method was evaluated using the Akaike informa-tion criterion (AIC). The SE of estimainforma-tion was expressed as a percentage of the rate constant (coefficient of variation [%COV]). AIC esti-mates from the 1- and 2-TCM were compared with a Wilcoxon paired t test for each ROI. VT values between MABs and HABs
were compared using a Mann–Whitney U test. Coefficients of cor-relation (Spearman) were evaluated between the different parame-ters. Statistical analysis was conducted with R (R Project for Statistical Computing). The threshold of significance was set to a P value of less than 0.05.
RESULTS
18F-DPA-714 Distribution
All subjects showed fairly uniform18F-DPA-714 binding in the
brain, with higher levels of radioactivity in HABs than in MABs (Fig. 1). The thalamus region demonstrated the highest18
F-DPA-714 uptake.
The concentration of the ligand in tissue peaked within the first 4 min and washed out with different elimination rates depending on the genetic group and ROI (Fig. 2). The peak was slightly higher, and washout was faster in MABs than in HABs.
Between 60 and 90 min, the thalamus exhibited the highest washout (mean standardized uptake value [SUV], ;0.75 and ;1.11 for MAB and HAB groups, respectively), followed by the parietal and frontal cortices (;0.63 and ;0.90), the hippo-campus, white matter, occipital cortex (;0.59 and ;0.79), putamen (;0.56 and ;0.88) and caudate, cerebellum, and temporal cortex (;0.51 and ;0.69).
In plasma, the metabolism of18F-DPA-714 was relatively slow,
with an unchanged fraction reaching 54.8%6 9.7% of the total plasma activity at 90 min in arterial samples. Similar values were obtained in the venous plasma with 54.5%6 9.6% at 90 min. The difference between the venous and arterial unchanged fraction was low in each individual: 3.1% 6 1.8% at 90 min, except for 1 participant who displayed a much higher unchanged fraction in venous plasma (119%) than in arterial plasma. This individual was excluded from the analysis based on venous data.
After a rapid distribution phase (peak of 7.3 6 3.2 SUV at 1 min), the unchanged radiotracer in arterial plasma showed slow elimination kinetics with low concentrations and small interindi-vidual variability (0.226 0.08 SUV at 30), with no SUV differ-ence between HABs and MABs (respectively, 0.1336 0.037 and 0.1376 0.080 between 60 and 90 min).
In venous plasma, the elimination kinet-ics occurred at the same rate as in arterial plasma, with lower values (24% 6 13%) and higher interindividual variability.
18F-DPA-714 Quantification
The 2-TCM fitted correctly the kinetics of the radiotracer and identified the best AIC scores (33.5 6 16.5). The VT
pa-rameter was identified with a %COV for VT-2TCM ranging between 2.1% and
4.9%, depending on the ROI. This model estimated the rate constants with moderate identifiability (mean, 8.2, 19.0, 25.3 and 17.4 %COV for K1, k2, k3, and k4,
respectively).
Fitting with the 1-TCM deviated from the measured PET data (Fig. 3), and this model gave a significantly higher AIC score (49.26 20.7) than the 2-TCM (P , 0.004).
Therefore, the unconstrained 2-TCM best described the kinetics of both specific and nonspecific18F-DPA-714 binding (Table 1).
VTwas higher in HABs (145.9% 6 4.8%) than MABs, with
a trend toward significance in the thalamus and white matter regions (P5 0.055) despite the small number of subjects. Figure 4 shows the variability in the VTestimates, which is substantial in
the HAB group. No correlation between the age of subjects and VT values in the HAB group was found (20.2 , r , 20.61,
depending on ROI).
The nondisplaceable distribution volume VND (K1/k2) and Vs
(Vs 5 VT– VND) were estimated for each region. When both
HABs and MABs were considered, VND estimates ranged from
0.82 mL/cm3in the thalamus to 1.13 mL/cm3in the caudate, with
an average of 0.9756 0.08 mL/cm3across regions (mean V ND
was 0.77 and 1.07 mL/cm3 in MABs and HABs, respectively).
VNDwas equal to 1.02 mL/cm3across all regions and individuals,
using the polymorphism plot method developed by Guo et al. (5). For both genetic groups, Vswas lowest in the caudate and highest
in the thalamus (Table 2). The ratio of specific to total uptake of
18F-DPA-714 was approximately 80% in the thalamus and the
hippocampus regions, approximately 65% in the occipital, parie-tal, fronparie-tal, and temporal cortices, and only 50% in the caudate. This ratio was similar for HABs and MABs.
The time-stability analysis showed that VT-60 minwas similar to
VT-90 min(VT-60 min. 98% of the VT-90 minvalue in all ROIs for
MABs and HABs), and covariance was stable (12.29% higher at
FIGURE 2. Time–activity-curves of SUV expressed as mean ± SD in several brain structures of MAB (A) and HAB (B) subjects.
FIGURE 3. Model-fit comparisons. Example of 1- and 2-TCM fit to parietal (A) and occipital cortex (B) for one HAB subject.
60 than at 90 min). VT-60 minand VT-90 minwere highly correlated
when all subjects were pooled (r5 0.92 for the white matter, r 5 0.59 for the putamen, r. 0.90 for other ROIs, P , 0.001). When the duration of the scan was reduced to 30 min, VTidentifiability
was poorer (%COV. 10) and showed higher bias to VT-90 min
(Fig. 5).
VT-Loganvalues were highly correlated with those obtained with
the 2-TCM (r. 0.98, P , 1028; Table 2): the mean underesti-mation of the VTwith this approach was 2.07% and 3.01% over all
ROIs for MABs and HABs, respectively.
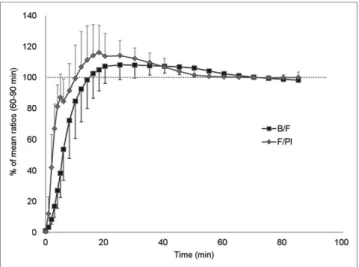
As a prerequisite of the alternative quantification methods, B/F and F/P were calculated and were found to rapidly increase with time, reaching a plateau at 30 min (Fig. 6) for each subject. They both were stable at 60 min, with a mean variation of 2% between 60 and 90 min for all individuals and ROIs. No differ-ence was observed between HABs and MABs. 18F-DPA-714
therefore reached a true equilibrium after 60 min after injec-tion. The ratioAIFwas calculated for the last 30 min (60–90 min)
for each individual: it was highly correlated with the VT-2TCM
for all regions (r5 0.93 6 0.05, P , 1023; Fig. 7) and was 29.9%6 5.0% higher than the VT-2TCM. The ratioveinwas 72.7%6
6.6% higher than the VT-2TCM across all ROIs, and both
parameters were found correlated as well (r 5 0.83 6 0.06, P5 0.01).
In the PBIF method, the correlation between the AIF points and the area under the curve was highest at 40 min (r5 0.96, P, 1025). This time point was chosen as Tato normalize the SIF. VT-PBIF-AIF was strongly correlated with VT-Logan and VT-2TCM
(r 5 0.97 6 0.03, P 5 0.02; Fig. 7). The difference between VT-PBIF-AIFand VT-Loganvalues was 2.2% 6 5.8%. VT-PBIF-vein
and VT-Logan(difference of 2.4%6 29.3%) showed a mean
cor-relation of 0.67 6 0.10, which was significant in the caudate, putamen, thalamus, white matter, and frontal and parietal cortex regions.
DISCUSSION
We quantified 18F-DPA-714 uptake in the brain of
TSPO-genotyped healthy individuals.
We found that the 2-TCM described the kinetics of the tracer better than the 1-TCM, with good identifiability of the VT, VND,
and Vsparameters. Furthermore, the Logan approach was highly
correlated with the 2-TCM and accurately estimated VT. This
approach can be further applied at the voxel level to produce parametric VTmaps. Our observations are consistent with studies
regarding TSPO radioligands showing that the 2-TCM is superior to the 1-TCM (5,6,12,17). The range of our VTestimates (3–5
mL/cm3) was similar to that found for 18F-DPA-714 (12),11
C-PRB28, and 18F-PBR111 in HABs (5,15) and for11C-DPA-713
(17). Our estimates in the ROIs were consistent with the known distribution of TSPO in the human brain and with previous stud-ies on11C-PK11195,11C-DPA713,11C-PBR28, and18F-FEPPA
(6,15,17,18): the biodistribution of18F-DPA-714 was widespread
and similar in the different cortical regions, but activity concen-tration was always higher in the thalamus than in the other cerebral regions.
The mean VND in the brain was 0.975 mL/cm3, further
con-firmed by the polymorphism plot method (5). This value was in TABLE 1
Rate Constant Estimates from 2-TCM Analysis
K1(mL⋅min−1⋅cm−3) k2(min−1) k3(min−1) k4(min−1)
Region MAB HAB MAB HAB MAB HAB MAB HAB
Thalamus 0.39 (0.12) 0.35 (0.15) 0.77 (0.40) 0.40 (0.14) 0.53 (0.09) 0.28 (0.06) 0.12 (0.05) 0.06 (0.01) Caudate 0.33 (0.09) 0.24 (0.13) 0.72 (0.38) 0.18 (0.07) 0.49 (0.15) 0.13 (0.07) 0.17 (0.09) 0.08 (0.02) Putamen 0.35 (0.07) 0.37 (0.21) 0.57 (0.30) 0.39 (0.26) 0.31 (0.20) 0.26 (0.13) 0.08 (0.02) 0.08 (0.02) Hippocampus 0.29 (0.08) 0.30 (0.22) 0.70 (0.40) 0.55 (0.62) 0.38 (0.23) 0.22 (0.18) 0.15 (0.10) 0.05 (0.03) White matter 0.23 (0.05) 0.20 (0.10) 0.53 (0.32) 0.22 (0.13) 0.31 (0.14) 0.15 (0.10) 0.10 (0.04) 0.05 (0.01) Cerebellum 0.39 (0.09) 0.30 (0.17) 0.77 (0.42) 0.32 (0.17) 0.36 (0.24) 0.30 (0.19) 0.29 (0.25) 0.11 (0.05) Occipital 0.45 (0.13) 0.32 (0.15) 1.03 (0.77) 0.33 (0.13) 0.46 (0.15) 0.27 (0.13) 0.31 (0.29) 0.09 (0.03) Parietal 0.36 (0.05) 0.33 (0.17) 0.65 (0.15) 0.32 (0.15) 0.52 (0.09) 0.27 (0.13) 0.17 (0.10) 0.08 (0.02) Frontal 0.40 (0.08) 0.31 (0.17) 0.87 (0.50) 0.25 (0.11) 0.48 (0.16) 0.23 (0.10) 0.18 (0.11) 0.08 (0.02) Temporal 0.27 (0.09) 0.28 (0.18) 0.44 (0.39) 0.37 (0.31) 0.23 (0.24) 0.26 (0.17) 2.00 (2.56) 0.08 (0.03)
Data in parentheses are SDs.
FIGURE 4. VTestimates in different ROIs for HAB and MAB groups.
the same range as the VNDof the18F-PBR111 tracer (1.18 mL/
cm3) but was smaller than the V
NDof 11C-PRB28 (between 1.6
and 2 (15)), indicating that18F-DPA-714 has lower nonspecific
binding than11C-PRB28. All these data suggest that18F-DPA-714
is a highly specific ligand for TSPO.
We compared the binding of18F-DPA-714 in 2 genetic groups
using VToutcome measures. It was not known whether the
differ-ent binding states reported for 11C-DPA-713 (19) also exist for 18F-DPA-714. However, we expected18F-DPA-714 to exhibit
dif-ferential affinity for TSPO, as observed for all second-generation TSPO ligands examined to date, because 18F-DPA-714 and11
C-DPA-713 are structurally similar (20). We found approximately 50% difference in VT between HABs and MABs, which was
higher than the difference seen with the 18F-FEPPA tracer
(be-tween 15% and 30% (21)) but within the same range as the one with11C-PBR28 (15).
The difference in VT between HABs and MABs was evident
from the shape of the time–activity curves in each affinity group. In addition, one LAB individual was also initially included in our study, and the cor-responding time–activity curve clearly dif-fered from the time–activity curves of the other 2 groups, suggesting that the VT
pa-rameter of LABs is different from that of HABs and MABs (Supplemental Fig. 1). Arterial sampling was not performed for this subject.
Our data confirm that 18F-DPA-714
binding is influenced by the Ala147Thr polymorphism of TSPO, demonstrating the need to genotype each subject to stratify analysis and to accurately inter-pret18F-DPA-714 binding.
TABLE 2
VT, Vs, and BPndEstimates from 2-TCM and Logan Analysis
2-TCM Region VT VS BPnd(k3/k4) Logan, VT MAB Thalamus 3.45 (0.26) 2.91 (0.35) 5.17 (2.09) 3.43 (0.22) Caudate 2.27 (0.25) 1.58 (0.47) 3.58 (1.83) 2.35 (0.24) Putamen 2.70 (0.21) 1.90 (0.59) 3.13 (2.08) 2.74 (0.24) Hippocampus 2.70 (0.21) 2.20 (0.32) 4.80 (3.12) 2.69 (0.19) White matter 2.56 (0.22) 1.84 (0.51) 4.33 (2.97) 2.60 (0.24) Cerebellum 2.49 (0.21) 2.04 (0.22) 3.48 (2.32) 2.49 (0.19) Occipital 2.81 (0.25) 1.90 (0.68) 4.09 (2.52) 2.87 (0.21) Parietal 2.88 (0.33) 1.92 (0.68) 3.79 (1.14) 2.89 (0.33) Frontal 2.97 (0.40) 2.10 (0.72) 4.58 (2.57) 2.97 (0.37) Temporal 2.54 (0.22) 1.79 (0.45) 2.54 (2.50) 2.53 (0.21) HAB Thalamus 5.24 (1.77) 4.31 (1.48) 4.80 (0.73) 4.84 (1.68) Caudate 3.30 (1.27) 1.91 (0.76) 1.49 (0.39) 3.05 (1.23) Putamen 4.17 (1.40) 3.12 (1.21) 3.05 (1.17) 3.95 (1.35) Hippocampus 3.90 (1.03) 2.90 (1.06) 3.74 (2.18) 3.73 (1.08) White matter 3.75 (1.13) 2.70 (0.90) 2.80 (1.01) 3.60 (1.14) Cerebellum 3.44 (1.32) 2.43 (1.23) 2.51 (1.19) 3.24 (1.32) Occipital 3.86 (1.22) 2.83 (1.00) 2.90 (0.95) 3.72 (1.14) Parietal 4.24 (1.47) 3.21 (1.31) 3.04 (1.01) 3.98 (1.42) Frontal 4.43 (1.67) 3.26 (1.39) 2.63 (0.68) 4.12 (1.59) Temporal 3.43 (1.09) 2.47 (1.08) 2.87 (1.61) 3.28 (1.07)
Data in parentheses are SDs.
In the HABs, VTshowed high variability that could be related
to K1 higher variability in that group, compared with MABs
(Table 1). Such variability in HABs has already been reported for other tracers, namely18F-PBR111 (5) and18F-FEPPA (22).
As described in Guo et al. (5), we checked here if age or injected mass could influence the binding of radiotracers to TSPO but we found no correlation between those variables and ligand binding. This result was consistent with the findings of Suridjan et al. (21), who previously determined that age did not influence the binding of the 18F-FEPPA tracer in a large
HAB cohort (n5 22).
Arterial blood sampling to quantify 18F-DPA-714 is invasive
and unsuitable for routine use in patients. Therefore, the reference-based quantitative method (simplified reference tissue model) with the cerebellum as a reference region may be an easier alternative method for data analysis (10,12). Although Golla et al. found a good correlation between the binding potential (BPnd) estimated in the simplified reference tissue model and
the associated VT-2TCMvalues, here we could not always reliably
estimate the BPnd parameter using same method. In addition,
when correctly estimated, BPnd clearly did not correlate with
our VT-2TCMestimates, likely meaning that Vsin the cerebellum
is not negligible and the use of this region as a reference can bias the quantification. Moreover, TSPO is widely distributed in the entire brain, thus no anatomic region can be considered devoid of TSPO binding sites.
We tested 3 methods to limit the burden of the18F-DPA-714
PET scan: (1) we tried to reduce the scan duration and we performed the quantification with (2) venous blood samples only or (3) a single arterial blood sample. Our analyses showed that equilibrium was attained by 60 min, suggesting that ac-quisition time can be reduced to 60 min in clinical trials. More-over, the small increase in VTbetween 60 and 90 min suggests
that radiometabolites potentially entering the brain do not sub-stantially contribute to VT, as previously described (23). Indeed,
we recently showed that one 18F-DPA-714 radiometabolite
contributes to about 15% of brain radioactivity after 120 min in rats. And this value is likely to be much lower in humans at 90 min because metabolism is much slower in humans than in rodents.
The distribution volume calculated after equilibrium as ratioAIF was strongly correlated with VTestimated by the
2-TCM. This method could be therefore used with an acquisition starting 60 min after radiopharmaceutical injection and lasting only 30 min. The ratiovein(to avoid using arterial invasive
pro-cedure) was correlated with VT-2TCM, but the correlation was
high in the same individual while we observed a higher vari-ability between subjects. This finding is probably explained by the variability in the ratio in venous samples between subjects, despite a stable arteriovenous ratio during analysis (60– 90 min). Further work is in progress to better understand and to reduce the variability of the venous sampling. Furthermore, although both ratios were correlated with VT-2TCM, they both
overestimated the VT value by approximately 20% and 70%,
respectively.
The results of the PBIF method based on one arterial sample or venous samples were highly consistent with those of the full AIF and gave VTestimates (VT-PBIF-AIFand VT-PBIF-vein) close to the
VT-2TCM, with only approximately 2% difference. As expected, the
variability of the equilibrium between arterial and vein input func-tions led to substantial variability in the PBIFveinmethod (;30%
SD for the difference between VT-PBIF-veinand VT-2TCM). However,
our method based on f(x) minimized the difference between ve-nous and arterial samples and provided a similar error for both PBIFveinand PBIFarterymethods. Although this result is
encourag-ing, the number of individuals (n 5 9) is insufficient to draw definitive conclusions about the utility of a method using only vein sampling. Further work on a larger cohort of HABs and MABs will help us to improve the f(x) function.
CONCLUSION
18F-DPA-714 is highly specific for TSPO and can be quantified
using the 2-TCM and the Logan graphical approach. Radiolabel-ing with18F renders this ligand suitable for widespread use. It was
crucial first to characterize and to quantify this ligand in geno-typed healthy controls before using it in patients. Indeed, we showed that 18F-DPA-714 binding is influenced by the TSPO
polymorphism, consistent with all second-generation TSPO radio-ligands. Genotyping subjects should be therefore systematically performed before clinical interpretation of 18F-DPA-714 PET
scans in neuroinflammatory studies of various neuropathologies.
DISCLOSURE
The costs of publication of this article were defrayed in part by the payment of page charges. Therefore, and solely to indicate this fact, this article is hereby marked “advertisement” in accordance with
FIGURE 6. Equilibrium assessment showing B/F and F/Pl with time. Dotted line represents 100% of mean ratio. Data are expressed as mean± SD.
FIGURE 7. Correlations of VTobtained with 2-TCM and 2 alternative
methods: PBIF (VT-PBIF-AIF) (A) and tissue-to-plasma ratio (ratioAIF) (B) for
18 USC section 1734. This work was supported by France Parkinson (NCT02319382), ANR-08-MNPS-016-02 (NCT02305264), ANR-10-IAIHU-06, a grant from “Investissement d’Avenir-ANR-11-INBS-0011”—NeurATRIS, CEA, and ECTRIMS. No other potential conflict of interest relevant to this article was reported.
ACKNOWLEDGMENTS
We are grateful to the SHFJ staff and to Irène Buvat for careful reading of the manuscript. We thank Lena Guillot, Isabelle Rebeix, Sylvie Forlani, and Luce Dauphinot for the genetic anal-ysis. We also thank Philippe Gervais and Frédéric Dollé for the qualification of the clinical production.
REFERENCES
1. Glass CK, Saijo K, Winner B, Marchetto MC, Gage FH. Mechanisms underlying inflammation in neurodegeneration. Cell. 2010;140:918–934.
2. Venneti S, Lopresti BJ, Wiley CA. The peripheral benzodiazepine receptor (translocator protein 18kDa) in microglia: from pathology to imaging. Prog Neurobiol. 2006;80:308–322.
3. Varrone A, Mattsson P, Forsberg A, et al. In vivo imaging of the 18-kDa translocator protein (TSPO) with [18F]FEDAA1106 and PET does not show increased binding in
Alzheimer’s disease patients. Eur J Nucl Med Mol Imaging. 2013;40:921–931. 4. Fujimura Y, Zoghbi SS, Simeon FG, et al. Quantification of translocator protein
(18 kDa) in the human brain with PET and a novel radioligand,18F-PBR06. J
Nucl Med. 2009;50:1047–1053.
5. Guo Q, Colasanti A, Owen DR, et al. Quantification of the specific translocator protein signal of18F-PBR111 in healthy humans: a genetic polymorphism effect
on in vivo binding. J Nucl Med. 2013;54:1915–1923.
6. Rusjan PM, Wilson AA, Bloomfield PM, et al. Quantitation of translocator pro-tein binding in human brain with the novel radioligand [18F]-FEPPA and positron
emission tomography. J Cereb Blood Flow Metab. 2011;31:1807–1816. 7. Boutin H, Prenant C, Maroy R, et al. [18F]DPA-714: direct comparison with [11C]
PK11195 in a model of cerebral ischemia in rats. PLoS ONE. 2013;8:e56441. 8. Chauveau F, Van Camp N, Dolle F, et al. Comparative evaluation of the
trans-locator protein radioligands11C-DPA-713,18F-DPA-714, and11C-PK11195 in
a rat model of acute neuroinflammation. J Nucl Med. 2009;50:468–476.
9. Lavisse S, Guillermier M, Herard AS, et al. Reactive astrocytes overexpress TSPO and are detected by TSPO positron emission tomography imaging. J Neurosci. 2012;32:10809–10818.
10. Arlicot N, Vercouillie J, Ribeiro MJ, et al. Initial evaluation in healthy humans of [18F]DPA-714, a potential PET biomarker for neuroinflammation. Nucl Med
Biol. 2012;39:570–578.
11. Corcia P, Tauber C, Vercoullie J, et al. Molecular imaging of microglial activa-tion in amyotrophic lateral sclerosis. PLoS ONE. 2012;7:e52941.
12. Golla SS, Boellaard R, Oikonen V, et al. Quantification of [F]DPA-714 binding in the human brain: initial studies in healthy controls and Alzheimer’s disease patients. J Cereb Blood Flow Metab. 2015; 35:766–772.
13. Ribeiro MJ, Vercouillie J, Debiais S, et al. Could (18) F-DPA-714 PET imaging be interesting to use in the early post-stroke period? EJNMMI Res. 2014;4:28– 35.
14. Owen DR, Howell OW, Tang SP, et al. Two binding sites for [3H]PBR28 in
human brain: implications for TSPO PET imaging of neuroinflammation. J Cereb Blood Flow Metab. 2010;30:1608–1618.
15. Owen DR, Guo Q, Kalk NJ, et al. Determination of [11C]PBR28 binding
poten-tial in vivo: a first human TSPO blocking study. J Cereb Blood Flow Metab. 2014;34:989–994.
16. Innis RB, Cunningham VJ, Delforge J, et al. Consensus nomenclature for in vivo imaging of reversibly binding radioligands. J Cereb Blood Flow Metab. 2007;27: 1533–1539.
17. Endres CJ, Pomper MG, James M, et al. Initial evaluation of11C-DPA-713,
a novel TSPO PET ligand, in humans. J Nucl Med. 2009;50:1276–1282. 18. Turkheimer FE, Edison P, Pavese N, et al. Reference and target region modeling
of [11C]-(R)-PK11195 brain studies. J Nucl Med. 2007;48:158–167.
19. Coughlin JM, Wang Y, Ma S, et al. Regional brain distribution of translocator protein using [11C]DPA-713 PET in individuals infected with HIV. J Neurovirol.
2014;20:219–232.
20. Owen DR, Gunn RN, Rabiner EA, et al. Mixed-affinity binding in humans with 18-kDa translocator protein ligands. J Nucl Med. 2011;52:24–32.
21. Suridjan I, Rusjan PM, Voineskos AN, et al. Neuroinflammation in healthy aging: a PET study using a novel translocator protein 18kDa (TSPO) radioligand, [18F]-FEPPA. Neuroimage. 2014;84:868–875.
22. Mizrahi R, Rusjan PM, Kennedy J, et al. Translocator protein (18 kDa) poly-morphism (rs6971) explains in-vivo brain binding affinity of the PET radioligand [18F]-FEPPA. J Cereb Blood Flow Metab. 2012;32:968–972.
23. Peyronneau MA, Saba W, Goutal S, et al. Metabolism and quantification of [18F]
DPA-714, a new TSPO positron emission tomography radioligand. Drug Metab Dispos. 2013;41:122–131.