HAL Id: hal-02265301
https://hal.inria.fr/hal-02265301
Submitted on 9 Aug 2019HAL is a multi-disciplinary open access archive for the deposit and dissemination of sci-entific research documents, whether they are pub-lished or not. The documents may come from teaching and research institutions in France or abroad, or from public or private research centers.
L’archive ouverte pluridisciplinaire HAL, est destinée au dépôt et à la diffusion de documents scientifiques de niveau recherche, publiés ou non, émanant des établissements d’enseignement et de recherche français ou étrangers, des laboratoires publics ou privés.
Presymptomatic spinal cord pathology in c9orf72
mutation carriers: a longitudinal neuroimaging study
Giorgia Querin, Peter Bede, Mohamed Mounir El Mendili, Menghan Li,
Mélanie Pélégrini-Issac, Daisy Rinaldi, Martin Catala, Dario Saracino,
François Salachas, Agnès Camuzat, et al.
To cite this version:
Giorgia Querin, Peter Bede, Mohamed Mounir El Mendili, Menghan Li, Mélanie Pélégrini-Issac, et al.. Presymptomatic spinal cord pathology in c9orf72 mutation carriers: a longitudinal neuroimaging study. Annals of Neurology, Wiley, 2019, 86 (2), pp.158-167. �10.1002/ana.25520�. �hal-02265301�
Presymptomatic spinal cord pathology in c9orf72 mutation carriers: a
longitudinal neuroimaging study
1,2Giorgia Querin, MD; 1,2,3PeterBede, MD, PhD; 2,4Mohamed Mounir El Mendili, PhD; 2Menghan
Li; 2MélaniePélégrini-Issac, PhD; 5,6DaisyRinaldi, PhD; 7MartinCatala, MD, PhD; 5Dario
Saracino, MD; 1FrançoisSalachas, MD; 5AgnesCamuzat, PhD; 2VéroniqueMarchand-Pauvert,
PhD; 8JulienCohen-Adad, PhD; 5,9,10OlivierColliot, PhD; 5,6,11IsabelleLe Ber I, MD, PhD and 1,2,12Pierre-FrançoisPradat, MD, PhD for The Predict to Prevent Frontotemporal Lobar
Degeneration and Amyotrophic Lateral Sclerosis (PREV-DEMALS) Study Group.
1-APHP, Département de Neurologie, Centre Référent SLA, Hôpital Pitié-Salpêtrière, Paris, France.
2- Laboratoire d’Imagerie Biomédicale, CNRS, INSERM, Sorbonne Université, Paris, France. 3- Computational Neuroimaging Group, Academic Unit of Neurology, Trinity College Dublin, Dublin, Ireland.
4- Department of Neurology, Icahn School of Medicine at Mount Sinai, New York, USA.
5- Institut du Cerveau et de la Moelle Épinière, Sorbonne Université, INSERM U1127, CNRS UMR 7225, Hôpital Pitié-Salpêtrière, Paris, France.
6- Centre de Référence des Démences Rares ou Précoces, Hôpital Pitié-Salpêtrière, Paris, France. 7- APHP, Département de Neurologie, Hôpital Pitié-Salpêtrière, Sorbonne Université, CNRS UMR7622, INSERM ERL 1156, IBPS, Paris, France.
8- NeuroPoly Lab, Institute of Biomedical Engineering, Polytechnique Montreal, Montreal, QC, Canada; Functional Neuroimaging Unit, CRIUGM, Université de Montreal, Montreal, QC, Canada. 9- Aramis Project Team, Inria Research Center of Paris, Paris, France.
10- Centre pour l’Acquisition et le Traitement des Images, Institut du Cerveau et de la Moelle Épinière, Paris, France.
11- Institute of Memory and Alzheimer’s Disease, Center of Excellence of Neurodegenerative Disease, APHP, Département de Neurologie, Centre Référent SLA, Hôpital Pitié-Salpêtrière, Paris, France.
12- Northern Ireland Centre for Stratified Medicine, Biomedical Sciences Research Institute Ulster University, C-TRIC, Altnagelvin Hospital, Londonderry, United Kingdom.
Corresponding author: Pierre-François Pradat
Address: Département de Neurologie, 47 Boulevard de l'Hôpital - F-75634 PARIS cedex 13, FRANCE
Email: pierre-francois.pradat@aphp.fr Phone: +33-(0)1-42-16-16-91
Fax: +33-(0)1-42-16-17-29
Word count Title: 100
Word count Running head: 37 Word count Abstract: 242 Word count Introduction: 525 Word count Discussion: 1220
Word count body of the manuscript: 3664 Figures: 1
Abstract
Objective: C9orf72 hexanucleotide repeats expansions account for almost half of familial
Amyotrophic Lateral Sclerosis (ALS) and Frontotemporal dementia (FTD) cases. Recent imaging studies in asymptomatic c9orf72 carriers have demonstrated cerebral white (WM) and grey matter (GM) degeneration before the age of 40.
The objective of this study was to characterise cervical spinal cord (SC) changes in asymptomatic
c9orf72 hexanucleotide carriers.
Methods: Seventy-two asymptomatic individuals were enrolled in a prospective study of
first-degree relatives of ALS and FTD patients carrying the c9orf72 hexanucleotide expansion. Forty of them carried the pathogenic mutation (C9+). Each subject underwent quantitative cervical cord imaging. Structural grey (GM) and white matter (WM) metrics and diffusivity parameters were evaluated at baseline and 18 months later. Data were analysed in C9+ and C9- subgroups and C9+ subjects were further stratified by age.
Results: At baseline, significant WM atrophy was detected at each cervical vertebral level in C9+
subjects older than 40 without associated changes in GM and DTI parameters. At 18-month follow-up, WM atrophy was accompanied by significant corticospinal tract (CST) fractional anisotropy (FA) reductions. Intriguingly, asymptomatic C9+ subjects older than 40 with family history of ALS (as opposed to FTD) also exhibited significant CST FA reduction at baseline.
Discussion: Cervical SC imaging detects WM atrophy exclusively in C9+ subjects older than 40
years of age and progressive CST FA reductions can be identified on 18-month follow-up. Cervical SC MRI readily captures presymptomatic pathological changes and disease propagation in c9orf72-associated conditions.
Keywords: c9orf72, presymptomatic carriers, spinal cord MRI, multi-parametric MRI,
Introduction
Amyotrophic Lateral Sclerosis (ALS) and Frontotemporal dementia (FTD) are adult-onset neurodegenerative conditions with shared pathological, genetic, neuropsychological and imaging features1,2. Up to 40% of familial ALS and FTD cases are caused by autosomal dominant
GGGGCC hexanucleotide expansions in the non-coding region of the c9orf72 gene3,4. While the
minimum pathogenic number of hexanucleotide repeats remains to be established, and intermediate repeat numbers may also be pathological5, most healthy individuals have no more than 23-30
repeats6. Despite the high penetrance of the mutation (up to 90%) which may increase with
advancing age7, the relationship between repeat numbers and age of symptom onset is not firmly
established8 and no validated prognostic indicators currently exist to predict the clinical
manifestation of GGGGCC repeat expansions as FTD or ALS at the asymptomatic stage.
Expansions in the c9orf72 gene can manifest in gain or loss of function9 and lead to
abnormal neuronal aggregates of nuclear RNA foci, dipeptides repeats (DPR) and TDP-43 inclusions9. RNA foci are widely distributed across the central nervous system (CNS) and can be
observed within neuronal nuclei especially in the frontal and motor cortex, hippocampus, cerebellum and spinal cord (SC)10. DPR inclusions are positive for the ubiquitin-binding protein
p62 and negative for TDP-43. They are commonly observed in the cerebellum, hippocampus and in the neocortex11. TDP-43 inclusions have been identified in frontal, temporal and primary motor
regions, as well as in the hippocampus, basal ganglia, amygdala, thalamus and in the midbrain10.
ALS studies have consistently demonstrated that considerable white matter (WM) and significant grey matter (GM) degeneration has already taken place by the time of the diagnosis, limiting the efficacy of neuroprotective interventions12. Asymptomatic carriers of disease-causing
genetic mutations represent an optimal study population to characterise early pathological changes, anatomical patterns of propagation and mechanisms of disease spread. More importantly, the presymptomatic phase of the disease provides an invaluable opportunity to widen the therapeutic window and introduce neuroprotective therapy at the time when GM and WM integrity is still relatively preserved. This notion is increasingly relevant with the emergence of gene-targeted strategies for c9orf72 associated conditions13. To date, the majority of presymptomatic c9orf72
studies focused on cerebral imaging and captured GM and WM alterations years before expected symptom onset14,15,16,17,18. Recent studies indicate that widespread cortical and subcortical
abnormalities can be detected in asymptomatic c9orf72 carriers younger than 40 years of age19. The
frontotemporal, insular, hippocampal and thalamic changes identified in asymptomatic cohorts are consistent with the genotype-associated signature of symptomatic cohorts20.
Cervical SC magnetic resonance spectroscopy (MRS) in asymptomatic SOD1 carriers reveals a similar neurometabolic profile compared to symptomatic ALS patients, namely reduced NAA/Cr and NAA/Myo ratios21. SC pathology in c9orf72 mutations carriers however has not been
studied in vivo to date. In recent years, spinal imaging has seen momentous developments, and the combination of novel biomarkers22 and analysis pipelines23 allows the quantitative characterisation
of disease-associated grey and WM profiles, captures progressive changes and may have a role in diagnostic applications24,25,26,27.
The primary objective of this study is the comprehensive characterisation of cervical SC GM and WM integrity in asymptomatic c9orf72 hexanucleotide carriers. The secondary aim is to appraise longitudinal changes and discuss associations with brain pathology.
Methods
This study was approved by the Ethics Committee (Institutional Research Board) of the Pitié-Salpêtrière University Hospital (Paris) and all the participants provided informed consent (PrevDemAls, NCT02590276).
Seventy-two individuals from 46 families were enrolled in this prospective longitudinal study between 2015 and 2017, they were all first-degree relatives of c9orf72 mutation carriers affected by either ALS or FTD. All the 72 subjects were tested for the c9orf72 genetic status by repeat-primed-PCR and by Southern blot on lymphocytic DNA. Forty out of 72 participants carried the pathogenic expansion (C9+) with more than 30 GGGGCC repeats. The 32 first-degree relatives not carrying the pathogenic expansion (C9-) were used as a control group to reduce the genetic variability in the general population. All participants underwent a standardised and comprehensive neurological and neuropsychological examination with particular attention to upper and lower motor neuron signs, bulbar dysfunction, cognitive and behavioural changes to ensure that they were asymptomatic for both ALS and FTD19. The clinical evaluation was performed by an investigator
(ILB) who was blinded to the genetic status of the subjects. The participants were considered asymptomatic if they did not report any neurological symptoms and did not exhibit any neurological signs. Subjects presenting with cramps, fasciculations or fatigue or any other neurological signs were excluded from the study. Other exclusion criteria included: age younger than 18 years, comorbid SC diseases (previous surgery, trauma, severe disk protrusion, or other neurological conditions involving the SC) and any medical condition precluding MRI.
Similarly to previous studies, the expected age of symptom onset in c9orf72 carriers was estimated by averaging the age of onset of affected individuals in the same family28. All subjects underwent a
Cervical spinal cord acquisition protocol
All the participants underwent standardised 3 Tesla cervical SC magnetic resonance (MR) imaging using a Siemens 3T Magnetom Prisma MRI scanner with a 64-channel head and neck coil. A sagittal 3D T2-weighted fast spin-echo SPACE sequence was used for vertebral level identification with slab selective excitation, voxel size = 0.8×0.8×0.8 mm3, FOV = 256×256 mm2,
72 sagittal slices, TR/TE = 1500/131 ms, acceleration factor R = 2. High-resolution structural anatomical images between C2 and C7 spinal levels were acquired with an axial 2D T2*-weighted multi-echo gradient echo sequence (MEDIC) to provide high in-plane GM-WM contrast22. Voxel
size = 0.5×0.5×5 mm3, FOV = 180×180 mm2, TR/effective TE = 500/22 ms, flip angle = 30°, seven
slices were acquired. The slice orientation and gap were adjusted for each participant so that each slice was acquired at the middle of each cervical vertebral level and the slab was perpendicular to the SC axis.
Spinal diffusion tensor imaging (DTI) data were acquired using a reduced field of view EPI sequence (ZOOMit) with one axial slab covering the C2-C7 vertebral levels. Slices were placed at the middle of each vertebral level and perpendicularly to the SC axis. Imaging parameters were: b = 1000 s/mm2, 60 diffusion-encoding gradient directions, voxel size = 0.8×0.8×5 mm3, FOV =
45×128 mm2, TR/TE = 500/58 ms, flip angle = 90°, and cardiac gating was utilised.
Spinal cord MRI data processing
Imaging data were processed using the Spinal Cord Toolbox v3.1 (SCT)29 by two
investigators blinded to the genetic status and clinical profile of the participants (GQ, ML). Images were first visually inspected for incidental findings and underwent quality control. Two baseline C9- scans and three C9+ follow-up scans were excluded due to poor image quality and motion artefacts. The sagittal 3D T2-weighted volume was automatically segmented using PropSeg30 and
non-linearly registered to the MNI-Poly-AMU template31 to provide automated vertebral labelling
for each subject’s scan. Subsequently, for each vertebral level, automatic SC segmentation and ROI delimitation were performed based on the axial T2*-weighted images using the probabilistic WM/GM AMU and WM tract atlases, as previously described32. GM and WM were automatically
segmented on the T2*-weighted data and WM- cross sectional area (CSA) and GM-CSA were estimated in mm2 22.
DTI images were co-registered to the MNI-Poly-AMU template32. Motion and eddy-current
diffusivity (MD). Using template-based analyses, DTI parameters were calculated for the corticospinal tracts (CSTs) and for the dorsal columns bilaterally and averaged. The MRI protocol used in the study and the results of data analysis are presented in Figure 1.
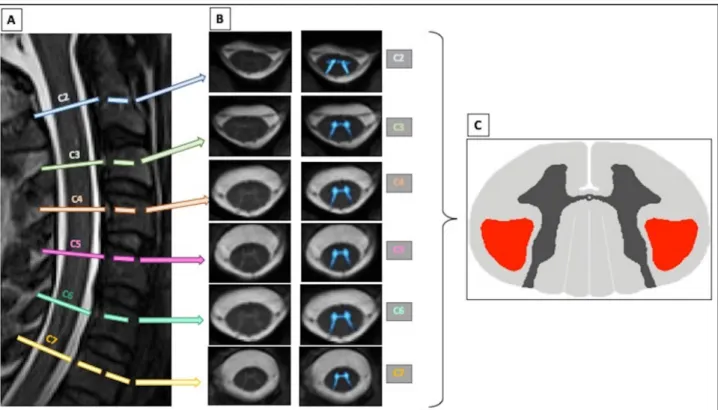
Figure 1. The multiparametric cervical spinal cord MRI protocol here exemplified in a C9-
negative subject includes (A) a T2-weighted SPACE sagittal sequence for vertebral levels identification, (B) an axial high-contrast 2D T2*-weighted sequence for accurate white and grey matter segmentation and (C) a 64-direction DTI sequence (a FA map describing CSTs region of interest is showed hier). Template-based analysis allows the computation of DTI parameters in the corticospinal tracts. CST = corticospinal tract.
Statistical analysis
Statistical analyses were performed using JMP®, Version 13 Pro (SAS Institute Inc., Cary, NC). The Shapiro-Wilk test was used to test for normality. Descriptive variables such as mean, standard deviation, percentage and range were used to summarise quantitative measures. Group comparisons of normally distributed variables were performed using Student’s t-tests. For non-normally distributed data, the 2-tailed unpaired Mann-Whitney U test was used. The Chi-squared test was used to compare categorical data. Spearman’s correlation coefficient was used to evaluate correlations. False Discovery Rate (FDR) was applied to each test to correct for multiple comparisons. The significance level was set at p < 0.05.
Structural and microstructural differences between c9orf72 hexanucleotide carriers and non-carriers were assessed using linear mixed-effects models similarly to our previous paper focusing on the cerebral profile of the same cohort19. Age at imaging, gender, and mutation status were used
as fixed effects, while family membership was considered as random effect. Family membership was defined as a nominal covariate constituted by a code identifying the family of origin of each subject. This parameter was implemented as a covariate in the model to reduce the possibility that genetic factors others than c9orf72 status could influence the results in subjects belonging to the same family.
Statistics were first performed on the entire study population and subsequently in two age-defined sub-groups; those younger and those older than 40 years of age. The age cut-off of 40 years was defined based on the mean age of the study population (42 years +/- 12) and according to our previous paper describing cerebral alterations in the same cohort19 to help the comparative
interpretation of the two studies. An additional analysis was performed in a sub-group of subjects who were related to symptomatic ALS patients as opposed to those only having FTD cases in their family.
A mixed model with two levels of hierarchy was used to analyse longitudinal differences between the baseline and the 18-month evaluation.
Results
Total population C9+ subjects C9- subjects p-value
n 40 32
Age (years) 41.7 ± 11.6 (range 23-76) 45.0 ± 13.1 (range 22-70) 0.23
Sex 17M:23F 16M:16F 0.60
Phenotype in family:
FTD/ALS/mixed 15/3/22 14/2/16 0.96
Estimated number of years
to onset -17.95 ± 11.24 N/a N/a
Expected age of onset 59.1 ± 6.2 N/a N/a
ALSFRS-r score (/48) 48 48 0.99
MMSE score (/30) 28.8 ± 1.5 28.6 ± 1.3 0.34
FAB score (/18) 16.8 ± 1.4 17.1 ± 0.9 0.39
MDRS score (/144) 141.5 ± 3.2 141.4 ± 2.6 0.54
Height (cm) 169 ± 9 (range 150 – 185) 172 ± 8 (range 160 – 187) 0.13
Subjects < 40 years C9+ subjects C9- subjects p-value
n 16 12
Age (years) 32.1 ± 4.3 32.0 ± 5.2 0.69
Gender 8M:8F 5M:7F 0.53
Phenotype in family:
FTD/ALS/mixed 121/1/3 8/1/3 0.82
Estimated number of years
to onset -24.16 ± 10.51 N/a N/a
Height (cm) 171 ± 9.26 (range 152 – 185) 169 ± 8.45 (range 160 – 187) 0.65
Subjects > 40 years C9+ subjects C9- subjects p-value
n 24 20 N/a
Age (years) 53.5 ± 9.12 48.9 ± 9.7 0.12
Gender 10M:14F 9M:11F 0.63
Familial phenotype:
FTD/ALS/mixed 3/2/19 6/1/13 0.70
Estimated number of years
to onset -10.52 ± 9.31 N/a N/a
Height (cm) 168 ± 9.64 (range 150 – 183) 173 ± 6.7 (range 162 – 187) 0.06
Table 1: Demographic and clinical characteristics of study participants. Values are expressed as
mean ± standard deviation, ratio and values’ range. C9+ = carriers of the c9orf72 mutation. Familial phenotype: FTD: frontotemporal dementia; ALS: amyotrophic lateral sclerosis; FTD/ALS: comorbid amyotrophic lateral sclerosis and frontotemporal dementia. ALSFRS-r: ALS functional rating scale revised. MMSE: Mini Mental State Examination. FAB: Frontal Assessment Battery. MDRS: Matting Dementia Rating Scale. Next to each neuropsychological score is indicated, in brackets, the score obtained if all items of the test are correctly performed.
No significant differences were observed for any of the parameters between the C9+ and C9- cohort.
All the subjects were re-evaluated 18-months later. None of the subjects reported any symptoms or exhibited signs of neurological disease. No significant differences were observed between the main demographic parameters either.
No significant differences were detected at baseline when comparing total SC CSA of C9+ and C9- subjects at vertebral levels C2-C7 (p > 0.05). Even after splitting the cohorts based on age (40), no CSA reductions were identified in the C9+ group. No significant differences were observed either when considering only participants with a family history of ALS, but a trend for SC atrophy was observed in C9+ subjects. The complete dataset is shown in supplementary table 1. Similarly, no total CSA reductions were detected at the second timepoint between C9+ and C9- subjects (supplementary table 2) and no progressive cervical SC atrophy was detected between the two timepoints in either group (supplementary table 3).
The effect of c9orf72 status on cervical spinal cord grey matter (GM) cross-sectional area (CSA)
No significant GM CSA differences were detected between the baseline scans of C9+ and C9- subjects at vertebral levels C2-C7 (p > 0.05). Even after splitting the cohorts based on age (40), no GM CSA reductions were identified in the C9+ group. The complete dataset is presented in
supplementary table 4. Similarly, no GM reductions were detected at the second timepoint
between C9+ and C9- subjects (supplementary table 5) and no progressive GM atrophy was detected between the two timepoints in either group (supplementary table 6). No significant differences were observed either when only considering participants with a family history of ALS (supplementary table 5).
The effect of c9orf72 status on cervical spinal cord white matter (WM) cross-sectional area (CSA).
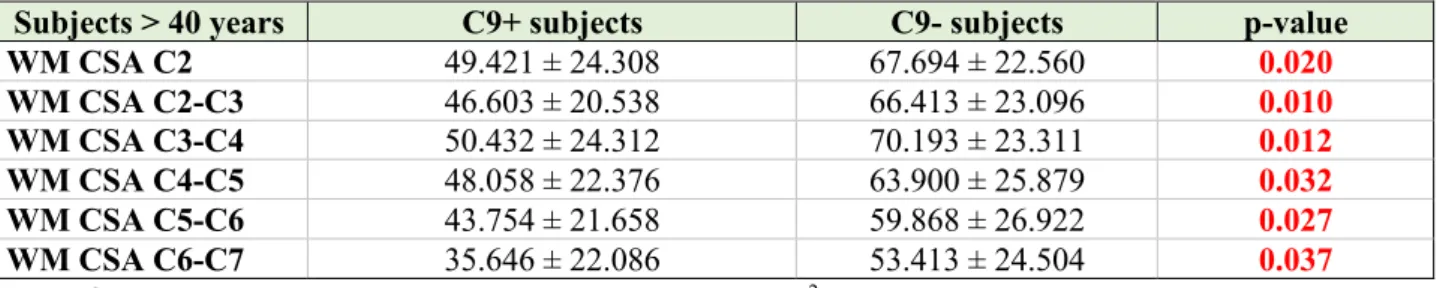
No significant WM CSA reductions were observed in C9+ patients compared to C9- subjects between vertebral levels C2-C7 across the entire study population and in the subgroup of subjects younger than 40 years of age (p > 0.05) (Supplementary table 7). However, significant WM atrophy was detected at each vertebral level in C9+ subjects older than 40 years of age compared to C9- subjects belonging to the same age group (table 2). No correlation was observed between WM CSA and age, between WM CSA and expected time to symptom onset, or the estimated age of symptom onset (p > 0.05).
Subjects > 40 years C9+ subjects C9- subjects p-value WM CSA C2 49.421 ± 24.308 67.694 ± 22.560 0.020 WM CSA C2-C3 46.603 ± 20.538 66.413 ± 23.096 0.010 WM CSA C3-C4 50.432 ± 24.312 70.193 ± 23.311 0.012 WM CSA C4-C5 48.058 ± 22.376 63.900 ± 25.879 0.032 WM CSA C5-C6 43.754± 21.658 59.868 ± 26.922 0.027 WM CSA C6-C7 35.646 ± 22.086 53.413 ± 24.504 0.037
Table 2: White matter (WM) cross-sectional area (CSA, mm2) for C2-C7 vertebral levels presented as mean ± standard deviation in C9+ and C9- subjects older than 40 years of age at the baseline. Using a mixed linear model, significant differences were detected between the two study groups at each cervical vertebral level (results are FDR-corrected and adjusted for age, gender and family membership). C9+ = c9orf72 positive subjects; C9- = c9orf72 negative subjects.
Similar differences were identified between C9+ and C9- patients over 40 at the second time point, (supplementary table 8), but no significant WM CSA reduction was observed between the two assessments (p > 0.05, complete data shown in supplementary table 9).
No significant differences were observed when considering only C9+ and C9- participants with a family history of ALS (supplementary table 7, 8 and 9), even if a clear statistical trend to WM atrophy was observed (FDR-corrected p = 0.09 for CSA at C2 level, p = 0.21 at C2-C3, p = 0,12 at C3-C4, p = 0.17 at C4-C5, p = 0.20 for C5-C6 and p = 0.13 for C6-C7).
The effect of the c9orf72 status on DTI parameters.
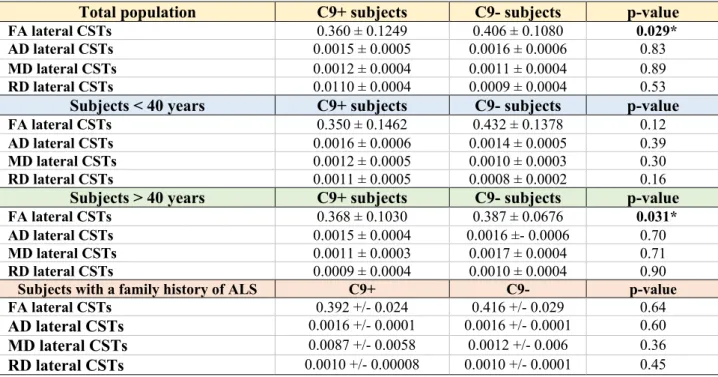
At baseline, no significant differences were identified between C9+ and C9- subjects in the four main DTI parameters (FA, AD, MD, RD) in the CSTs irrespective of studying the entire cohort or splitting them according to age (supplementary table 10). At 18-month follow-up, significant FA reduction was observed in the CSTs of the entire C9+ cohort compared to C9- (FDR-corrected value 0.029) and also in older C9+ subjects compared to C9- subjects over 40 (FDR-corrected p-value = 0.031) (table 3). Other than FA alterations, no differences in AD, MD or RD were detected between the study groups.
Total population C9+ subjects C9- subjects p-value
FA lateral CSTs 0.360 ± 0.1249 0.406 ± 0.1080 0.029*
AD lateral CSTs 0.0015 ± 0.0005 0.0016 ± 0.0006 0.83
MD lateral CSTs 0.0012 ± 0.0004 0.0011 ± 0.0004 0.89
RD lateral CSTs 0.0110 ± 0.0004 0.0009 ± 0.0004 0.53
Subjects < 40 years C9+ subjects C9- subjects p-value
FA lateral CSTs 0.350 ± 0.1462 0.432 ± 0.1378 0.12
AD lateral CSTs 0.0016 ± 0.0006 0.0014 ± 0.0005 0.39
MD lateral CSTs 0.0012 ± 0.0005 0.0010 ± 0.0003 0.30
RD lateral CSTs 0.0011 ± 0.0005 0.0008 ± 0.0002 0.16
Subjects > 40 years C9+ subjects C9- subjects p-value
FA lateral CSTs 0.368 ± 0.1030 0.387 ± 0.0676 0.031*
AD lateral CSTs 0.0015 ± 0.0004 0.0016 ±- 0.0006 0.70
MD lateral CSTs 0.0011 ± 0.0003 0.0017 ± 0.0004 0.71
RD lateral CSTs 0.0009 ± 0.0004 0.0010 ± 0.0004 0.90
Subjects with a family history of ALS C9+ C9- p-value
FA lateral CSTs 0.392 +/- 0.024 0.416 +/- 0.029 0.64
AD lateral CSTs 0.0016 +/- 0.0001 0.0016 +/- 0.0001 0.60
MD lateral CSTs 0.0087 +/- 0.0058 0.0012 +/- 0.006 0.36
RD lateral CSTs 0.0010 +/- 0.00008 0.0010 +/- 0.0001 0.45
Table 3. DTI parameters in the corticospinal tracts expressed as mean ± standard deviation in the entire population and in age-defined subgroups (younger and older than 40 years of age) at the second timepoint. Using mixed linear models, a significant FA reduction was observed in the total population and in subjects older than 40 years of age adjusting for age, gender and height, while no significant difference was present in subjects younger than 40 years of age. *statistically significant differences.
Significant longitudinal CST FA reduction was only observed in subjects older than 40 years (p-value = 0.033). No other progressive diffusivity changes were detected over time (supplementary table 11).
The same DTI analyses were also performed in the dorsal columns. No significant differences were detected between C9+ and C9- subjects for any of the DTI parameters (p > 0.05) neither in the entire study population, nor after stratifying by age (< 40 and > 40 years of age) (Supplementary table 12 and 13).
The effect of family history (ALS versus FTD) on diffusivity parameters
Intriguingly, asymptomatic C9+ subjects with a family history of ALS (n=24) exhibited significant CSTs FA reduction at baseline compared to C9- subjects. (0.61 +/- 0.046 in C9- subjects versus 0.38 +/- 0.038 in C9+ subjects, p = 0.0034). These observations were only evident when considering subjects older than 40 years of age. The results were further confirmed by the follow-up data. Furthermore, no significant differences were observed in dorsal column DTI parameters between C9+ and C9- subjects with a family history of ALS (p > 0.05), suggesting that selective CSTs degeneration is an early event and confirming that in ALS the dorsal columns remain relatively intact in the presymptomatic and early stages of the disease.
Discussion
This study characterises cervical spinal cord WM and GM changes in a large cohort of asymptomatic c9orf72 mutation carriers and evaluates the findings based on mutation status, and family history of ALS versus FTD. Despite considerable advances in spinal imaging technology, no study has been dedicated to date to the characterisation of c9orf72-associated SC pathology.
The main finding of our study is that C9+ subjects older than 40 years of age exhibit considerable WM atrophy at each vertebral level in conjunction with progressive pyramidal tract FA reductions. The lack of apparent GM involvement and detectable WM pathology in subjects younger than 40, are other important findings.
Early detection of WM alterations and ensuing GM degeneration has been reported in both genetically determined FTD28 and ALS12. The effect of age on presymptomatic spinal metrics
identified in this study was not detected at the cerebral level in the same subjects19. On the contrary,
structural and microstructural brain changes could be readily detected in C9+ subjects younger than 40. Considerable cerebral changes in young C9+ individuals have also been reported in other studies14,15,17,33. The divergent chronological patterns between longitudinal cerebral and spinal
alterations offer novel insights about the propagation of c9orf72-associated conditions. Cerebral changes in young asymptomatic C9+ subjects have been previously interpreted as neurodevelopmental or early degenerative processes16. The link between age and accruing SC
pathology detected in our study suggests incremental neurodegeneration.
No CST FA reductions were detected at baseline, but these was evident in subjects older than 40 years of age on 18-month follow-up, suggesting that incremental degeneration may take place when mutation carriers are approaching symptom onset. These conclusions remain speculative since the expected time of onset was estimated based on symptomatic family members and considerable intra-familial heterogeneity exists in symptom onset34. Further follow-up at a later
time point is required to reassuringly test these hypotheses.
Another integrative interpretation of our findings is that c9orf72-associated changes are primarily cerebral initially, confined to brain regions at a younger age, and show progressive propagation to spinal regions. This would support emerging concepts of corticofugal pathological spread in ALS and FTD35. The precise molecular mechanisms underlying c9orf72-associated
degeneration remains largely unknown, even if putative cell-to-cell propagation of the DPRs and TDP-43 inclusions has been proposed36. Despite the detection sensitivity of novel spinal imaging
techniques in ALS24,25,26,37,38,39, the lack of imaging findings in younger mutation carriers may be
due to technological limitations and does not necessarily represent lack of pathology.
Presymptomatic imaging in c9orf72 has a dual academic and clinical relevance. Hexanucleotide repeats may eventually manifest in a primarily cerebral condition (FTD) or in the multisystem cerebro-spinal phenotype ALS or ALS-FTD. No accurate indicators currently exist to predict future conversion; therefore, the assessment of spinal metrics may be the key to appraise the risk of phenotypic conversion to ALS versus FTD. In our cohort, FA reduction was observed at baseline when analysis was restricted to subjects related to symptomatic ALS patients. Additionally, an important trend for total CSA reduction was observed in subjects with a family history of ALS. No systematic studies are currently available regarding the relative risk of developing ALS versus FTD depending on the phenotypic manifestation of the mutation in a given family. Existing studies suggest that the imaging profile of c9orf72 ALS and FTD patients is different, with ALS patients presenting with more prominent motor system involvement compared to FTD patients40. The presymptomatic corticospinal tract FA reduction detected in our study could
indicate a higher risk of conversion to ALS than FTD. The results are further supported by the lack of dorsal column diffusivity changes, suggesting that selective FA reduction in the CSTs could be an early event in the natural history of the disease in subjects destined to develop ALS. Robust, prospective longitudinal studies are needed to track young (<40) patients with multimodal spinal and cerebral imaging – preferably with a panel of wet biomarkers and neurophysiology – until symptomatic conversion to ascertain which early markers best predict conversion to ALS and which may be indicative of conversion risk to FTD. SC imaging metrics may be particularly well suited to identify those at risk of converting to ALS as opposed to relying on cerebral imaging indices alone. An obvious advantage of spinal imaging, compared to cerebral imaging, is that it has the potential to appraise both the lower (spinal-GM) and upper (CST DTI, WM-CSA) motor neuron components of the motor system separately.
In this study, SC WM atrophy was observed at baseline without concomitant diffusivity alterations. This stands in contrast with the widespread DTI alterations at the cerebral level in the same cohort of patients19 as well as previous cerebral c9orf72 studies in asymptomatic or
symptomatic patients14, 15,40,41. This discrepancy could be due to the divergent sensitivity profile of
spinal and cerebral DTI. Advanced DTI methods are particularly challenging at the spinal level because of the small cross-sectional area of the human cord, physiological motions due to
fluid and magnetic field inhomogeneities around the intervertebral discs and the lungs42. It is also
important to acknowledge that DTI metrics such as FA or MD are not pathology-specific but composite measures of WM integrity43. RD and AD are thought to be histologically more accurate
representing myelin and axonal changes with more specificity. Furthermore, emerging diffusion imaging techniques such as Neurite orientation dispersion and density imaging (NODDI) may have superior detection sensitivity and be particularly useful in detecting crossing fibre degeneration44,45.
NODDI is an advanced diffusion imaging technique that has already been applied to highlight widespread presymptomatic changes in asymptomatic C9+ subjects from the same cohort46.
Accordingly, WM atrophy, which is closely related to neurite density and is readily measurable in the cervical SC, may be a more sensitive marker of pathology than DTI metrics at the early asymptomatic stage of the disease. Spinal DTI changes are more likely to be detected when multiple cellular events have taken place, such as axonal degeneration, demyelination, membrane disintegration and fibre orientation loss. A few spinal cord imaging studies have validated the histological and microstructural correlates of diffusivity metrics, but the pathological underpinnings of WM volumes are especially poorly characterised47. Our current understanding of the
microstructural correlates of MRI metrics in neurologic conditions are largely putative, further animal studies are needed, and robust human combined post mortem MRI and histology studies are required48,49.
Our study is not without limitations. Even if our entire study population is relatively large considering the rarity of the c9orf72 presymptomatic carriers, the number of subjects in each group after the sub-classification leads to limited sample sizes and the statistical power of the model is therefore reduced.
Notwithstanding these limitations, our study confirms that presymptomatic imaging is a powerful tool to investigate the temporal and spatial propagation of pathology and may have an important prognostic role. The establishment of the sensitivity profile of multiple imaging metrics in the asymptomatic phase of the disease has implications for prognostication, genetic counselling and future therapeutic trials. Combining these imaging measures with wet biomarkers such as neurofilament light chains50 may increase the diagnostic, prognostic and monitoring potential of
these indices further. Ultimately, the careful synthesis of cerebral and spinal imaging, the integration of biofluid markers, robust multi-timepoint longitudinal designs and post mortem validation will be needed to map the sequential spread of c9orf72-associated pathology.
Acknowledgements
We gratefully acknowledge the kindness and generosity of all study participants. This study was supported by the Assistance Publique – Hôpitaux de Paris (Clinical Research and Development Department) grant ANR/DGOS PRTS 2015-2019 PrevDemAls (to I.L.B.), the “Investissements d’avenir” ANR-10-IAIHU-06 (Agence Nationale de la Recherche-10-Investissements-Avenir Institut-Hospitalo-Universitaire-06), the Centre d’Investigation Clinique (CIC 1422), and the Centre pour l’Acquisition et le Traitement des Images (CATI) platform, at IHU-A-ICM, Paris, France. This study has been registered on http://clinicaltrials.gov/ under number NCT02590276. Peter Bede is supported by the Health Research Board (HRB EIA-2017-019), the Andrew Lydon scholarship, the Irish Institute of Clinical Neuroscience IICN − Novartis Ireland Research Grant, and the Iris O'Brien Foundation.
Author contributions
Conception and design of the study: GQ, PB, MEM, ILB, PFP
Acquisition and analysis of data: GQ, PB, MEM, ML, MP, DR, AC, JC, OC Drafting the text or preparing the figures: GQ, PB, MC, DS, FS, VMP, ILB, PFP
Members of the Predict to Prevent Frontotemporal Lobar Degeneration and Amyotrophic Lateral Sclerosis (PREV-DEMALS) Study Group and their affiliations are listed in Supplementary table 13.
Potential conflict of interest
References
1. Cruts M, Gijselinck I, Van Langenhove T, et al. Current insights into the C9orf72 repeat expansion diseases of the FTLD/ALS spectrum. Trends Neurosci. 2013;36(8):450–459.
2. Swinnen B, Robberecht W. The phenotypic variability of amyotrophic lateral sclerosis. Nature Reviews Neurology 2014;10(11):661–670.
3. DeJesus-Hernandez M, Mackenzie IR, Boeve BF, et al. Expanded GGGGCC hexanucleotide repeat in noncoding region of C9ORF72 causes chromosome 9p-linked FTD and ALS. Neuron 2011;72(2):245–256.
4. Pearson JP, Williams NM, Majounie E, et al. Familial frontotemporal dementia with amyotrophic lateral sclerosis and a shared haplotype on chromosome 9p. J. Neurol. 2011;258(4):647–655.
5. Byrne S, Walsh C, Lynch C, et al. Rate of familial amyotrophic lateral sclerosis: a systematic review and meta-analysis. J. Neurol. Neurosurg. Psychiatry 2011;82(6):623–627.
6. van der Zee J, Gijselinck I, Dillen L, et al. A pan-European study of the C9orf72 repeat associated with FTLD: geographic prevalence, genomic instability, and intermediate repeats. Hum. Mutat. 2013;34(2):363–373.
7. Murphy NA, Arthur KC, Tienari PJ, et al. Age-related penetrance of the C9orf72 repeat expansion. Sci Rep 2017;7(1):2116.
8. Fournier C, Barbier M, Camuzat A, et al. Relations between C9orf72 expansion size in blood, age at onset, age at collection and transmission across generations in patients and presymptomatic carriers. Neurobiol. Aging 2018; 74:234.e1-234.e8.
9. Balendra R, Isaacs AM. C9orf72-mediated ALS and FTD: multiple pathways to disease. Nat Rev Neurol 2018;14(9):544–558.
10. Mackenzie IR, Arzberger T, Kremmer E, et al. Dipeptide repeat protein pathology in C9ORF72 mutation cases: clinico-pathological correlations. Acta Neuropathol. 2013;126(6):859–879. 11. Turner MR. Non-invasive in vivo neuropathology of the C9orf72-related ALS-FTD syndrome.
J. Neurol. Neurosurg. Psychiatry 2018;89(1):4–5.
12. Bede P, Hardiman O. Longitudinal structural changes in ALS: a three time-point imaging study of white and gray matter degeneration. Amyotroph Lateral Scler Frontotemporal Degener 2018;19(3–4):232–241.
13. Mis MSC, Brajkovic S, Tafuri F, et al. Development of Therapeutics for C9ORF72 ALS/FTD-Related Disorders. Mol. Neurobiol. 2017;54(6):4466–4476.
14. Walhout R, Schmidt R, Westeneng H-J, et al. Brain morphologic changes in asymptomatic C9orf72 repeat expansion carriers. Neurology 2015;85(20):1780–1788.
15. Floeter MK, Bageac D, Danielian LE, et al. Longitudinal imaging in C9orf72 mutation carriers: Relationship to phenotype. Neuroimage Clin 2016;12:1035–1043.
16. Lee SE, Sias AC, Mandelli ML, et al. Network degeneration and dysfunction in presymptomatic C9ORF72 expansion carriers. Neuroimage Clin 2017;14:286–297.
17. Papma JM, Jiskoot LC, Panman JL, et al. Cognition and gray and white matter characteristics of presymptomatic C9orf72 repeat expansion. Neurology 2017;89(12):1256–1264.
18. Popuri K, Dowds E, Beg MF, et al. Gray matter changes in asymptomatic C9orf72 and GRN mutation carriers. Neuroimage Clin 2018;18:591–598.
19. Bertrand A, Wen J, Rinaldi D, et al. Early Cognitive, Structural, and Microstructural Changes in Presymptomatic C9orf72 Carriers Younger Than 40 Years. JAMA Neurol 2018;75(2):236– 245.
20. Machts J, Loewe K, Kaufmann J, et al. Basal ganglia pathology in ALS is associated with neuropsychological deficits. Neurology 2015;85(15):1301–1309.
21. Carew JD, Nair G, Andersen PM, et al. Presymptomatic spinal cord neurometabolic findings in SOD1-positive people at risk for familial ALS. Neurology 2011;77(14):1370–1375.
22. Martin AR, De Leener B, Cohen-Adad J, et al. A Novel MRI Biomarker of Spinal Cord White Matter Injury: T2*-Weighted White Matter to Gray Matter Signal Intensity Ratio. AJNR Am J Neuroradiol 2017;38(6):1266–1273.
23. De Leener B, Taso M, Cohen-Adad J, Callot V. Segmentation of the human spinal cord. MAGMA 2016;29(2):125–153.
24. El Mendili M-M, Cohen-Adad J, Pelegrini-Issac M, et al. Multi-Parametric Spinal Cord MRI as Potential Progression Marker in Amyotrophic Lateral Sclerosis. PLoS ONE 2014;9(4):e95516. 25. Querin G, El Mendili MM, Lenglet T, et al. Spinal cord multi-parametric magnetic resonance imaging for survival prediction in amyotrophic lateral sclerosis. European Journal of Neurology 2017;24(8):1040-1046.
26. Grolez G, Kyheng M, Lopes R, et al. MRI of the cervical spinal cord predicts respiratory dysfunction in ALS. Sci Rep 2018;8(1):1828.
27. Querin G, El Mendili M-M, Bede P, et al. Multimodal spinal cord MRI offers accurate diagnostic classification in ALS. J. Neurol. Neurosurg. Psychiatry 2018;89(11):1220–1221. 28. Rohrer JD, Nicholas JM, Cash DM, et al. Presymptomatic cognitive and neuroanatomical
changes in genetic frontotemporal dementia in the Genetic Frontotemporal dementia Initiative (GENFI) study: a cross-sectional analysis. Lancet Neurol 2015;14(3):253–262.
29. De Leener B, Lévy S, Dupont SM, et al. SCT: Spinal Cord Toolbox, an open-source software for processing spinal cord MRI data. Neuroimage 2017;145(Pt A):24–43.
30. De Leener B, Kadoury S, Cohen-Adad J. Robust, accurate and fast automatic segmentation of the spinal cord. Neuroimage 2014;98:528–536.
31. Fonov VS, Le Troter A, Taso M, et al. Framework for integrated MRI average of the spinal cord white and gray matter: the MNI-Poly-AMU template. Neuroimage 2014;102 Pt 2:817– 827.
33. Boxer AL, Mackenzie IR, Boeve BF, et al. Clinical, neuroimaging and neuropathological features of a new chromosome 9p-linked FTD-ALS family. J. Neurol. Neurosurg. Psychiatry 2011;82(2):196–203.
34. Devenney E, Foxe D, Dobson-Stone C, et al. Clinical heterogeneity of the C9orf72 genetic mutation in frontotemporal dementia. Neurocase 2015;21(4):535–541.
35. Braak H, Brettschneider J, Ludolph AC, et al. Amyotrophic lateral sclerosis--a model of corticofugal axonal spread. Nat Rev Neurol 2013;9(12):708–714.
36. Westergard T, Jensen BK, Wen X, et al. Cell-to-Cell Transmission of Dipeptide Repeat Proteins Linked to C9orf72-ALS/FTD. Cell Rep 2016;17(3):645–652.
37. Branco LMT, De Albuquerque M, De Andrade HMT, et al. Spinal cord atrophy correlates with disease duration and severity in amyotrophic lateral sclerosis. Amyotroph Lateral Scler Frontotemporal Degener 2014;15(1–2):93–97.
38. de Albuquerque M, Branco LMT, Rezende TJR, et al. Longitudinal evaluation of cerebral and spinal cord damage in Amyotrophic Lateral Sclerosis. Neuroimage Clin 2017;14:269–276. 39. Paquin M-Ê, El Mendili MM, Gros C, et al. Spinal Cord Gray Matter Atrophy in Amyotrophic
Lateral Sclerosis. AJNR Am J Neuroradiol 2018;39(1):184–192.
40. Bede P, Elamin M, Byrne S, et al. Basal ganglia involvement in amyotrophic lateral sclerosis. Neurology 2013;81(24):2107–2115.
41. Agosta F, Ferraro PM, Riva N, et al. Structural and functional brain signatures of C9orf72 in motor neuron disease. Neurobiol. Aging 2017;57:206–219.
42. Pradat P-F, El Mendili M-M. Neuroimaging to investigate multisystem involvement and provide biomarkers in amyotrophic lateral sclerosis. Biomed Res Int 2014;2014:467560. 43. Concha L. A macroscopic view of microstructure: using diffusion-weighted images to infer
damage, repair, and plasticity of white matter. Neuroscience 2014; 276:14–28.
44. Broad RJ, Gabel MC, Dowell NG, et al. Neurite orientation and dispersion density imaging (NODDI) detects cortical and corticospinal tract degeneration in ALS. J. Neurol. Neurosurg. Psychiatry 2018; pii: jnnp-2018-318830.
45. Gatto RG, Li W, Magin RL. Diffusion tensor imaging identifies presymptomatic axonal degeneration in the spinal cord of ALS mice. Brain Res. 2018;1679:45–52.
46. Wen J, Zhang H, Alexander DC, et al. Neurite density is reduced in the presymptomatic phase of C9orf72 disease. J. Neurol. Neurosurg. Psychiatry 2018; Oct 24. pii: jnnp-2018-318994. 47. Marcuzzo S, Bonanno S, Figini M, et al. A longitudinal DTI and histological study of the spinal
cord reveals early pathological alterations in G93A-SOD1 mouse model of amyotrophic lateral sclerosis. Exp. Neurol. 2017; 293:43–52.
48. Mollink J, Kleinnijenhuis M, Cappellen van Walsum A-M van, et al. Evaluating fibre orientation dispersion in white matter: Comparison of diffusion MRI, histology and polarized light imaging. Neuroimage 2017; 157:561–574.
49. Pallebage-Gamarallage M, Foxley S, Menke RAL, et al. Dissecting the pathobiology of altered MRI signal in amyotrophic lateral sclerosis: A post mortem whole brain sampling strategy for the integration of ultra-high-field MRI and quantitative neuropathology. BMC Neurosci 2018;19(1):11.
50. Benatar M, Wuu J, Andersen PM, et al. Neurofilament light: A candidate biomarker of presymptomatic amyotrophic lateral sclerosis and phenoconversion. Ann. Neurol. 2018;84(1):130–139.
Supplementary table 1. Total cross-sectional area (CSA, mm2) for vertebral levels C2-C7 presented as mean and standard deviation in C9+ and C9- subjects at baseline. Comparisons are FDR corrected and adjusted for age, gender and family membership.
C9+ = c9orf72 positive subjects; C9- = c9orf72 negative subjects.
Total population C9+ C9- p-value
CSA C2 79.306 +/- 1.126 79.568 +/- 1.294 0.89 CSA C2-C3 79.830 +/- 1.321 79.484 +/- 1.492 0.84 CSA C3-C4 82.123 +/- 1.456 81.767 +/- 1.622 0.77 CSA C4-C5 79.895 +/- 1.798 79.609 +/- 2.031 0.75 CSA C5-C6 73.214 +/- 1.743 72.622 +/- 1.969 0.76 CSA C6-C7 62.386 +/- 1.852 61.957 +/- 2.091 0.89
Subjects < 40 years C9+ C9- p-value
CSA C2 77.651 +/- 1.632 77.743 +/- 1.811 0.64 CSA C2-C3 79.100 +/- 2.062 78.663 +/- 2.287 0.82 CSA C3-C4 80.621 +/- 2.519 80.205 +/- 2.706 0.96 CSA C4-C5 79.208 +/- 3.203 77.676 +/- 3.699 0.99 CSA C5-C6 73.058 +/- 2.798 71.501 +/- 3.231 0.93 CSA C6-C7 62.422 +/- 2.758 60.356 +/- 3.059 0.74
Subjects > 40 years C9+ C9- p-value
CSA C2 79.305 +/- 1.475 79.880 +/- 1.623 0.89 CSA C2-C3 79.198 +/- 1.709 79.523 +/- 1.880 0.88 CSA C3-C4 81.409 +/- 1.790 81.344 +/- 1.970 0.87 CSA C4-C5 78.265 +/- 2.185 79.006 +/- 2.404 0.78 CSA C5-C6 71.050 +/- 2.263 72.143 +/- 2.490 0.81 CSA C6-C7 60.277 +/- 2.477 61.429 +/- 2.726 0.80
Subjects with a family history of ALS C9+ C9- p-value
CSA C2 79.147 +/- 1.393 80.993 +/- 1.674 0.54 CSA C2-C3 79.951 +/- 1.577 81.572 +/- 1.896 0.86 CSA C3-C4 82.351 +/- 1.754 84.584 +/- 2.108 0.68 CSA C4-C5 79.337 +/- 2.176 82.618 +/- 2.616 0.73 CSA C5-C6 73.055 +/- 2.174 74.839 +/- 2.613 0.98 CSA C6-C7 62.601 +/- 2.481 64.214 +/- 2.982 0.93
Supplementary table 2. Total cross-sectional area (CSA, mm2) for vertebral levels C2-C7 presented as mean and standard deviation in C9+ and C9- subjects at 18-month follow-up. Comparisons are FDR corrected and adjusted for age, gender and family membership.
C9+ = c9orf72 positive subjects; C9- = c9orf72 negative subjects.
Total population C9+ C9- p-value
CSA C2 79.663 +/- 1.004 78.523 +/- 1.139 0.54 CSA C2-C3 80.066 +/- 1.116 78.905 +/- 1.266 0.31 CSA C3-C4 84.968 +/- 1.252 82.021 +/- 1.419 0.48 CSA C4-C5 81.064 +/- 2.246 80.276 +/- 2.593 0.72 CSA C5-C6 76.201 +/- 1.534 74.280 +/- 1.840 0.55 CSA C6-C7 63.826 +/- 1.558 63.518 +/- 1.843 0.75
Subjects < 40 years C9+ C9- p-value
CSA C2 77.651 +/- 1.632 77.743 +/- 1.811 0.37 CSA C2-C3 79.100 +/- 2.062 78.663 +/- 2.287 0.63 CSA C3-C4 80.621 +/- 2.519 80.205 +/- 2.706 0.36 CSA C4-C5 79.208 +/- 3.203 77.676 +/- 3.699 0.97 CSA C5-C6 73.058 +/- 2.798 71.501 +/- 3.231 0.22 CSA C6-C7 62.422 +/- 2,758 60.356 +/- 3.059 0.43
Subjects > 40 years C9+ C9- p-value
CSA C2 80.020 +/- 1.465 79.821 +/- 1.691 0.86 CSA C2-C3 79.844 +/- 1.481 79.070 +/- 1.710 0.61 CSA C3-C4 84.083 +/- 1.578 82.695 +/- 1.822 0.37 CSA C4-C5 82.163 +/- 1.785 81.110 +/- 2.062 0.29 CSA C5-C6 74.662 +/- 1.953 74.483 +/- 2.255 0.75 CSA C6-C7 62.236 +/- 1.935 64.085 +/- 2.234 0.58
Subjects with a family history of ALS C9+ C9- p-value
CSA C2 79.584 +/- 1.350 80.703 +/- 1.546 0.93 CSA C2-C3 79.718 +/- 1.382 81.554 +/- 1.583 0.80 CSA C3-C4 84.677 +/- 1.322 85.912 +/- 1.515 0.79 CSA C4-C5 79.885 +/- 3.308 84.869 +/- 3.915 0.28 CSA C5-C6 76.160 +/- 1.752 77.723 +/- 2.145 0.56 CSA C6-C7 63.662 +/- 1.816 66.612 +/- 2.224 0.74
Supplementary table 3. Total SC cross-sectional area (CSA, mm2) for vertebral levels C2-C7 presented as mean and standard deviation in C9+ subjects at baseline and at 18-month follow-up. Comparisons are FDR corrected and adjusted for age, gender and family membership.
C9+ = c9orf72 positive subjects; C9- = c9orf72 negative subjects.
Total population Baseline 18-months evaluation p-value
CSA C2 80.165 +/- 1.210 79.584 +/- 1.266 0.60 CSA C2-C3 80.974 +/- 1.386 79.718 +/- 1.451 0.73 CSA C3-C4 83.969 +/- 1.551 84.677 +/- 1.624 0.66 CSA C4-C5 81.497 +/- 3.065 79.885 +/- 3.208 0.78 CSA C5-C6 74.226 +/- 1.708 76.160 +/- 1.788 0.22 CSA C6-C7 63.053 +/- 2.025 63.662 +/- 2.119 0.71
Subjects <40 years Baseline 18-months evaluation p-value
CSA C2 77.670 +/- 1.773 78.751 +/- 1.763 0.42 CSA C2-C3 78.839 +/- 2.943 79.366 +/- 1.941 0.49 CSA C3-C4 80.541 +/- 2.745 84.351 +/- 2.400 0.48 CSA C4-C5 79.090 +/- 4.618 77.482 +/- 3.345 0.91 CSA C5-C6 72.892 +/- 2.404 75.472 +/- 2.737 0.36 CSA C6-C7 62.086 +/- 2.473 62.909 +/- 2.554 0.78
Subjects > 40 years Baseline 18-months evaluation p-value
CSA C2 79.836 +/- 1.361 79.676 +/- 1.224 0.75 CSA C2-C3 79.020 +/- 1.585 79.398 +/- 1.426 0.79 CSA C3-C4 80.959 +/- 1.797 83.223 +/- 1.617 0.22 CSA C4-C5 80.858 +/- 1.792 77.948 +/- 1.991 0.11 CSA C5-C6 73.643 +/- 1.745 70.640 +/- 1.939 0.20 CSA C6-C7 61.662 +/- 1.468 58.174 +/- 1.632 0.25
Subjects with a family history of ALS Baseline 18-months evaluation p-value
CSA C2 80.165 +/- 1.210 79.584 +/- 1.266 0.73 CSA C2-C3 80.974 +/- 1.386 79.718 +/- 1.451 0.72 CSA C3-C4 83.969 +/- 1.551 84.677 +/- 1.624 0.40 CSA C4-C5 81.497 +/- 3.065 79.885 +/- 3.208 0.78 CSA C5-C6 74.226 +/- 1.708 76.160 +/- 1.788 0.32 CSA C6-C7 63.053 +/- 2.025 63.662 +/- 2.119 0.71
Supplementary table 4. Grey matter (GM) cross-sectional area (CSA, mm2) at vertebral levels C2-C7 presented as mean and standard deviation in C9+ and C9- subjects at baseline. Comparisons are FDR corrected and adjusted for age, gender and family membership.
C9+ = c9orf72 positive subjects; C9- = c9orf72 negative subjects.
Total population C9+ subjects C9- subjects p-value
GM CSA C2 14.738 +/- 2.529 13.723 +/- 2.446 0.34 GM CSA C2-C3 13.931 +/- 1.892 13.578 +/- 2.572 0.31 GM CSA C3-C4 15.050 +/- 2.190 14.350 +/- 2.506 0.32 GM CSA C4-C5 14.414 +/- 2.408 13.368 +/- 3.178 0.30 GM CSA C5-C6 13.372 +/- 2.132 13.047 +/- 2.793 0.38 GM CSA C6-C7 11.169 +/- 2.300 11.097 +/- 2.640 0.49
Subjects < 40 years C9+ subjects C9- subjects p-value
GM CSA C2 13.388 +/- 2.256 14.102 +/- 1.791 0.75 GM CSA C2-C3 13.357 +/- 2.366 13.585 +/- 2.114 0.73 GM CSA C3-C4 13.954 +/- 2.745 14.493 +/- 1.850 0.72 GM CSA C4-C5 13.171 +/- 3.402 13.236 +/- 2.462 0.73 GM CSA C5-C6 12.731 +/- 3.848 12.786 +/- 2.033 0.75 GM CSA C6-C7 10.679 +/- 3.094 10.541 +/- 2.339 0.43
Subjects > 40 years C9+ subjects C9- subjects p-value
GM CSA C2 15.173 +/- 2.822 14.113 +/- 1.949 0.57 GM CSA C2-C3 14.234 +/- 1.750 13.806 +/- 2.435 0.82 GM CSA C3-C4 15.395 +/- 2.408 14.433 +/- 2.938 0.31 GM CSA C4-C5 14.669 +/- 2.403 13.714 +/- 2.557 0.66 GM CSA C5-C6 13.774 +/- 2.182 12.7766 +/- 2.765 0.38 GM CSA C6-C7 11.645 +/- 2.235 11.384 +/- 2.342 0.56
Subjects with a family history of ALS C9+ C9- p-value
GM CSA C2 15.051 +/- 0.429 14.352 +/- 0.505 0.27 GM CSA C2-C3 14.319 +/- 0.330 14.543 +/- 0.389 0.86 GM CSA C3-C4 15.213 +/- 0.474 15.121 +/- 0.558 0.55 GM CSA C4-C5 14.871 +/- 0.458 14.279 +/- 0.540 0.30 GM CSA C5-C6 13.568 +/- 0.454 13.760 +/- 0.536 0.86 GM CSA C6-C7 11.774 +/- 0.510 11.571 +/- 0.580 0.68
Supplementary table 5. Grey matter (GM) cross-sectional area (CSA, mm2) at vertebral levels C2-C7 presented as mean and standard deviation in C9+ and C9- subjects at 18-month follow-up. Comparisons are FDR corrected and adjusted for age, gender and family membership.
C9+ = c9orf72 positive subjects; C9- = c9orf72 negative subjects.
Total population C9+ subjects C9- subjects p-value
GM CSA C2 14.220 +/- 3.018 13.418 +/- 0.351 0.65 GM CSA C2-C3 14.509 +/- 3.850 13.503 +/- 2.001 0.83 GM CSA C3-C4 14.803 +/- 2.812 14.405 +/- 1.772 0.36 GM CSA C4-C5 14.390 +/- 3.050 13.530 +/- 2.492 0.65 GM CSA C5-C6 13.485 +/- 2.346 12.566 +/- 1.988 0.44 GM CSA C6-C7 11.798 +/- 2.566 10.903 +/- 1.751 0.27
Subjects < 40 years C9+ subjects C9- subjects p-value
GM CSA C2 14.402 +/- 1.565 13.927 +/- 1.892 0.46 GM CSA C2-C3 14.509 +/- 3.850 13.653 +/- 1.940 0.67 GM CSA C3-C4 15.710 +/- 3.146 14.802 +/- 1.471 0.69 GM CSA C4-C5 14.710 +/- 3.345 14.280 +/- 1.969 0.72 GM CSA C5-C6 13.184 +/- 2.707 13.232 +/- 1.912 0.36 GM CSA C6-C7 11.037 +/- 2.669 10.580 +/- 1.235 0.41
Subjects > 40 years C9+ subjects C9- subjects p-value
GM CSA C2 14.037 +/- 2.166 13.428 +/- 2.252 0.31 GM CSA C2-C3 14.098 +/- 2.000 13.799 +/- 2.358 0.94 GM CSA C3-C4 14.156 +/- 2.188 14.407 +/- 2.121 0.72 GM CSA C4-C5 14.198 +/- 2.815 13.559 +/- 1.242 0.50 GM CSA C5-C6 13.804 +/- 1.914 13.072 +/- 1.888 0.87 GM CSA C6-C7 12.618 +/- 0.560 11.302 +/- 2.099 0.19
Subjects with a family history of ALS C9+ C9- p-value
GM CSA C2 15.051 +/- 0.429 14.352 +/- 0.505 0.27 GM CSA C2-C3 14.319 +/- 0.330 14.543 +/- 0.389 0.86 GM CSA C3-C4 15.213 +/- 0.474 15.121 +/- 0.558 0.55 GM CSA C4-C5 14.871 +/- 0.458 14.279 +/- 0.540 0.30 GM CSA C5-C6 13.568 +/- 0.454 13.760 +/- 0.536 0.86 GM CSA C6-C7 11.774 +/- 0.510 11.571 +/- 0.580 0.68
Supplementary table 6. Grey matter (GM) cross-sectional area (CSA, mm2) at vertebral levels C2-C7 presented as mean and standard deviation in C9+ subjects at baseline and at 18-month follow-up. P-values are FDR corrected and adjusted for age, gender and family membership.
C9+ = c9orf72 positive subjects; C9- = c9orf72 negative subjects.
Total population Baseline 18-months evaluation p-value
GM CSA C2 14.738 +/- 2.529 14.220 +/- 3.018 0.16 GM CSA C2-C3 13.931 +/- 1.892 14.509 +/- 3.850 0.69 GM CSA C3-C4 15.050 +/- 2.190 14.803 +/- 2.812 0.55 GM CSA C4-C5 14.414 +/- 2.408 14.390 +/- 3.050 0.82 GM CSA C5-C6 13.372 +/- 2.132 13.485 +/- 2.346 0.90 GM CSA C6-C7 11.169 +/- 2.300 11.798 +/- 2.566 0.40
Subjects <40 years Baseline 18-months evaluation p-value
GM CSA C2 13.388 +/- 2.256 14.402 +/- 1.565 0.45 GM CSA C2-C3 13.357 +/- 2.366 14.509 +/- 3.850 0.36 GM CSA C3-C4 13.954 +/- 2.745 15.710 +/- 3.146 0.16 GM CSA C4-C5 13.171 +/- 3.402 14.710 +/- 3.345 0.94 GM CSA C5-C6 12.731 +/- 3.848 13.184 +/- 2.707 0.89 GM CSA C6-C7 10.679 +/- 3.094 11.037 +/- 2.669 0.73
Subjects > 40 years Baseline 18-months evaluation p-value
GM CSA C2 15.173 +/- 2.822 14.037 +/- 2.166 0.24 GM CSA C2-C3 14.234 +/- 1.750 14.098 +/- 2.000 0.65 GM CSA C3-C4 15.395 +/- 2.408 14.156 +/- 2.188 0.74 GM CSA C4-C5 14.669 +/- 2.403 14.198 +/- 2.815 0.72 GM CSA C5-C6 13.774 +/- 2.182 13.804 +/- 1.914 0.81 GM CSA C6-C7 11.645 +/- 2.235 12.618 +/- 0.560 0.59
Subjects with a family history of ALS Baseline 18-months evaluation p-value
GM CSA C2 15.5033 +/- 0.409 14.624 +/- 0.429 0.32 GM CSA C2-C3 14.469 +/- 0.489 15.012 +/- 0.513 0.40 GM CSA C3-C4 15.319 +/- 0.589 15.304 +/- 0.618 0.95 GM CSA C4-C5 14.479 +/- 0.579 14.378 +/- 0.607 0.50 GM CSA C5-C6 13.876 +/- 0.460 13.760 +/- 0.536 0.94 GM CSA C6-C7 11.864 +/- 0.489 12.212 +/- 0.480 0.82
Supplementary table 7. White matter (WM) cross-sectional area (CSA, mm2) at vertebral levels C2-C7 presented as mean value and standard deviation in C9+ and C9- subjects’ populations at the baseline visit. P-values are FDR corrected and adjusted for age, gender and family membership). C9+ = c9orf72 positive subjects; C9- = c9orf72 negative subjects.
Total population C9+ C9- p-value
WM CSA C2 60.550 +/- 30.452 67.818 +/- 28.201 0.39 WM CSA C2-C3 56.239 +/- 27.121 66.734 +/-26.171 0.35 WM CSA C3-C4 63.261 +/- 32.576 70.232 +/- 25.912 0.36 WM CSA C4-C5 60.259 +/- 29.394 65.401 +/- 27.304 0.34 WM CSA C5-C6 57.386 +/- 30.116 61.443 +/- 28.987 0.39 WM CSA C6-C7 49.543 +/- 30.295 55.870 +/- 26.266 0.18
Subjects < 40 years C9+ C9- p-value
WM CSA C2 66.026 +/- 35.448 75.779 +/- 32.681 0.27 WM CSA C2-C3 65.384 +/- 30.304 69.889 +/- 30.400 0.70 WM CSA C3-C4 68.455 +/- 28.814 80.527 +/- 36.815 0.26 WM CSA C4-C5 68.825 +/- 29.568 77.151 +/- 31.276 0.28 WM CSA C5-C6 62.025 +/- 31.387 74.596 +/- 30.707 0.22 WM CSA C6-C7 57.662 +/- 29.963 64.868 +/- 31.677 0.25
Subjects with a family history of ALS C9+ C9- p-value
WM CSA C2 60.378 +/- 6.049 70.078 +/- 6.985 0.09 WM CSA C2-C3 59.638 +/- 5.874 69.458 +/- 6.782 0.21 WM CSA C3-C4 62.101 +/- 6.127 72.203 +/- 7.075 0.12 WM CSA C4-C5 60.513 +/- 6.198 67.281 +/- 7.156 0.17 WM CSA C5-C6 57.901 +/- 6.380 65. 141+/- 7.367 0.20 WM CSA C6-C7 51.129 +/- 6.664 59.095 +/- 7.407 0.13
Supplementary table 8. White matter (WM) cross-sectional area (CSA, mm2) at vertebral levels C2-C7 presented as mean and standard deviation in C9+ and C9- subjects at 18-month follow-up. Comparisons are FDR corrected and adjusted for age, gender and family membership). C9+ = c9orf72 positive subjects; C9- =
c9orf72 negative subjects.
Total population C9+ C9- p-value
WM CSA C2 60.305 +/- 26.375 68.298 +/- 25.533 0.34 WM CSA C2-C3 58.798 +/- 23.719 70.069 +/- 21.719 0.41 WM CSA C3-C4 63.527 +/- 26.224 72.049 +/- 24.780 0.47 WM CSA C4-C5 58.847 +/- 27.682 68.179 +/- 27.114 0.56 WM CSA C5-C6 59.597 +/- 27.352 65.270 +/- 27.352 0.48 WM CSA C6-C7 53.722 +/- 26.776 58.400 +/- 24.432 0.53
Subjects < 40 years C9+ C9- p-value
WM CSA C2 62.767 +/- 26.684 55.981 +/- 24.191 0.84 WM CSA C2-C3 58.624 +/- 26.379 56.254 +/- 23.627 0.98 WM CSA C3-C4 63.814 +/- 27.044 61.447 +/- 25.949 0.38 WM CSA C4-C5 57.470 +/- 29.390 57.751 +/- 26.247 0.25 WM CSA C5-C6 59.304 +/- 27.145 54.630 +/- 24.285 0.84 WM CSA C6-C7 52.086 +/- 26.052 43.630 +/- 22.762 0.48
Subjects > 40 years C9+ subjects C9- subjects p-value
WM CSA C2 58.132 +/- 26.722 84.416 +/- 31.158 0.053 WM CSA C2-C3 58.973 +/- 25.377 85.949+/- 21.739 0.018 WM CSA C3-C4 63.240 +/- 26.263 84.259 +/- 23.461 0.042 WM CSA C4-C5 61.926 +/- 26.890 79.589 +/- 26.316 0.049 WM CSA C5-C6 59.891 +/- 28.445 78.154 +/- 26.678 0.029 WM CSA C6-C7 55.256 +/- 28.201 71.903 +/- 21.210 0.027
Subjects with a family history of ALS C9+ C9- p-value
WM CSA C2 15.051 +/- 0.429 14.352 +/- 0.505 0.27 WM CSA C2-C3 14.319 +/- 0.330 14.543 +/- 0.389 0.86 WM CSA C3-C4 15.213 +/- 0.474 15.121 +/- 0.558 0.55 WM CSA C4-C5 14.871 +/- 0.458 14.279 +/- 0.540 0.30 WM CSA C5-C6 13.568 +/- 0.454 13.760 +/- 0.536 0.86 WM CSA C6-C7 11.774 +/- 0.510 11.571 +/- 0.580 0.68
Supplementary table 9. White matter (WM) cross-sectional area (CSA, mm2) at vertebral levels C2-C7 presented as mean and standard deviation in C9+ subjects at baseline and at 18-month follow-up. Comparisons are FDR corrected and adjusted for age, gender and family membership). C9+ = c9orf72 positive subjects; C9- = c9orf72 negative subjects.
Total population Baseline 18-months evaluation p-value
WM CSA C2 60.550 +/- 30.452 60.305 +/- 26.375 0.87 WM CSA C2-C3 56.239 +/- 27.121 58.798 +/- 23.719 0.55 WM CSA C3-C4 63.261 +/- 32.576 63.527 +/- 26.224 0.92 WM CSA C4-C5 60.259 +/- 29.394 58.847 +/- 27.682 0.98 WM CSA C5-C6 57.386 +/- 30.116 59.597 +/- 27.352 0.71 WM CSA C6-C7 49.543 +/- 30.295 53.722 +/- 26.776 0.57
Subjects < 40 years Baseline 18-months evaluation p-value
WM CSA C2 66.026 +/- 35.448 62.767 +/- 26.684 0.32 WM CSA C2-C3 65.384 +/- 30.304 58.624 +/- 26.379 0.28 WM CSA C3-C4 68.455 +/- 28.814 63.814 +/- 27.044 0.26 WM CSA C4-C5 68.825 +/- 29.568 57.470 +/- 29.390 0.13 WM CSA C5-C6 62.025 +/- 31.387 59.304 +/- 27.145 0.27 WM CSA C6-C7 57.662 +/- 29.963 52.086 +/- 26.052 0.36
Subjects > 40 years Baseline 18-months evaluation p-value
WM CSA C2 49.421 +/- 24.308 58.132 +/- 26.722 0.69 WM CSA C2-C3 46.603 +/- 20.538 58.973 +/- 25.377 0.65 WM CSA C3-C4 50.432 +/- 24.312 63.240 +/- 26.263 0.68 WM CSA C4-C5 48.058 +/- 22.376 61.926 +/- 26.890 0.42 WM CSA C5-C6 43.754+/- 21.658 59.891 +/- 28.445 0.53 WM CSA C6-C7 35.646 +/- 22.086 55.256 +/- 28.201 0.52
Subjects with a family history of ALS Baseline 18-months evaluation p-value
WM CSA C2 64.829 +/- 5.732 59.739 +/- 6.168 0.55 WM CSA C2-C3 63.525 +/- 6.041 58.785 +/- 5.614 0.58 WM CSA C3-C4 69.163 +/- 6.232 61.395 +/- 5.791 0.40 WM CSA C4-C5 66.649 +/- 6.130 59.148 +/- 5.696 0.40 WM CSA C5-C6 66.224 +/- 6.148 56.465 +/- 5.713 0.29 WM CSA C6-C7 58.506 +/- 6.760 49.819 +/- 6.580 0.21
Supplementary table 10. DTI parameters in the corticospinal tracts (CSTs) expressed as mean and standard deviation in the entire population and in age-defined subgroups (younger and older than 40 years of age) at baseline. Comparisons are FDR corrected and adjusted for age, gender and family membership. CSTs: cortico-spinal tracts.
C9+ = c9orf72 positive subjects; C9- = c9orf72 negative subjects.
Total population C9+ C9- p-value
FA lateral CSTs 0.396 +/- 0.1278 0.379 +/- 0.1203 0.57
AD lateral CSTs 0.0016 +/- 0.0006 0.0015 +/- 0.0004 0.43
MD lateral CSTs 0.0006 +/- 0.0313 0.0011 +/- 0.0003 0.29
RD lateral CSTs 0.0010 +/- 0.0004 0.0009 +/- 0.0003 0.57
Subjects < 40 years C9+ C9- p-value
FA lateral CSTs 0.389 +/- 0.1532 0.346 +/- 0.0894 0.81
AD lateral CSTs 0.0016 +/- 0.0007 0.0015 +/- 0.0005 0.80
MD lateral CSTs 0.0011 +/- 0.0004 0.0012 +/- 0.0003 0.73
RD lateral CSTs 0.0010 +/- 0.0004 0.0009 +/- 0.0004 0.82
Subjects > 40 years C9+ subjects C9- subjects p-value
FA lateral CSTs 0.406 +/- 0.1090 0.402 +/- 0.1361 0.12
AD lateral CSTs 0.0017 +/- 0.0005 0.0015 +/- 0.0005 0.24
MD lateral CSTs 0.0098 +/- 0.0408 0.0011 +/- 0.0003 0.26
RD lateral CSTs 0.0011 +/- 0.0004 0.0009 +/- 0.0004 0.38
Subjects with a family history of ALS C9+ C9- p-value
FA lateral CSTs 0.392 +/- 0.024 0.416 +/- 0.029 0.64
AD lateral CSTs 0.0016 +/- 0.0001 0.0016 +/- 0.0001 0.60
MD lateral CSTs 0.0087 +/- 0.0058 0.0012 +/- 0.006 0.36
Supplementary table 11. DTI parameters in the corticospinal tracts (CSTs) described as mean and standard deviation in C9+ subjects at baseline and at 18-month follow-up. Comparisons are FDR corrected and adjusted for age, gender and family membership.
C9+ = c9orf72 positive subjects; C9- = c9orf72 negative subjects.
Total population Baseline 18-months evaluation p-value
FA lateral CSTs 0.396 +/- 0.1278 0.360 +/- 0.1249 0.24
AD lateral CSTs 0.0016 +/- 0.0006 0.0015 +/- 0.0005 0.14
MD lateral CSTs 0.0006 +/- 0.0313 0.0012 +/- 0.0004 0.30
RD lateral CSTs 0.0010 +/- 0.0004 0.0110 +/- 0.0004 0.60
Subjects < 40 years Baseline 18-months evaluation p-value
FA lateral CSTs 0.389 +/- 0.1532 0.350 +/- 0.1462 0.45
AD lateral CSTs 0.0016 +/- 0.0007 0.0016 +/- 0.0006 0.78
MD lateral CSTs 0.0011 +/- 0.0004 0.0012 +/- 0.0005 0.29
RD lateral CSTs 0.0010 +/- 0.0004 0.0011 +/- 0.0005 0.28
Subjects > 40 years Baseline 18-months evaluation p-value
FA lateral CSTs 0.406 +/- 0.1090 0.368 +/- 0.1030 0.045
AD lateral CSTs 0.0017 +/- 0.0005 0.0015 +/- 0.0004 0.35
MD lateral CSTs 0.0098 +/- 0.0408 0.0011 +/- 0.0003 0.43
RD lateral CSTs 0.0011 +/- 0.0004 0.0009 +/- 0.0004 0.37
Subjects with a family history of ALS Baseline 18-months evaluation p-value
FA lateral CSTs 0.394 +/- 0.024 0.381 +/- 0.025 0.65
AD lateral CSTs 0.0017 +/- 0.0001 0.0015 +/- 0.00013 0.14
MD lateral CSTs 0.0098 +/- 0.0062 0.0011 +/- 0.0066 0.33