Cosmic-ray interactions in charged-couple devices
in the DMTPC 4-shooter detector
by
HyoJeong Choi
Submitted to the Department of Physics
in partial fulfillment of the requirements for the degree of
A
Bachelor of Science in Physics
at the
MASSACHUSETTS INSTITUTE OF TECHNOLOGY
June 2013
©
Massachusetts Institute of Technology 2013. All rights reserved.
Author ...
epartment of Physics
May 10, 2013
C ertified by ...
Peter Fisher
Professor
Thesis Supervisor
Accepted by ...
...
/. . ....Nergis Mavalvala
Senior Thesis Coordinator, Department of Physics
OF TECHNOLOGY
SEP 0
4
2013
Cosmic-ray interactions in charged-couple devices in the
DMTPC 4-shooter detector
by
HyoJeong Choi
Submitted to the Department of Physics on May 10, 2013, in partial fulfillment of the
requirements for the degree of Bachelor of Science in Physics
Abstract
The Dark Matter Time Projection Chamber (DMTPC) is a low pressure (CF4)
de-tector that measures the two-dimensional vector direction of nuclear recoils, and it aims to directly detect dark matter. This paper explores cosmic ray interactions with the four charge-coupled devices (CCDs) of the 4-shooter detector, the largest existing prototype detector in the DMTPC project, by looking at surface runs at MIT with detector voltages off. Through this, the depth of the depletion region of each CCD is found, which can be further used in understanding not only background rejection but also in understanding the relationship between measured CCD counts and energy deposited in the detector.
Thesis Supervisor: Peter Fisher Title: Professor
Acknowledgments
The author would like to thank Shawn W. Henderson for his tremendous assistance and mentorship, and Professor Peter Fisher for his constant help and support. This paper would have been impossible without them. The author also thanks Cosmin Deaconu, Jeremy Lopez and Will Koch for their help with various analysis programs. The author would like to thank them all, again, for being the wonderful people they are, and to the DMTPC collaboration.
Contents
1 Introduction 13
1.1 Why does Dark Matter matter? . . . . 13
1.2 Dark Matter Candidate: WIMP . . . . 14
1.3 Directional Detection . . . . 16
2 Cosmic Interactions in Charge-Coupled Devices (CCDs) 19 2.1 CCD Operation . . . . 19
2.2 Cosmic Ray Interactions in CCDs . . . . 22
2.2.1 Cosm ic Rays . . . . 22
2.2.2 Expected Energy Loss of Muons . . . . 22
3 Experimental Set Up 27 3.1 The 4-shooter Detector . . . . 27
4 Data Reduction and Analysis 31 4.1 ADU Conversion . . . . 31
4.2 Monte Carlo of Cosmic Muons . . . . 32
4.3 Track Reconstruction . . . . 33
4.4 A nalysis . . . . 35
5 Results 39
6 Conclusion 41
List of Figures
1-1 The galactic rotation curve from 1 = (5 - 85)' where 1 is the galactic
longitude. The dashed red line shows the Keplerian prediction[1]. . . 14
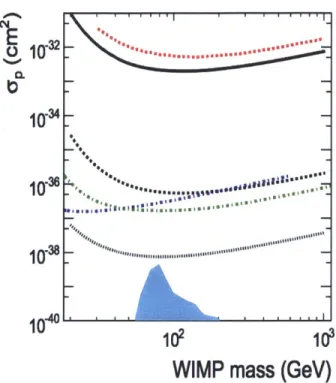
1-2 90% condance level limit on the spin-dependent WIMP-proton cross section vs. dark matter particle mass from DMTPC surface data (black solid line), NEWAGE[5] (red dashed line), KIMS[7] (green dash-dotted line) and PICASSO [6] (blue dash-dotted line). The cyan shaded region shows MSSM parameter space (theoretical boundary). The projected sensitivity for DMTPC at WIPP, with 1 year exposure(black dash-dotted line), and a 1m3 detector at WIPP with 50KeV energy threshold
(black dotted line) [8]. . . . . 16
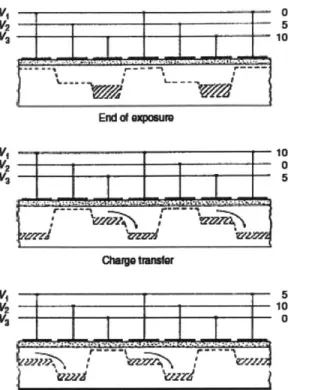
2-1 A schematic diagram of a three-phase voltage operation CCD. The
clock voltages are shown for the three phases of the readout process. The clock cycle is 0, 10 and 5V[9]. . . . . 20 2-2 A schematic diagram of a single front-side illuminated CCD pixel. The
square labeled "FRONT CONTACT" is a representation of part of the overall gate structure. The letters "p" and "n" refer to regions within the pixel consisting of silicon doped with phosphorus and boron respectively. [9]. . . . . 21
2-3 Stopping power((-dE/dx)) for p+ in copper as a function of 0-y. Solid curves indicate the total stopping power, and vertical bands indicate boundaries between different approximations [3]. . . . . 23
2-4 Right: Energy loss of Incident muons based on Bethe dE/dx, and the Landau most probable energy per unit thickness in silicon. Radiative losses are excluded[3]. Left: Energy loss of 3GeV muons in 10pm of silicon, generated by Monte Carlo based on Eq. 2.3-2.7. The Bethe equation(Eq. 2.1) gives 4.45 KeV for 10pm. . . . . 24
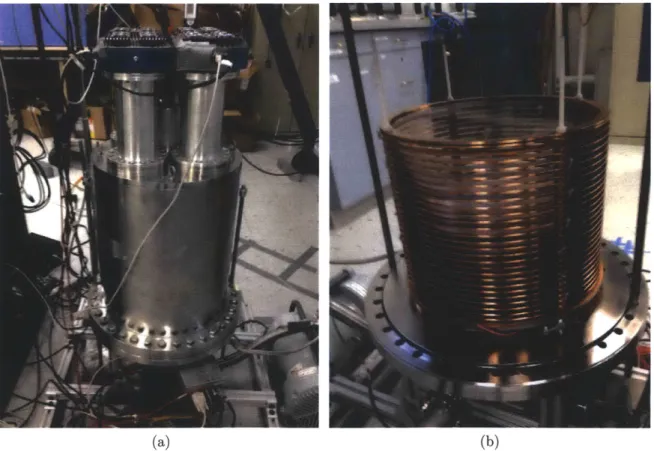
3-1 A schematic diagram of the 4-shooter detector . . . . 28 3-2 Left: The 4-shooter detector. From top to bottom, CCD-PMT-TPC.
Right: Detector field cage inside the TPC. Taken in the surface labo-ratory at M IT . . . . . 28 3-3 The amplification region of the 4-shooter detector. . . . . 29
4-1 (a) A comparison between the Ring Cluster Finding algorithm and the Seed Cluster Finding algorithm. Blue is ring and red is seed. Same analysis cuts were used (0 < E < 0.025MeV and nburnin< 5). (b) Landau fits to the energy distribution with analysis cuts(0 < E < 0.025MeV and nburnin< 5). The red is the fitted function. Both data is from camera 100534. . . . . 35
4-2 Energy spectrum of four cameras on top of each other. (a) Energy cut of 0< E <0.025 MeV and nburnin less than 5.) (b) Logarithmically scaled number of events with no energy cut and nburnin less than 5. . 36
4-3 X:Y plot of track positions with energy greater than 0 for camera 100534. (a) nburnin less than 5. (b) nburnin greater than 5. . . . . . 37
4-4 Source free run vs. 2 5 2Cf source run. Camera serial numbers: (a) 100534
(b)110121. Data was not taken for A80333 and A80334. The red shows
the subtracted number of events from the source run to the source free run. Given the shielding of the source and its proximity, the extra events are most likely gammas rays produced by the source. . . . . . 38 6-1 This event was just around the energy cut. So it is difficult to tell if it
List of Tables
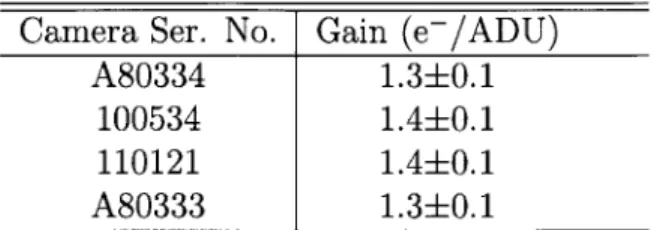
4.1 Electron gain per ADU for each camera from the data sheets of each cam era. . . . . 32
4.2 Image Mean and RMS of raw and bias frame subtracted images. . . . 34
4.3 Some of the parameters used for the ring cluster finder. 1 RMS equals the image RMS(Tab. 4.2). The parameters were optimized by the
testing them on Monte Carlo images. . . . . 34
4.4 Landau fit results . . . . 36 5.1 Results of data analysis. . . . . 40
5.2 Passing rate of events for Seed to Ring Cluster Finder, and ratio of events from source free run to 2 52Cf source run. All values are in %. . 40
5.3 Comparison to theoretical values. . . . . 40
Chapter 1
Introduction
1.1
Why does Dark Matter matter?
Dark matter is hypothetical matter that has been postulated by many scientists to be the largest mass component of our universe. The existence of dark matter was first postulated to account for the the discrepancy between the "luminous" mass of large astronomical objects and the mass inferred from its gravitational effects. In
1932 Jan Oort, a radio astronomer, found that in order to account for the virial
velocity of the stars in the Milky Way there had to be much more mass than what we were seeing. In 1933 Fritz Zwicky applied the virial theorem to the Coma cluster and found that there had to be 400 times more mass in the cluster, than what was visually observable[2]. The orbital velocity of the galaxies was just too fast. This led the scientists to speculate that there must be invisible gravitational mass that is not coupled to electromagnetic interactions. Zwicky referred to this "missing mass" as dark matter.
Many other galaxy clusters have also shown consistent results under Zwicky's method, and other interesting observations have been made that indicate the existence of dark matter. These observations include the gravitational lensing of background objects by galaxy clusters, and the temperature distribution of hot gas in galaxies and in clusters of galaxies. Cosmic microwave background studies imply that the small density fluctuations required for the apparent clustering of matter into small
300
250
0 1 2 3 4 5 6 7 8 9
Galactic Radius (kpc)
Figure 1-1: The galactic rotation curve from 1 = (5 - 85)' where 1 longitude. The dashed red line shows the Keplerian prediction[1].
is the galactic
scale structures could not have been produced by ordinary matter, but that it could have been produced by dark matter because dark matter is not coupled to photons.
Subsequent observation have led astronomers to believe that dark matter con-stituted about 23% of the matter-energy density of the universe with the ordinary Baryonic matter making up only 4% (the rest of the energy is supposedly "dark en-ergy" which is another interesting topic but it will not be dealt with in here). However while many indications were found of the existence of dark matter, it has never been observed gravitationally. Consequently, the physics community began the search for dark matter, and the race was officially on.
1.2
Dark Matter Candidate: WIMP
Although the nature of the dark matter remains mysterious, scientists have narrowed the search to a few candidates. Analyses of structure formation in the universe in-dicate that most of the dark matter should be "cold," meaning that it should have been non-relativistic in the early universe. Candidates must be stable on
cosmologi-Miky Way Galactic Rotation Curve Data -- - Expected Curve
|
+ + - ----. ...-.-.-.-.-.- -.- -.- -.-.-- --200 1150 100-5so ... :ff . fri -... ...cal time scales (or they would have decayed by now), they must interact very weakly with electromagnetic radiation, and they must have the right relic density. Candi-dates include primordial black holes, axions, sterile neutrinos, and weakly interacting massive particles(WIMPs)[3].
The most popular candidate particles by far are WIMPs, and for good reasons. WIMPs are hypothetical particles that are predicted by theories of supersymmetry. The two main theoretical characteristics are 1) WIMPs interact only through the weak nuclear force and gravity, and 2) WIMPs have a large mass compared to most standard model particles, which mean that they move slowly(non-relativistically), and are therefore called cold. This would fit the model of the early universe where WIMPs would have dropped out of thermal equilibrium ("freeze out") resulting in an abundance of relic dark matter[3]. Simulations of structure formation have also been done to show that models of WIMPs can be tuned so that they satisfy the prediction that dark matter makes up 23% of the total energy density of the universe[4].
Many experiments (including DMTPC) aim to directly detect WIMPs by observ-ing nuclei recoilobserv-ing after beobserv-ing struck by a wimp, and they rely on the fact that WIMPs should be gravitationally trapped inside galaxies and have an adequate den-sity profile to account for the observed galaxy rotational curves. The expected mean velocity of WIMPs inside our galaxy relative to its center is similar to that of stars, and for these velocities, they interact with ordinary matter through elastic scattering on nuclei. For hypothetical WIMP masses in the range 10GeV to 1OTeV, typical nuclear recoil energies are of order 1 to 100KeV.
Most direct detection experiments look for these low energy recoil signals in gaseous, liquid or solid detector volumes by looking for the scintillation and or charge created by the nuclear recoil. NEWAGE[5] utilizes a gaseous volume like DMTPC and PICASSO[6] uses liquid. KIMS[7] uses 12 crystals of CsI(Tl) with a total mass of 104.4kg in the Yang Yang laboratory in Korea. A comparison of these leading experiments with the DMTPC project is shown in Fig. 1-2. Gaseous detectors are su-perior in rejecting backgrounds, but they have a much lower density of targets in the detector volume. Liquid or solid based detectors expect a higher rate of interactions
S10.32
40
10102 10
WIMP
mass (GeV)
Figure 1-2: 90% condance level limit on the spin-dependent WIMP-proton cross sec-tion vs. dark matter particle mass from DMTPC surface data (black solid line),
NEWAGE[5] (red dashed line), KIMS[7] (green dash-dotted line) and PICASSO[6]
(blue dash-dotted line). The cyan shaded region shows MSSM parameter space (the-oretical boundary). The projected sensitivity for DMTPC at WIPP, with 1 year exposure(black dash-dotted line), and a 1m3 detector at WIPP with 50KeV energy threshold (black dotted line) [8].
and can be more easily scaled to large target masses.
1.3
Directional Detection
Simple models of our Galaxy's WIMP distribution predict that a WIMP wind wind of speed 220km/s should pass through the earth due to the sun's orbital motion around the galactic center. The earth's rotation axis is oriented approximately 48 degrees from the direction of this anticipated WIMP wind, so in 12 hours, the direction of the the WIMP wind relative to an observer on the surface of the earth, should change by approximately 90 degrees [4]. Observation of particles being knocked in this expected direction would constitute very convincing evidence that dark matter has interacted with a detector. Thus a precise three-dimensional track detector may be able to
demonstrate the time varying WIMP signal, and this would be a clear evidence of dark matter detection.
The DMTPC project is a gaseous detector filled with low pressure CF4 gas. The
fact that the gas is at low pressure has the advantage that recoiling nuclei can travel a few millimeters before depositing all of their energy. Currently, two-dimensional vector direction is being measured, but in the near future, the collaboration aims to achieve three-dimensional track reconstruction, using the measurement of the track angle of a nuclear recoil and with the track's energy distribution information, which can provide the direction that the recoiling nucleus traveled along that axis.
The first prototype DMTPC detector, the "10L," is currently running under-ground at the Waste Isolation Pilot Project (WIPP) near Carlsbad, New Mexico. The next generation detector is the 4-shooter detector which is currently being char-acterized on the surface at MIT. The current goal of the DMTPC project is to build a much larger scale detector which is the 1m 3detector.
Chapter 2
Cosmic Interactions in
Charge-Coupled Devices (CCDs)
An important attribute of scientific CCDs is high sensitivity meaning high quantum efficiency and low read noise. Because scientific CCDs are more focused on high performance than those for commercial use, scientific CCDs are not mass produced and also vary slightly even if they are the same model. For each CCD it is crucial to understand the relationship between the CCD and its output.
2.1
CCD Operation
A CCD is a photosensitive integrated circuit etched onto a silicon surface. It consists
of a two-dimensional array of picture elements more commonly known as pixels. The functioning of a CCD can be divided into two phases: exposure and readout. During exposure the CCD acquires the image and during readout the image is digitized and stored. When the silicon surface within a pixel is hit by photons, electrons are liberated due to the photoelectric effect (silicon has a band gap energy of 1.14eV[9]), creating electron-hole pairs. The number of freed electrons are linearly dependent on light intensity and exposure time and non-linearly dependent on wavelength. Each pixel has a sub-pixel sized electrodes called gates that allow voltages to be applied, forming tiny potential wells. When electrons are promoted to the conduction band
V,0 V2- 10 13-1 10 V, 10 2 -0 V,5
Figure 2-1: A schematic diagram of a three-phase voltage operation CCD. The clock voltages are shown for the three phases of the readout process. The clock cycle is 0,
10 and 5V[9].
of the silicon by photons this gate structure allows each pixel to collect the freed electrons and to hold them until readout occurs.
The collected electrons must then be transferred from one pixel to the next until they reach the output electronics. Each pixel is typically connected to three gates where all the third gates' voltages are controlled by the same clock. As shown in
Fig. 2-1, when an exposure ends, the electrons are manipulated so that they are forced into the deepest potential of
+1OV.
As the readout begins, or as the clock cycle begins, the charge stored in each pixel is electronically shifted. The cycling of the voltage potentials shifts the charge in a serial manner from one pixel in a column to the next throughout the array. While each charge transfer is not without loss, the efficiency of modern CCDs are approaches 99.9999%.The columns in the array are connected in parallel meaning that the shifting happens simultaneously in the entire array. The first row that gets shifted off the array is then moved to the output shift register. This register is in fact a hidden row
S102 (THERMALLY GROWN) ANTIREFLECTION COATING
p+ ACTIVE AREA
p-n JUNCTION EDGE FRONT CONTACT
DEPLETION REGION
n-TYPE SILICON MATERIAL n' BACK DIFFUSION
/
BACK METALLIZATION
Figure 2-2: A schematic diagram of a single front-side illuminated CCD pixel. The square labeled "FRONT CONTACT" is a representation of part of the overall gate structure. The letters "p" and "n" refer to regions within the pixel consisting of silicon doped with phosphorus and boron respectively. [9].
of pixels that are not exposed, and it functions as a transition between the active rows and the output device. After an entire row is shifted from the active region into the output register, each pixel in the output register is shifted out one at a time into to the output electronics before the output register takes another row. This is where the total amount of charge in electrons in each pixel is converted into an output digital number which is given in counts or analog-to-digital units (ADU). The gain of a CCD, or the number of collected electrons to produce 1ADU, is different for each particular CCD.
The main region of interest in this paper is the depletion region (Fig. 2-2). This is where the electrons are the produced photoelectrons are stored. It is the aim of this paper to find the depth of this region, and it will be referred to as the thickness
2.2
Cosmic Ray Interactions in CCDs
2.2.1
Cosmic Rays
Cosmic rays originating from interstellar space are high-energy particles that are generated in our galaxy through supernova explosions. The earth is continuously bombarded with these particles. They are comprised of high-energy protons and atomic nuclei. When they interact with the air nucleus of the Earth's atmosphere, they produce an "air shower" of secondary unstable particles, mainly pions(w±) and kaons(K*). These particles then decay by weak interaction into leptons (electrons, neutrinos and muons) and gamma rays[10].
Since the length of the earth's atmosphere is equivalent to that of ten nuclear interactions, strongly interacting particles are absorbed before they reach sea level, and only p~s, the "hard component," and e±s and -ys, "the soft component" are seen. Among the particles that reach sea level, 98% of cosmic rays are muons[11]. While the muons have a short lifetime of around 2.2 pas, because they move at a speed close to that of light, most of them to reach the earth's surface without decaying due to time dilation, a relativistic effect.
2.2.2 Expected Energy Loss of Muons
When a fast charged particle (v = Bc) collides with matter, it interacts with the mat-ter electromagnetically, losing energy to ionization and atomic or collective excitation (Fig. 2-3). For heavier particles than electrons, such as muons, scattering from free electrons is adequately described by the Rutherford differential cross section. Elec-trons in detectors, however, are not free, and so E must be finite and depend on atomic and bulk structure. The mean rate of energy loss for relativistically charged heavy particles is described by the Bethe equation[3],
KdE
K 2Z 1 [1 2mec2Y2 32Tmax2 _07)
- I -- _... Z C10 0 10 04 1 0-on Cu Bethe RC9 derson-iegler Radiative Minimum effects ionization reach 1% . ... -0.01 I 0.1 I 1 10 I 100 P 1000 104 1 I 10.1 1 10 100 1 10 1001 [MeV/c] [GeV/c] Muon momentum
Figure 2-3: Stopping power((-dE/dx)) for p+ in copper as curves indicate the total stopping power, and vertical bands tween different approximations [3].
1i 10 1001
[TeV/c]
a function of /5y. Solid indicate boundaries
be-Tmax is the maximum kinetic energy that can be imparted to a free electron in a
single collision. By the conservation of energy and momentum, Tmax for a particle of mass M is given by,
2mec2i32
2me ( ()2)]
Tmax = 2 1 + -Y + -) (2.2)
6(#y) is the density effect correction to ionization energy loss (see Appendix A.1 for constants). This equation is valid for velocities
#
>
az. The energy loss decreaseslike 1/32 in the low-energy domain and reaches a broad minimum of ionization near 3-y 4 (Fig. 2-3). Most relativistic particles, including muons, have mean energy loss rate close to this minimum and so they are called "minimum-ionizing particles (MIPs)". For silicon detectors, the minimum ionization energy loss (dE/dxjmin) is
3.86 MeV/cm.
Eq. 2.1 gives the average energy loss of charged particles to ionization and
exci-tation, but for thin absorbers stronger fluctuations occur around the average energy
-Nucleai losses 1 I 0.0011 106 1
I
I I -diative E c Radiative losses --- -Withouta
I I 105 11.0 10.0 100.0 Muon kinetic energy (GeV)
U) 0 E z3 1000.0 60 40 20 0-0 ,rr1il 01002 0.003 0.004 0.005 0.006 Energy (MeV)
Figure 2-4: Right: Energy loss of Incident muons based on Bethe dE/dx, and the Landau most probable energy per unit thickness in silicon. Radiative losses are excluded[3]. Left: Energy loss of 3GeV muons in 10pm of silicon, generated by Monte Carlo based on Eq. 2.3-2.7. The Bethe equation(Eq. 2.1) gives 4.45 KeV for
10pm.
loss(Fig. 2-4), and so other approximations have to be made. The main reason for this is that the mean is weighted by very rare events with large single-collision en-ergy deposits, and so even with samples of hundreds of events a dependable value for the mean energy loss cannot be obtained. The most probable energy loss, however is easily measured, but this is considerably below the mean given by the Bethe equation.
A better approximation can be made the energy loss distribution in thin absorbers by a highly-skewed Landau (or Landau-Vavilov) distribution(Fig. 2-4) [12].
sonable approximation of the Landau distribution is given by
A
rea-L(A) = I exp
72 7
1 (A + A)
2
where A characterizes the deviation from the most probable energy loss, and is given
by
(2.4)
AE is the actual loss and AEp is the most probable energy loss in a layer of thickness
x. is given by,
2
Z
= 27rNAr2mec2z2 Z e A 1 (2.5) 3.0 o 2.5 'E 2.0 1.5 1.0 0.5 L 0.1 SiliconBethe-Restricted energy loss for: ...-... Tcut120dE/dx6 ..m...
Landau/Vavilov/Bichsel Ap/x for: --- - ----...-- -- - -- - - -- -- -- -- --- - - - - 8 - -32Oprn- - - - - -.. .. .. .. .. .. .. .. .. .. .. .. .. .. ... .. .. .. 80 p m ... .... (2.3) AAE - AEp = K - p. A X
The general formula for the most probable energy loss is,
AEp [in (2mec 272132 ) + in + 0.2 --
32 - j(_Y) (2.6)
For very high energies the density correction becomes,
6(3-y) -4 ln(hwp/I) + ln(-y) - 1/2. (2.7)
AEp represents the most probable value of the Landau distribution and is the
-. The width(FWHM) of the distribution w is 4 . However for thin absorbers, like
the silicon detectors of the CCD, while AEp/x may be calculated adequately, the distributions are significantly wider than the Landau width[13][14].
Chapter 3
Experimental Set Up
3.1
The 4-shooter Detector
The detector that was used to collect data is called the "4-shooter" detector. The name is suggestive of its form. The 4-shooter can measure the direction of nuclear recoils by taking the images of the events with the 4 scientific CCDs that are mounted on a time projection chamber (TPC). The detector is a low pressure TPC with both optical and charge-sensing readout. This detector is an improved version of the pre-vious detector, the "10L," by the DMTPC collaboration.
Fig. 3-1 shows a schematic diagram of the 4-shooter detector. A time projection chamber(TPC) is a type of ionization detector and is essentially a large gas-filled chamber. The TPC consists of two back-to-back concentric cylindrical stages: the drift stage and the amplification stage. They have the same diameter and are stacked in a vertical fashion, the amplification stage being directly below the drift stage. At the top of the drift region there is a woven wire cathode mesh and at the bottom a grounded anode mesh which forms the top of the amplification region. These meshes are composed of 30.5pm 304 stainless steel in a square pattern such that there are
15.5 lines/cm2 in both directions. The meshes are stretched to high tension and fixed
to circular copper rings.
When charged particles are slowed and eventually stopped, they leave a trail of free electrons and ionized molecules. The freed electrons are then drifted by the
-v , x An Ve 4x4
'PC/79p
... S...J% ...Figure 3-1: A schematic diagram of the 4-shooter detector.
(a) (b)
Figure 3-2: Left: The 4-shooter detector. FRom top to bottom, CCD-PMT-TPC. Right: Detector field cage inside the TPC. Taken in the surface laboratory at MIT.
x
GND
Mesh
430 pim CU
6-10
fused silica spacers N tO sale
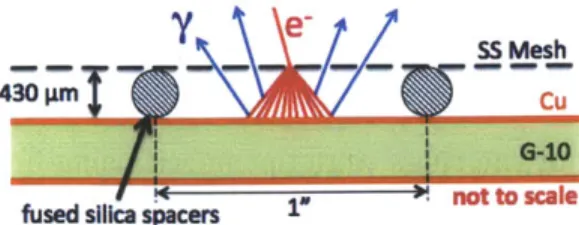
Figure 3-3: The amplification region of the 4-shooter detector.
electric field created by the drift cage toward the amplification region. When an electron reaches the amplification region, it is amplified by avalanche multiplication and creates a large amount of scintillation light that can be seen through the wire mesh that forms the top half of the amplification region. These photons are collected
by CCD cameras positioned at the top of the detector volume. The image given by
the CCDs is then a two dimensional image of the ionization signal of the track as it appeared on the amplification plane, and information from the charged particle such as its direction of motion within the detector and total energy can be reconstructed. The charge signal readout from the anode plane gives additional track information.
The volume of the TPC for the 4-shooter is 7r x30.73cm(radius)2 x26.7cm(height) which gives 19,810cm3 (the fiducial volume however is 17,890cm3 or roughly 18L). It is
filled with 45-75 Torr CF4 which is corresponds to about 6.6 gm of CF4 fiducial mass.
CF4 is chosen as the target material due to good scintillation characteristics[15] and
its sensitivity to spin-dependent WIMP interactions owing to the large spin factor and isotopic abundance of 19F [8] [16] [17]. The TPC is contained in a vacuum vessel.
The amplification region is made by the grounded mesh separated from a copper anode plate, creating a high electric field between them. The mesh and the copper anode plate are separated by non-conducting fused silica capillary tubes(Fig. 3-3). These tubes create a spacing of 435±10pm, and are placed at 2.54cm intervals. These spacers ensure that the spacing between the mesh and anode plate is uniform.
The drift region contains a field cage that creates uniform electric field in the direction perpendicular to the plane of the meshes. The field cage consists of a series of 26.3mm thick copper field shaping rings (Fig. 3-2), each with an inner diameter of 29.2cm(outer diameter of 30.73cm). The field cage is 26.7cm in length. The cathode
is electrically connected to the highest field shaping ring through a 1MQ resistor, and as are the subsequent rings. The rings are separated by acetal and copper washers. The size and separation of the rings were optimized using finite element calculations to minimize the variation in electric field and to minimize the amount of material introduced into the detector[4].
The photons produced in the TPC amplification stage is sensed by 4 CCDs and
3 PMTs that are mounted on top of the vacuum vessel. The CCDs are Apogee Alta U6 scientific CCDs which employs Kodak KAF-1001E CCD chip. The CCD chip
is an array of 1024x 1024 pixels of size 24pm x 24pm. In the data taken in this experiment, however, 4 x 4 pixel binning is used to optimize the signal to noise ratio and to decrease the readout time, resulting in a 256 x 256 pixel array. The active CCD chip size is 24.6mm x24.6mm[18]. Light is focused onto the CCD chips by Canon FD telephoto lenses, which have a focal length of 85 mm and an f-stop ratio of 1.2. The PMT readout is not of interest in this paper for it is focused on the interaction of cosmic rays with the CCDs.
In this experiment, all the voltages of the TPC were off so that the direct inter-action between cosmic rays and the CCDs could be studied. Each run contains 1000 events with 1 second exposures for each of the four cameras. Prior to each of run, 100 dark frames, images taken with the shutter closed, are averaged by the camera and used as bias frames. The bias frames correct for pixel variations so that the image is not biased by the intrinsic variations between pixels. 100 runs of data were acquired with each camera, which corresponds to 1.157 days of live time.
In addition, another data set of 100 runs was acquired with a 25 2Cf source ap-proximately 121.9 inches away. The source was 720mm off the ground and the CCDs were about 1.45m above the ground. The source was heavily collimated with plastic in the direction of the camera. The focus of this paper is on CCD interactions of the source free runs. And only two of the cameras that was used for the source run overlap with the 4-shooter, so the source runs will only be used as a comparison to understand the source free runs.
Chapter 4
Data Reduction and Analysis
In the usual setup for DMTPC projects, the analysis is designed maximize the re-jection of cosmic rays and other backgrounds so that dark matter signals will not be buried. The DMTPC collaboration, and other collaborations, take detectors deep underground for this purpose. For this reason, the usual analysis framework for the 4-shooter was not appropriate in the analysis of cosmic rays and a unique analysis had to be designed to look for the signals that are typically suppressed as much as possible.
4.1
ADU Conversion
CCD outputs are in counts, ADUs, and this output value cannot be compared to
physical values until it is converted into the proper units. This conversion therefore is crucial. The CCD gain, say X ADU, is converted to units of energy, eV by using the following equation:
dE _ X x (gain conversion) x (energy per e-h pair production) (4.1)
dx mn (thickness) x p
where I mi is the energy loss and p is the density of the materials which is psi =
2.329g/cm 3. The average for the production of e-h pair 3.6 eV and the gain conversion
Camera Ser. No. Gain (e-/ADU)
A80334 1.3±0.1
100534 1.4+0.1
110121 1.4±0.1
A80333 1.3+0.1
Table 4.1: Electron gain per ADU for each camera from the data sheets of each camera.
Thus the energies of Fig. 4-2 is converted from ADU to MeV by multiplying 3.6eV/(e-h pairs) xgain (e-/ADU) xlx10-6MeV/eV. From Fig. 4-2, it is possible to
see that one camera has a systematically lower mean than the three others. This could be due to two reasons: significantly lower thickness of chip or error in the gain conversion factor (which would be also be higher than the given value). Because one of the main goals of this paper is to find the thickness of the chip, the gain conversion factor will be presumed to be correct. In any case, the two factors are either proportional or inversely proportional so if the gain conversion is later found to be wrong, it could be easily accounted for.
4.2
Monte Carlo of Cosmic Muons
To identify the actual cosmic events from the pictures taken by the CCD from the background and readout noise, a Monte Carlo technique was used to generate fake images of cosmic ray events.
When a muon hits the CCD, a random position in the x and y coordinate was chosen from a uniform distribution. The overall angular distribution of muons at sea-level is oc cos20, which is characteristic of ~3GeV muons[3], and so random O's are generated according to the distribution:
4
P(O) = -cos 2 0 (4.2)
where . is a normalization constant. The thickness, or the z coordinate was a pa-a r rameter that was being varied. Based on this, a path was decided for the muon.
The length of this cosmic event is then calculated by computing the distance between the initial and final position in the CCD, and is converted to the number of pixels. For each event, energy loss is randomly chosen from the Landau-Vavilov distribu-tion(Sec. 2.2.2), and this energy equally distributed among the pixels.
The rest mass of muons is 105.65 MeV, and the rate for horizontal detectors is I ~1/cm 2min'[3]. This gives 3 = 0.99942 and ( = 0.178 x x KeV for silicon
with thickness x[19]. With these parameters, and with typical noise level of images
(7ADU), many fake images were generated. It was used to tune the ring cluster finder
parameters so that all cosmic-like events were being found by the algorithm, and to find the thickness of the chip.
4.3
Track Reconstruction
The first step in processing the "raw" CCD images is bias frame subtraction. Subtrac-tion starts with the average of the dark frames that were taken before each exposure (with the shutter closed) in every run of 1000 events. In the normal 4-shooter anal-ysis, before scanning the images to find tracks, the image is scanned for lone pixels that are systematically many times the image RMS ("hot pixels"), and those pixels are removed from the image, i.e. killed. Hot pixels are not actual tracks that occur due to collisions but noise intrinsic to the individual camera pixels. For the purpose of this analysis, however, because the systematic hot pixels are cosmic muon event candidates, the pixel killing function was disabled.This leads to huge numbers of sys-tematically hot pixels being identified as track candidates, but these pixels can be easily identified in the analysis process (Sec. 4.4).
Once this image cleaning is done, the images are then scanned for tracks. The usual track finding algorithm is called the "Seed Cluster Finder Algorithm," but because this algorithm was built in a way to reject as much background, there is a limit to getting cosmic events (Fig. 4-1). So a different algorithm called the "Ring Cluster Finder Algorithm" was used in identifying tracks. The algorithm first normalizes the image by subtracting the image mean and dividing by the image RMS (Tab. 4.2).
Then it applies a bilateral filter with given parameters, and on the filtered image, it looks for pixels with values higher than the high threshold value. If it finds one, it looks for neighboring pixels with values above the low threshold. It looks at the "ring" of pixels around the high count pixel. This protocluster will keep searching for passing neighboring pixels as long as the minimum size of the protocluster is larger than the minimum bin size and higher than the lower threshold. If there is a nearby pixel that passes the threshold it is merged to the protocluster, until it no longer finds anything else. This becomes a cluster.
Camera Ser. No. Image Mean (ADU) Image RMS (ADU)
A80334 994.269+0.002 13.064±0.002
100534 943.768+0.002 12.061+0.002
110121 982.926+0.001 11.106+0.001
A80333 963.948+0.001 8.484±0.001
Table 4.2: Image Mean and RMS of raw and bias frame subtracted images.
With the parameters in Tab. 4.3, the Ring Cluster Finder was able to find 100% of the Monte Carlo generated events, where as using the Seed Cluster Finder, it found about 0.9% with pixel killing and 2.3% with pixel killing.
Parameter Values Space Sigma 1 RMS RMS sigma 1 RMS High Threshold 10 RMS Low Threshold 10 RMS Ring Threshold 100 RMS
Minimum Size 1 bin
Minimum Distance 0
Table 4.3: Some of the parameters used for the ring cluster finder. 1 RMS equals the image RMS(Tab. 4.2). The parameters were optimized by the testing them on Monte
1000
1000--500 0
500-E E
z z
00 0.005 0.01 0.015 0.02 0.025 0 0.005 0.01 0.015 0.02 0.025
Energy (MeV) Energy (MeV)
(a) (b)
Figure 4-1: (a) A comparison between the Ring Cluster Finding algorithm and the Seed Cluster Finding algorithm. Blue is ring and red is seed. Same analysis cuts were used (0 < E < 0.025MeV and nburnin< 5). (b) Landau fits to the energy distribution with analysis cuts(0 < E < 0.025MeV and nburnin< 5). The red is the fitted function. Both data is from camera 100534.
4.4
Analysis
The main analysis challenge is differentiating the cosmic events from all the back-ground and noise events that were not cut during the image processing. The answer to this was to use cuts on the events.
First, based on energy cut is made above 0 and below 0.025 ADU. The distribution of energy (Fig. 4-2) shows that this is sufficient to keep all relevant events. The main issue of allowing lone pixels to be passed as tracks is the large number of hot pixels. So they generally occur in the same position. To exclude this from the data, the "nburnin" analysis cut was used. nburnin keeps track of the number of tracks which are nearby in both space and time. Events that have nburnin greater than 5 (meaning that the events occurred more than 5 times on the same pixels) were cut. The number was chosen by looking at the distribution of nburnin, and position of the tracks, x versus y. In Fig. 4-3, (a) shows that applying this cut results in a very even distribution of events in space, whereas (b) shows that the events occur in a visibly separated cluster.
To obtain the most probable energy, the histograms were fitted to a Landau distribution Eq. 2.2. The a of the fit represents (Tab. 4.4).
0.005 0.01 0.015 0.02 0.025 Energy (MeV) (a) 0.1 0.15 Energy (MeV) (b) 0.2 0.25
Figure 4-2: Energy spectrum of four cameras on top of each other. 0< E <0.025 MeV and nburnin less than 5.) (b) Logarithmically events with no energy cut and nburnin less than 5.
(a) Energy cut of scaled number of
Camera Ser. No. MPV (KeV) o- (KeV) Xr2ed
A80334 4.27±0.02 1.14+0.01 1.009
100534 4.41±0.02 1.20+0.01 1.006
110121 4.71±0.02 1.28±0.01 1.010
A80333 2.59±0.01 0.73±0.01 1.004 Table 4.4: Landau fit results.
1500 Cn E z 1000 500
Camera Serial No.
- A80334 - 100534 - 110121 - A80333 - -I U0 104 U) 4-1 C (D E z 10 1 0 0.05
200 400 600
(b) Figure 4-3: X:Y plot of track positions with energy greater than 0 for (a) nburnin less than 5. (b) nburnin greater than 5.
camera 100534.
Using the same analysis cuts, a comparison was made between the source free and the 252Cf source runs. The two runs had the same live time, and so no scaling
was applied. The source free run was subtracted from the source run to see the distribution of non-cosmic background events caused by the 252Cf source (Fig. 4-4).
1000 500 jqj ~. . W4.~ A RN 1000 500 0t 14' 'p idi 500 (a) 1000 y 800 Y
"0 0.005 0.01 0.015 Energy (MeV) (a) 15001 0.005 0.01 0.015 Energy (MeV) (b) 0.02 0.025 0.02 0.025
Figure 4-4: Source free run vs. 15 2Cf source run. Camera serial numbers: (a)100534
(b)110121. Data was not taken for A80333 and A80334. The red shows the subtracted
number of events from the source run to the source free run. Given the shielding of the source and its proximity, the extra events are most likely gammas rays produced
by the source. 1500 U, 4-E E z 1000 500 - 25 2Cf --- Source Free 2Cf- Source Free I :- -~ ~ -LJ E z 1000 500 Al 10O -
--Chapter 5
Results
Tab. 5.1 the final shows results. The most probable energy loss was found by taking the energy with the most counts, and the thickness was found by matching AEp of the data and the the Monte Carlo to match. The rates were calculated by taking the total number of events (with the analysis cuts) and dividing it by the area of the
CCD chip and the live time of the run. The thickness is ~10pm and the average rate
of 2.126 ± 0.006 min- cm-2.
The passing rate is the ratio of the total number of events with an energy cut for 0< E <0.025 MeV of the two cluster finding algorithms. For the ring cluster finder, the nburnin cut was also applied to account for hot pixels. The passing rate of the seed cluster finder of events was 2.7±0.4% on average(Tab. 5.2).
The errors for AEp are from binning the histogram and statistical. For the thick-ness, the errors from the scaling factors that were used to match the data to the Monte Carlo were added in quadrature. The error in the conversion factor of electron
gain per ADU (- 10%) dominated everything else. All errors in finding rates are
from statistics.
Using the measured thickness, Tab. 5.3 tabulates the ratio of the theoretical(wp) and actual widths(wd), and the mean energy loss by the Bethe equation, (dE/dx).
Camera Ser. No. AEp(KeV) thickness (pm) Rate (min-Icm-2)
A80334 4.27 ± 0.02 11.90 ± 0.01 1.9400 ± 0.0001
100534 4.41 ± 0.02 12.75 ± 0.01 2.3276 ± 0.0002
110121 4.71 ± 0.02 12.75 ± 0.01 2.0476 ± 0.0001
A80333 2.59 ± 0.01 7.86 ± 0.01 2.1943 ± 0.0001 Table 5.1: Results of data analysis.
Camera Ser. No. Passing Rate Source Free vs. 252Cf A80334 2.27 ± 0.004
100534 1.89 ± 0.004 57.69 ± 0.01
110121 3.21 ± 0.004 47.89 ± 0.01
A80333 2.10 ±
0.004-Table 5.2: Passing rate of events for Seed to Ring Cluster Finder, and ratio of events from source free run to 252Cf source run. All values are in %.
Camera Ser. No. wP/wd (dE/dx)
A80334 0.19 0.01 5.55 ± 0.06
100534 0.19 + 0.01 5.94 ± 0.07
110121 0.18 i 0.01 5.94 + 0.07
A80333 0.19 i 0.01 3.66 ± 0.06
Chapter 6
Conclusion
In a neutron background study done by a former DMTPC collaboration member, the thickness for the CCD (the depletion depth) was set to be 5pm for cameras A80333 and A803334[20]. It is however ambiguous how this number was found, and based on the thickness found from this paper, the neutron background level that was calculated in [20] must be - x2 for A80334 and x 1.5 for A80333. Because the CCD counts
do not have a physical meaning without calibration, the thickness found in this paper will be important for energy calibration and background estimation for the 4-shooter detecter.
In comparing the Monte Carlo events to surface run data, it has also been verified that for thin absorbers, Landau distribution fails to accurately describe the nature of the energy loss, as mentioned earlier in Sec. 2.2.2. The width was found to be significantly wider than the Monte Carlo, but that is to be expected for thin absorbers. Fig. 15 of [14] predicts that for heavy particles the ratio would be smaller that 0.5 for a thickness of 10pum, and the ratio of widths that was found for all for CCD chips were around 0.02. It has also been shown that the Bethe equation gives a much higher mean energy loss that the most probable energy loss as the theory predicts.
The four CCDs that are employed for the 4-shooter detector showed large varia-tions in their cosmic ray responses. Camera A80333 in particular showed significant deviation from other cameras. In this paper, it is assumed that the other conversion factors such as the e- 1gain conversion is correct. It is possible however that these
numbers are wrong, and in fact, it is being tested to see if the values given by the data sheet are correct. Regardless, because the gain conversion and the thickness are both directly proportional to energy, it can be easily accounted for as long as the product of the electron gain conversion and the thickness is consistent.
From the comparison with the 152Cf run, it was confirmed that the most probable energy stayed relatively constant, affirming the fact that what was found from the source free run are mostly muon events. It has also confirmed that the Landau dis-tribution that is seen in the energy loss disdis-tribution is not created by the parameters and analysis cuts, because the source run showed a small peak before the Landau dis-tribution. The two data sets were analyzed by the same analysis framework and thus it confirms that the steep rise in the surface run is not created by cuts but that it is a physically meaningful spectral feature. For Camera 11021, however, the subtracted histogram was somewhat less random and less uniform then expected.
Comparing the analyzed events from the Ring Cluster Finder and the Seed Cluster Finder analyses showed that the Seed Cluster Finder has excellent cosmic ray rejection capabilities. For camera 11021 however the Seed Cluster Finder identified almost twice as many events as the other cameras. The rates were fairly constant for all the four cameras so this might imply that the camera might have some intrinsic background that is not being properly identified by the Seed Cluster Finder, which might also explain the non-uniform distribution in the source free run subtraction from the source run.
The event rate that was measured which is approximately twice the value of the known muon rate (I ~ lmin' cm-2). This however is not so discouraging given the fact that any radioactivity, even just showers from materials above the detector, will influence the outcome does not mean that the events are not muons. It has been discussed in many papers that cosmic ray rates' vary in different CCDst[11]. And the energy distributions looked promisingly muon-like meaning that it would be safe to say that while there are many other random events, the parameters that were
extrapolated from it (such as the thickness or the most probable energy loss) should be accurate within error. Regardless it is important to know the specific background
20.
E
8.5 9 9.5 10 10.5 11
mm
Figure 6-1: This event was just around the energy cut. So it is difficult to tell if it was a muon but it's cute!
rate of each CCDs in future 4-shooter analysis.
Appendix A
Notation
Symbol Definition Units or Value
a Fine Structure constant 1/137.03599911(46)
mec2 Electron mass xc2 0.510998918(44)MeV
re Classical electron radius 2.817940325(28) fm
NA Avogadro's number 6.0221415(10) x 1023 mol-1
z Charge of the incident particle Elementary charge
Z Atomic number of absorber for Si = 14
A Atomic mass of absorber for Si = 28.0855(3) amu
K 47rNAr 2mec2 0.307075 MeV cm 2 mol-1
I Mean excitation energy for Si = 172.042 eV
hwp Plasma Energy /p(Z/A) x 28.816 eV
(V47rNereamec 2/a) for Si = 31.054 eV
Ne Electron density (units of r;-3)
Bibliography
[1] HyoJeong Choi. 21-cm radio astrophysics. Junior lab report, Massachusetts
Institute of Technology, December 2011.
[2] F. Zwicky. The Astrophysical Journal, 86:217, 1938.
[3] J. Beringer and et al. (Particle Data Group). 2011 the review of particle physics.
Phys. Rev., D 86, 2012.
[4] T. Caldwell. First limit from a surface run of a 101 dark matter time projection chamber. Senior Thesis, May 2009.
[5] K. Miuchi and et al. (NEWAGE). Phys. Lett., B686, 2010. [6] S. Archambault and et al. (PICASSO). Phys. Lett., B682, 2009.
[7] H. S. Lee and et al. (KIMS). Phys. Rev. Lett., 2007.
[8] S. Ahlen, J.B.R. Battat, T. Caldwell, C. Deaconu, D. Dujmic, et al. First dark
matter search results from a surface run of the 10-1 dmtpc directional dark matter detector. Phys. Lett., B695:124-129, 2011.
[9] S. B. Howell. Handbook of CCD Astronomy. Cambridge University Press, 2nd
edition, 2006.
[10] A.C. Melissinos and J. Napolitano. Experiments in Modern Physics, chapter 5,
pages 179-184. Academic Press, 2nd edition, 2003.
[11] A.R. Smith et al. Radiation events in astronomical ccd images. Lawrence
Berke-ley National Laboratory, 2002.
[12] C. Grupen, B. Shwartz, and H. Spieler. Particle Detectors. Cambridge Mono-graphs on Particle Physics, Nuclear Physics and Cosmology. Cambridge Univer-sity Press, 2008.
[13] H. Bichsel. A method to improve tracking and particle identification in tpcs and
silicon detectors. Nucl. Instrum. Methods, A562, 2006.
[15] A. Kaboth et al. A measurement of photon production in electron avalanches in
cf4. Nucl. Instrum. Meth., A592:63-72, 2008.
[16] G. Jungman, M. Kamionkowski, and K. Griest. Supersymmetric dark matter.
Phys. Rept, 267, 1996.
[17] J.D. Lewin and P.F. Smith. Review of mathematics, numerical factors, and
cre-ations for dark matter experiments based on elastic nuclear recoil. Astroparticle
Physics, 6:87-112, 1996.
[18] Kodak. Device Performance Specification, 2010.
[19] S. M. Seltzer and M. J. Berger. Energy-loss straggling of protons and mesons:
Tabulation of the vavilov distribution. In Studies in Penetration of Charged
Particles in Matter, number 39 in Its Nuclear Science series; report, pages
187-204. National Academy of Sciences - National Research Council, 1964.
[20] T. C. Sahin. Interactions of neutrons with silicon ccd chips. Senior Thesis, May 2010.

![Figure 2-3: Stopping power((-dE/dx)) for p+ in copper as curves indicate the total stopping power, and vertical bands tween different approximations [3].](https://thumb-eu.123doks.com/thumbv2/123doknet/14501214.527857/23.918.160.753.103.470/figure-stopping-copper-indicate-stopping-vertical-different-approximations.webp)