HAL Id: hal-01354999
https://hal.inria.fr/hal-01354999
Submitted on 22 Aug 2016
HAL is a multi-disciplinary open access
archive for the deposit and dissemination of
sci-entific research documents, whether they are
pub-lished or not. The documents may come from
L’archive ouverte pluridisciplinaire HAL, est
destinée au dépôt et à la diffusion de documents
scientifiques de niveau recherche, publiés ou non,
émanant des établissements d’enseignement et de
ScapeGoat: Spotting abnormal resource usage in
component-based reconfigurable software systems
Inti Gonzalez-Herrera, Johann Bourcier, Erwan Daubert, Walter Rudametkin,
Olivier Barais, François Fouquet, Jean-Marc Jézéquel, Benoit Baudry
To cite this version:
Inti Gonzalez-Herrera, Johann Bourcier, Erwan Daubert, Walter Rudametkin, Olivier Barais, et al..
ScapeGoat: Spotting abnormal resource usage in component-based reconfigurable software systems.
Journal of Systems and Software, Elsevier, 2016, �10.1016/j.jss.2016.02.027�. �hal-01354999�
ScapeGoat: Spotting Abnormal Resource Usage in
Component-based Reconfigurable Software Systems
I. Gonzalez-Herreraa,∗∗, J. Bourciera,∗, E. Dauberta,d, W. Rudametkinb, O. Baraisa,∗, F.
Fouquetc, J.M. J´ez´equela, B. Baudrye
aUniversity of Rennes 1 - IRISA, Campus de Beaulieu, 35042 Rennes, France bUniversity of Lille 1, Cite Scientifique, 59655 Villeneuve d’Ascq Cedex, France cUniversity of Luxembourg - Security and Trust Lab, 1457 Luxembourg, Luxembourg
dCTO Energiency, 2 rue de la Chˆataigneraie, 35510 Cesson-S´evign´e, France eINRIA, Campus de Beaulieu, 35042 Rennes, France
Abstract
Modern component frameworks support continuous deployment and simultaneous execution of multiple software components on top of the same virtual machine. How-ever, isolation between the various components is limited. A faulty version of any one of the software components can compromise the whole system by consuming all available resources. In this paper, we address the problem of efficiently identifying faulty software components running simultaneously in a single virtual machine. Cur-rent solutions that perform permanent and extensive monitoring to detect anomalies induce high overhead on the system, and can, by themselves, make the system unsta-ble. In this paper we present an optimistic adaptive monitoring system to determine the faulty components of an application. Suspected components are finely analyzed by the monitoring system, but only when required. Unsuspected components are left untouched and execute normally. Thus, we perform localized just-in-time monitoring that decreases the accumulated overhead of the monitoring system. We evaluate our approach on two case studies against a state-of-the-art monitoring system and show that our technique correctly detects faulty components, while reducing overhead by an average of 93%.
Keywords: Resource, Monitoring, Adaptation, Component, [email protected]
∗Corresponding author ∗∗Principal corresponding author
Email addresses: [email protected](I. Gonzalez-Herrera), [email protected](J. Bourcier), [email protected] (E. Daubert), [email protected](W. Rudametkin), [email protected] (O. Barais), [email protected](F. Fouquet), [email protected] (J.M. J´ez´equel), [email protected](B. Baudry)
1. Introduction
Many modern computing systems require precise performance monitoring to de-liver satisfying end user services. For example, in pervasive, ubiquitous, building man-agement or Internet of Things systems, devices that are part of the system have limited resources. The precise exploitation of these limited resources is important to take the most out of these systems, therefore requiring a fine and dynamic resource monitor-ing. Many other examples exist in the area of cloud computing where the notion of elasticity and on demand deployment is key to enable dynamic adaptation to user de-mand [1]. Indeed, the elasticity management mechanism in charge of allocating and shrinking computing resources to match user demand, requires a precise performance monitoring of the application to determine when to increase or decrease the amount of allocated resources. Another example can be found in the cloud computing do-main at the Software as a Service level when services with various Quality of Services (QoS) are offered to end users. The differentiation of QoS between two users of the same services requires a precise performance monitoring of the system to cope with the specified QoS.
To implement such behavior, these modern computing systems must exhibit new properties, such as the dynamic adaptation of the system to its environment [2] and the adaptation of the system to available resources [3]. Modern Component based frameworks have been designed to ease the developers’ tasks of assembling, deploying and adapting a distributed system. By providing introspection, reconfiguration, ad-vanced technical services, among other facilities [4], component frameworks are good candidate to assist software developers in developing resource-aware system. These frameworks provide extensible middleware and assist developers in managing techni-cal issues such as security, transaction management, or distributed computing. They also support the simultaneous execution of multiple software components on the same virtual machine [5–7].
Current monitoring mechanisms [8–10] continuously interact with the monitored application to obtain precise data regarding the amount of memory and I/O used, the time spent executing a particular component or the number of call to a particular inter-face. Despite their precision, these monitoring mechanisms induce high overhead on the application; this prevents their use in production environments. The overhead of a monitoring mechanism can be up to a factor of 4.3 as shown in the results presented in [11]. As we discuss in Section 4 the performance overhead grows with the size of the monitored software. Thus, overhead greatly limits the scalability and usage of monitoring mechanisms.
In this paper, we address excessive overhead in monitoring approaches by introduc-ing an optimistic adaptive monitorintroduc-ing system that provides lightweight global monitor-ing under normal conditions, and precise and localized monitormonitor-ing when problems are detected. Although our approach reduces the accumulated amount of overhead in the system, it also introduces a delay in finding the source of a faulty behaviour. Our objec-tive is to provide an acceptable trade-off between the overhead and the delay to identify the source of faulty behaviour in the system. Our approach targets component-models written in object-oriented languages, and it is only able to monitor the resource con-sumption of components running atop a single execution environment. In this paper,
we discuss how we can leverage our proposal to provide the foundations for resource consumption monitoring in distributed environments.
Our optimistic adaptive monitoring system is based on the following principles: • Contract-based resource usage. The monitoring system follows component-based
software engineering principles. Each component is augmented with a contract that specifies their expected or previously calculated resource usage [12]. The contracts specify how a component uses memory, I/O and CPU resources.
• Localized just-in-time injection and activation of monitoring probes. Under nor-mal conditions our monitoring system performs a lightweight global monitoring of the system. When a problem is detected at the global level, our system activates local monitoring probes on specific components in order to identify the source of the faulty behaviour. The probes are specifically synthesized according to the com-ponent’s contract to limit their overhead. Thus, only the required data are monitored (e.g., only memory usage is monitored when a memory problem is detected), and only when needed.
• Heuristic-guided search of the problem source. We use a heuristic to reduce the delay of locating a faulty component while maintaining an acceptable overhead. This heuristic is used to inject and activate monitoring probes on the suspected com-ponents. However, overhead and latency in finding the faulty component are greatly impacted by the precision of the heuristic. A heuristic that quickly locates faulty components will reduce both delays and the accumulated overhead of the monitor-ing system. We propose usmonitor-ing [email protected] techniques in order to build an efficient heuristic.
The evaluation of our optimistic adaptive monitoring system shows that, in com-parison to other state-of-the-art approaches, the overhead of the monitoring system is reduced by up to 93%. Regarding latency, our heuristic reduces the delay to identify the faulty component when changing from global, lightweight monitoring to localized, just-in-time monitoring. We also present a use case to highlight the possibility of using Scapegoat on a real application, that shows how to automatically find buggy compo-nents on a scalable modular web application.
An early version of the Scapegoat monitoring framework is presented in [13]. This paper introduces four new majors contributions:
• The paper includes a new mechanism to monitor memory consumption that can be turned on/off. In [13], memory monitoring cannot be turned off. As a consequence, the probes used to account for memory consumption are always activated. This impacts the performance of the system even when in global mon-itoring mode. In this paper, we propose a mechanism to avoid any kind of over-head when in global monitoring mode thank to the new monitoring mechanism. Using this new mechanism we reduce even more the performance overhead in terms of CPU consumption and we avoid overhead in terms of memory con-sumption.
• New experiments to assess the performance impact of the proposed mecha-nism to compute memory consumption monitoring.
• In addition to the experiments proposed in [13], a new use case is used to eval-uate the monitoring framework.
• We show how to generalize the approach to deal with properties other than CPU, memory and related resources.
The remainder of this paper is organized as follows. Section 2 presents the back-ground on [email protected] and motivates our work through a case study which is used to validate the approach. Section 3 provides an overview of the Scapegoat frame-work. It highlights how the component contracts are specified, how monitoring probes are injected and activated on-demand, how the ScapeGoat framework enables the def-inition of heuristics to detect faulty components without activating all the probes, and how we benefit from [email protected] to build efficient heuristics. Section 4 vali-dates the approach through a comparison of detection precision and detection speed with other approaches. Section 5 presents a use case based on an online web
applica-tion1which leverages software diversity for safety and security purposes. In Section 6
highlights interesting points and ways to apply our approach to other contexts. Finally, Section 7 discusses related work and Section 8 discusses the approach and presents our conclusion and future work.
2. Background and motivating example 2.1. Motivating example
In this section we present a motivating example for the use of an optimistic adap-tive monitoring process in the context of a real-time crisis management system in a fire department. During a dangerous event, many firefighters are present and need to col-laborate to achieve common goals. Firefighters have to coordinate among themselves and commanding officers need to have an accurate real-time view of the system.
The Daum project2 provides a software application that supports firefighters in
these situations. The application runs on devices with limited computational resources because it must be mobile and taken on-site. It provides numerous services for firefight-ers depending on their role in the crisis. In this paper we focus on the two following roles:
• A collaborative functionality that allows commanding officers to follow and edit tactical operations. The firefighters’ equipment include communicating sensors that report on their current conditions.
• A drone control system which automatically launches a drone equipped with sensors and a camera to provide a different point-of-view on the current situation.
As is common in many software applications, the firefighter application may have a potentially infinite number of configurations. These configurations depend on the number of firefighters involved, the type of crisis, the available devices and equipment,
1http://cloud.diversify-project.eu/
among other parameters. Thus, it is generally not possible to test all configurations to guarantee that the software will always function properly. Consequently, instead of testing all configurations, there is a need to monitor the software’s execution to detect faulty behaviours and prevent system crashes. However, fine-grained monitoring of the application can have excessive overhead that makes it unsuitable with the application and the devices used in our example. Thus, there is a need for an accurate monitoring system that can find faulty components while reducing overhead.
The Daum project has implemented the firefighter application using a Component
Based Software Architecture. The application makes extensive use of the Kevoree3
component model and runtime presented below. 2.2. Kevoree
Kevoree is an open-source dynamic component platform, which relies on [email protected] [14] to properly support the dynamic adaptation of distributed systems. Our use case application and the implementation of the Scapegoat framework make ex-tensive use of the Kevoree framework. The following subsections detail the background on component-based software architecture, introduce the [email protected] paradigm and give an overview of the Kevoree platform.
2.2.1. Component-based software architecture
Software architecture aims at reducing complexity through abstraction and sepa-ration of concerns by providing a common understanding of component, connector and configuration [15–17]. One of the benefits is that it facilitates the management of dynamic architectures, which becomes a primary concern in the Future Internet and Cyber-Physical Systems [18, 19]. Such systems demand techniques that let software react to changes by self-organizing its structure and self-adapting its behavior [19–21]. Many works [22] have shown the benefits of using component-based approaches in such open-world environments [23–25].
To satisfy the needs for adaptation, several component models provide solutions to dynamically reconfigure a software architecture through, for example, the deployment of new modules, the instantiation of new services, and the creation of new bindings between components [26–29]. In practice, component-based (and/or service-based) platforms like Fractal [7], OpenCOM [30], OSGi [5] or SCA [31] provide platform mechanisms to support dynamic architectures.
2.2.2. [email protected]
Built on top of dynamic component frameworks, [email protected] denote model-driven approaches that aim at taming the complexity of dynamic adaptation. It basically pushes the idea of reflection [32] one step further by considering the reflection-layer as a real model: “something simpler, safer or cheaper than reality to avoid the complexity, danger and irreversibility of reality”. In practice, component-based and service-based platforms offer reflection APIs that allow instrospecting the application (e.g., which components and bindings are currently in place in the system) and dynamic adaptation
(e.g., changing the current components and bindings). While some of these platforms offer rollback mechanisms to recover after an erroneous adaptation [33], the purpose of [email protected] is to prevent the system from actually enacting an erroneous adapta-tion. In other words, the “model at runtime” is a reflection model that can be decoupled from the application (for reasoning, validation, and simulation purposes) and then auto-matically resynchronized. This model can not only manage the application’s structural information (i.e., the architecture), but can also be populated with behavioural infor-mation from the specification or the runtime monitoring data.
2.2.3. The Kevoree framework
Kevoree provides multiple concepts that are used to create a distributed application that allows dynamic adaptation. The Node concept is used to model the infrastructure topology and the Group concept is used to model the semantics of inter-node commu-nication, particularly when synchronizing the reflection model among nodes. Kevoree includes a Channel concept to allow for different communication semantics between remote Components deployed on heterogeneous nodes. All Kevoree concepts (Com-ponent, Channel, Node, Group) obey the object type design pattern [34] in order to separate deployment artifacts from running artifacts.
Kevoree supports multiple execution platforms (e.g., Java, Android, MiniCloud, FreeBSD, Arduino). For each target platform it provides a specific runtime container. Moreover, Kevoree comes with a set of tools for building dynamic applications (a graphical editor to visualize and edit configurations, a textual language to express re-configurations, several checkers to valid configurations).
As a result, Kevoree provides a promising environment by facilitating the imple-mentation of dynamically reconfigurable applications in the context of an open-world environment. Because our goal is to design and implement an adaptive monitoring sys-tem, the introspection and the dynamic reconfiguration facilities offered by Kevoree suit the needs of the ScapeGoat framework.
3. The ScapeGoat framework
Our optimistic adaptive monitoring system extends the Kevoree platform with the following principles: i) component contracts that define per-component resource us-age, ii) localized and just-in-time injection and activation of monitoring probes, iii) heuristic-guided faulty component detection. The following subsections present an overview of these three principles in action.
3.1. Specifying component contracts
In both the Kevoree and ScapeGoat approaches, we follow the contract-aware component classification [12], which applies B. Meyer’s Design-by-Contract princi-ples [35] to components. In fact, ScapeGoat provides Kevoree with Quality of Service contract extensions that specify the worst-case values of the resources the component uses. The resources specified are memory, CPU, I/O and the time to service a request. The exact semantic of a contract in ScapeGoat is: the component will consume at most
For example, for a simple Web server component we can define a contract on the number of instructions per second it may execute [10] and the maximum amount of memory it can consume. The number of messages can be specified per component or per component-port. In this way, the information can be used to tune the usage of the
component roughly or detailedly. An example is shown in Listing 1.4 This contract
extension follows the component interface principle [36], and allows us to detect if the problem comes from the component implementation or from a component interaction. That is, we can distinguish between a component that is using excessive resources because it is faulty, or because other components are calling it excessively.
add node0.WsServer650 : WsServer
// Specify that this component can use 2580323 CPU // instructions per second
set WsServer650.cpu wall time = 2580323 intr / sec
// Specify that this component can consume a maximum of 15000 // bytes of memory
set WsServer650.memory max size = 15000 bytes
// Specify that the contract is guaranteed under the assumption that // we do not receive more than 10k messages on the component and // 10k messages on the port named service
// ( this component has only one port )
set WsServer650. throughput all ports = 10000 msg/sec set WsServer650.throughput ports . service = 10000 msg/sec
Listing 1: Component contract specification example
In addition, there is a global contract for each node of the distributed application. This contract is used for the monitoring framework to drive the adaptation of the sys-tem. It simply states when the application container is running out of resource. When this condition is detected, Scapegoat starts to actively compute the resource consump-tion of different components. Figure 2 depicts a simple contract where an applicaconsump-tion container (node0) is used. In this case, Scapegoat activates only if the CPU consump-tion is over 80% or the memory consumpconsump-tion is over 70%.
// there is a device in the system
add node0 : JavaNode
// the system is running out of resources if the CPU consumption is over 80%
set node0. cpu threshold = 80%
// the system is running out of resources if the memory consumption is over 70% of the maximum heap size
set node0.memory threshold = 70 %
Listing 2: Global contract specification example
4Contract examples for the architecture presented in section 2.1 can be found at http://goo.gl/
3.2. An adaptive monitoring framework within the container
Scapegoat provides a monitoring framework that adapts its overhead to current ex-ecution conditions and leverages the architectural information provided by Kevoree to guide the search for faulty components. The monitoring mechanism is mainly injected within the component container.
Each Kevoree node/container is in charge of managing the component’s execution and adaptation. Following the [email protected] approach, each node can be sent a new architecture model that corresponds to a system evolution. In this case, the node compares its current configuration with the configuration required by the new architec-tural model and computes the list of individual adaptations it must perform. Among these adaptations, the node is in charge of downloading all the component packages and their dependencies, and loading them into memory. During this process, Scapegoat provides the existing container with (i) checks to verify that the system has enough re-sources to manage the new component, (ii) instrumentation for the component’s classes in order to add bytecode for the monitoring probes, and iii) communication with a na-tive agent that provide information about heap utilization. Scapegoat uses the com-ponents’ contracts to check if the new configuration will not exceed the amount of resources available on the device. It also instruments the components’ bytecode to monitor object creation (to compute memory usage), to compute each statement (for calculating CPU usage), and to monitor calls to classes that wrap I/O access such as the network or file-system. In addition, Scapegoat provides a mechanism to explore the Java heap and to account for memory consumption with an alternative mechanism. We provide several instrumentation levels that vary in the information they obtain and in the degree they impact the application’s performance:
• Global monitoring does not instrument any components, it simply uses information provided directly by the JVM.
• Memory instrumentation or memory accounting, which monitors the components’ memory usage.
• Instruction instrumentation or instruction accounting, which monitors the number of instructions executed by the components.
• Memory and instruction instrumentation, which monitors both memory usage and the number of instructions executed.
Probes are synthesized according to the components’ contracts. For example, a component whose contract does not specify I/O usage will not be instrumented for I/O resource monitoring. All probes can be dynamically activated or deactivated. Note that due to a technical limitation, one of the two probes implemented to check memory consumption must be always activated. This memory consumption probes, based on bytecode instrumentation must, remain activated to guarantee that all memory usage is properly accounted for, from the component’s creation to the component’s destruction. Indeed, deactivating this memory probes would cause object allocations to remain un-accounted for. However, probes for CPU, I/O usage and the second probe for memory can be activated on-demand to check for component contract compliance.
We propose two different mechanisms to deal with memory consumption. The first mechanism is based on bytecode instrumentation and accounts for each object created.
As mentioned previously, this mechanism cannot be disabled. The second mecha-nism is a just-in-time exploration of the JVM heap, performed on demand. These two mechanisms differ in i) when the computation to account for consumption is done, ii) how intensive it is, and iii) in the way the objects are accounted for. Computations in the first mechanism are spread throughout the execution of the application, short and lightweight operations are executed every time a new object instance is created or destroyed. Objects are always accounted to the component that creates them. Com-putations in the second mechanism occur only on demand but are intensive because they involve traversing the graph of living objects in the heap. The accounting policy follows the paradigm of assigning objects to the component that is holding them and, if an object is reachable from more than one component, it is accounted to either one randomly, as suggested in [37]. In this paper, we call this second mechanism Heap Exploration.
We minimize the overhead of the monitoring system by activating selected probes only when a problem is detected at the global level. We estimate the most likely faulty components and then activate the relevant monitoring probes. Following this technique, we only activate fine-grain monitoring on components suspected of misbehavior. Af-ter monitoring the subset of suspected components, if any of them are found to be the source of the problem, the monitoring system terminates. However, if the subset of components is determined to be healthy, the system starts monitoring the next most likely faulty subset. This occurs until the faulty component is found. If no compo-nents are found to be faulty, we fallback to global monitoring. If the problem still exists the entire process is restarted. This can occur in cases where, for example, the faulty behavior is transient or inconsistent. The monitoring mechanism implemented in ScapeGoat is summarized in listing 3.
1 monitor(C: Set<Component>, heuristic : Set<Component>→Set<Component>)
2 init memory probes (c | c ∈ C ∧ c.memory contract 6= ∅)
3 while container is running
4 wait violation in global monitoring
5 checked = ∅
6 faulty = ∅
7 whilechecked 6= C ∧ f aulty = ∅
8 subsetToCheck = heuristic ( C \ checked )
9 instrument for adding probes ( subsetToCheck )
10 faulty = fine −grain monitoring( subsetToCheck )
11 instrument for removing probes ( subsetToCheck )
12 checked = checked ∪ subsetToCheck
13 if faulty 6= ∅
14 adapt the system ( faulty , C)
15
16 fine −grain monitoring( C : Set<Component> )
17 wait few milliseconds // to obtain good information
18 faulty = {c | c ∈ C ∧ c.consumption > c.contract}
19 return faulty
Listing 3: The main monitoring loop implemented in ScapeGoat
As a result, at any given moment, applications must be in one of the following monitoring modes:
modifi-cations.
• Global monitoring. Only global resource usage is being monitored, such as the CPU usage and memory usage at the Java Virtual Machine (JVM) level.
• Full monitoring. All components are being monitored for all types of resource usage. This is equivalent to current state-of-the-art approaches.
• Localized monitoring. Only a subset of the components are monitored.
• Adaptive monitoring. The monitoring system changes from Global monitoring to Full or Localized monitoring if a faulty behaviour is detected.
For the rest of this paper we use the term all components for the adaptive monitor-ing policy that indicates that the system changes from global monitormonitor-ing mode to full
monitoringmode if and when a faulty behaviour is detected.
3.2.1. ScapeGoat’s architecture
The Scapegoat framework is built using the Kevoree component framework. Scape-goat extends Kevoree by providing a new Node Type and three new Component Types: • Monitored Node. Handles the admission of new components by storing information about resource availability. Before admission, it checks the security policies and registers components with a contract in the monitoring framework. Moreover, it intercepts and wraps class loading mechanisms to record a component type’s loaded classes. Such information is used later to (de)activate the probes.
• Monitoring Component. This component type is in charge of checking component contracts. Basically, it implements a complex variant of the algorithm in listing 3. It communicates with other components to identify suspected components.
• Ranking Component. This is an abstract Component Type; therefore it is user customizable. It is in charge of implementing the heuristic that ranks the components from the most likely to be faulty to the least likely.
• Adaptation component. This component type is in charge of dealing with the adap-tation of the application when a contract violation is detected. It is also a customiz-able component. The adaptation strategy whenever a faulty component is discovered is out os scope of this paper. Nevertheless, several strategies may be implemented in Scapegoat, such as removing faulty components or slowing down communication between components when the failure is due to a violation in the way one component is using another.
3.2.2. Extensibility of the ScapeGoat Framework
The scapegoat framework has been built with the idea of being as generic as possi-ble, thus supporting various extensions and specializations. In this section we discuss the extension points provided by the ScapeGoat framework.
Heuristics used to rank suspected faulty components can be highly specialized and, as we show in section 4, have a remarkable impact on the behavior of ScapeGoat. A new heuristic is created by defining a component that implements an interface to pro-vide a ranking of the suspected components. To do so, a context is sent with each
ranking request on this component. This context is composed of three elements, i) a model that describes the components and links of the deployed application, ii) a history that contains all the models that have been deployed on the platform, and iii) a history of failures composed of metadata regarding what components have failed as well as why and when it happened. In this paper, we present three heuristics. The first heuris-tic is proposed in section 3.3 and shows how we can leverage the [email protected] paradigm to guide the framework in finding the component that is behaving abnor-mally. Due to their simplicity, the other two heuristics are presented in section 4 where we use them to evaluate the behavior of ScapeGoat.
The mechanism for creating new heuristics is based on the strategy design pattern. Figures 1 and 2 illustrates this extension point.
Figure 1: Heuristic extension point in Scapegoat. This illustrates the class diagram.
Figure 2: A sequence diagram showing how the extension point to define heuristics in Scapegoat is used.
A second extensible aspect of the framework is the admission control system. The framework provides an API to hook user-defined actions when new components are submitted for deployment. Basic data describing the execution platform in terms of resource availability, information about the already deployed components and the new component’s contract are sent to the user-defined admission control system. On each request, the admission control system has to accept or refuse the new component. In this paper, we are using an approach which check the theoretical availability of re-sources whenever a component is deployed, and accept the new component if the con-tract can fit in the remaining available resources. ScapeGoat is meant to support other policies as, for instance, overcommitment.
A last element that can be specialized to user needs is the contracts semantic. In section 3.1 we describe how we interpret the contract in this work. However, it is pos-sible to define other contract semantics, for instance, accepting values that are closed to the limit defined in the contract, or using fuzzy values instead of sharp values. It is worth noting that modifying the semantic of the contract would likely involved redefin-ing the domain-specific language to describe contract and also modifyredefin-ing the admission control system.
3.2.3. Implementation strategy
Scapegoat aims at minimizing monitoring overhead when the framework is moni-toring the global behavior of the JVM. To achieve this, ScapeGoat uses as few probes as possible when executing in global monitoring mode. Only when it is necessary, Scape-Goat activates the required probes. This features are implemented in the framework in three modules that are in charge of different concerns: a module to activate/deacti-vate the probes, a module to collect the resource usage, and a module to compute what components should be carefully monitored. In this section we focus on the modules for activating/deactivating probes and for collecting information of resource usage be-cause they required considerable engineering effort. Notice, however, that this module is executed on demand when the framework already decides the monitoring mode to use and what components to monitor.
Module to activate/deactivate probes. In ScapeGoat we use bytecode instrumentation
to perform localized monitoring. However, instead of doing as previous approaches that manipulate the bytecode that defines components just when the component’s code is executed for the first time, we modify the bytecode many times during components’ life. Every time the monitoring mode is changed we either activate or deactivate the probes by simply inserting them in the bytecode or by removing them. Implementing this mechanism at per-component basis requires knowing all the classes that have been loaded for a component. This information is kept using a dictionary in which we treat a component’s id as a key and a set of class names as a value. The dictionary is filled using the traditional classloader mechanism of Java. In short, when a class is loaded on behalf of a component, we detect the class name and the thread that is loading the class. Using the thread’s id we are able to identify the component because we use special naming conventions for each thread executing the initial code of a component. When probes are activated/deactivated on a component, iterating over the set of class names allows the re-instrumentation of each involved class.
The probes perform two actions: collecting data about the local usage of resources (e.g., objects recently allocated, instructions executed in the current basic block, bytes sent through the network), and notifying to the resource consumption monitor about the collected data. Some data we collect is computed statically when the bytecode is loaded. This includes the size of each basic block and the size of each object allocated when the size of each instance of the class is already known. Other data, such as bytes sent through the network or the size of allocated arrays, can only by collected dynamically when the code is running. To notify about the collected data we use simple method calls to a proxy class in charge of forwarding the data to the monitoring module. Probes to detect CPU consumption are inserted at the end of each basic block. These
probes collect the size in number of instructions of its container basic block. Probes for IO throughput and network bandwidth are added in a few selected method defined in classes of the Java Development Kit (JDK). These probes take the needed information from local variables (e.g., number of bytes) and call the proxy class.
Our implementation, which is built using the ASM library5for bytecode
manipu-lation and a Java agent to get access to and transform the classes, is based on previous approaches to deal with resource accounting and profiling in Java [10, 38, 39]. As in previous approaches, we compute the length of each basic block to count the number of executed instructions and we try to keep a cache of known methods with a single basic block. Moreover, we compute the size of each object once it is allocated and we use weak references instead of finalizers to deal with deallocation.
Module to collect information regarding resource usage. In Scapegoat, there are two
mechanisms to collect information about how components consume resources. The first mechanism is able to capture the usage of CPU, IO throughput, network bandwidth and memory. Every time a probe that was inserted in the code of a com-ponent is executed, the proxy class forwards the local resource usage to the module in charge of collecting the resource usage. Along with the local resource usage, probes also notify the id of the components consuming resource. Such data is then used to aggregate the global consumption of each component. It is worth noting that, when this first mechanism is used to collect memory consumption, on object is always ac-counted as consumed for the component responsible for its initial allocation. In short, no matter whether the initial component C that allocates the object no longer held a reference to an object O, as long as O remains in memory, C is accounted for its con-sumption. Moreover, as was already mentioned, using this mechanism is not possible to deactivate the probes related to memory consumption.
On the contrary, the second mechanism is only useful to collect information about memory consumption. The advantages of this method are: we can leverage the pro-posed optimistic monitoring because it executes only on demand, and it has no impact on the number of objects allocated in memory because no weak references are used. However, in this method an object O is consumed not for the component that allocates it but for those components that held references to it. As a consequence, in certain occasions the framework states that an object is being consumed for many components at the same time. We built this solution on top of the JVM Tool Interface (JVMTI) by implementing the algorithm proposed in [37, 40], with the main difference being that our solution works without modifying the garbage collector. In summary, this al-gorithm simply try to find those objects that are reachable from the references of each component. It does so by traversing the graph of live object using as the component instance and its threads as roots of the traversal. Since our approach does not require a modification to the garbage collector, it is portable and works with different garbage collector implementations.
3.3. Leveraging [email protected] to build an efficient monitoring framework As presented in section 3.2, our approach offers a dynamic way to activate and de-activate fine-grain localized monitoring. We use a heuristic to determine which compo-nents are more likely to be faulty. Suspected compocompo-nents are the first to be monitored. Our framework can support different heuristics, which can be application or domain-specific. In this paper we propose a heuristic that leverages the use of the [email protected] approach to infer the faulty components. The heuristic is based on the assumption that the cause of newly detected misbehavior in an application is likely to come from the most recent changes in the application. This can be better understood as follows:
• recently added or updated components are more likely to be the source of a faulty behaviour;
• components that directly interact with recently added or updated components are also suspected.
We argue that when a problem is detected it is probable that recent changes have led to this problem, or else, it would have likely occurred earlier. If recently changed com-ponents are monitored and determined to be healthy, it is probable that the problem comes from direct interactions with those components. Indeed, changes to interac-tions can reveal dormant issues with the components. The algorithm used for ranking the components is presented in more detail in listing 4. In practice, we leverage the architectural-based history of evolutions of the application, which is provided by the [email protected] approach.
Listing 4 shows two routines, but only routine ranker is public. It can be called by the monitoring system when it is necessary to figure out in what order components must be carefully monitored. After initializing an empty list which will hold the rank, the algorithm starts to iterate in line 4 over the history of models that have been installed in the system. As mentioned, this history contains a sorted set of models that describe what components have been installed in the system. Within each iteration, the algo-rithm first computes in line 5 the set of components that were installed at such a point in time. Afterwards, these components are added to the result. The next step, executed at lines 8 and 9, is finding those components that are directly connected to components that were added to the application at this point in time. Finally, these neighbors are added to the rank after being sorted. Routine sort simply sorts a set of components using as criteria the time at which components where installed in the system.
3.4. What kind of failures is Scapegoat able to detect?
It is worth discussing in what contexts developers can leverage the proposed moni-toring framework. Scapegoat is a framework implemented at the application level; this has important implications from a security point of view that depend on particularities of the target technology. For instance, using a Java implementation of Scapegoat in a completely open-world environment poses the same challenges as using OSGi in to create an open platform where untrusted stakeholders can deploy OSGi bundles. This is, due to the lack of isolation in the JVM, a malicious stakeholder can corrupt other OSGi bundles or, in the case of Scapegoat, it can corrupt the framework.
1 ranker () : list <Component>
2 // used to avoid adding duplicated elements to the list
3 visited = ∅
4 // this list will contain the result of calling the routine
5 ranking = {}
6 foreach model M ∈ History
7 // adding components that were added in this model
8 N = {c | c was added in M}
9 ranking . add N\ visited
10 visited = visited ∪ N
11 // finding neighbors
12 Neighbors =S
c∈Nc.neighbors
13 SortedNeighbors = sort (Neighbors \ visited , History )
14 // adding neighbors
15 ranking . add SortedNeighbors
16 visited = visited ∪ Neighbors
17 // return the built ranking
18 return ranking
19
20 // this routine recursively sort a set of components using the following criteria :
21 // components are sorted by the timestamp that indicates when they were installed
22 private sort (S : Set<Component>, H : History) : list <Component>
23 r = {}
24 if S 6= ∅
25 choose b | b ∈ S ∧ b is newer with respect to H than any other element in S
26 r . add b, sort (S\{b}, H)
27 return r
Listing 4: The ranking algorithm (uses the model history for ranking).
Scapegoat is nevertheless useful in many contexts. For instance, it can detect com-ponents with development errors, and comcom-ponents in which the implementation do not follow the specification. In addition, the framework is capable of detecting small differences in the resource consumption of components with similar functional behav-ior. Hence, it is useful to choose what component to deploy in order to improve the QoS. Finally, Scapegoat can also provide hints of malicious attacks such as denial-of-services attacks because it is able to pinpoint the real source of the excessive resource consumption when several components are interacting. This does not mean that you can fully trust Scapegoat as a tool to avoid malicious attacks. In other words, Scape-goat is susceptible to false negatives (unreported attacks) but we can expect that it will trigger few false positives (reporting nonexistent attacks).
4. ScapeGoat Performance Evaluation
In this section we present a first series of experiments and discuss the usability of our approach. We focus on the following research questions to assess the quality and the efficiency of ScapeGoat:
• What is the impact of the various levels of instrumentation on the applica-tion? Our approach assumes high overhead for full monitoring and low overhead for a lightweight global monitoring system. The experiments presented in sec-tion 4.2 show the overhead for each instrumentasec-tion level.
• What is the performance cost of using instrumentation-based and heap-exploration-based memory monitoring? Since both mechanisms have by de-sign different features, the experiments in section 4.2 show the overhead each mechanism produces.
• Does our adaptive monitoring approach have better performance than state-of-the-art monitoring solutions? The experiment presented in section 4.3 high-lights the performances benefits of our approach considering a real-world sce-nario.
• What is the impact of using a heuristic in our adaptive monitoring ap-proach? The experiment presented in section 4.4 highlights the impact of the application and component sizes, and the need of a good heuristic to quickly identify faulty components.
The efficiency of our monitoring solution is evaluated on two dimensions: the over-head on the system and the delay to detect failures. We show there is a trade-off be-tween the two dimensions and that ScapeGoat provides a valuable solution that in-creases the delay to detect a faulty component but reduces accumulated overhead. This evaluation has been conducted on a Cyber Physical System case study. It corresponds to a concrete application that leverage the Kevoree framework for dyamic adaptation purpose.
We have built several use cases based on a template application from our motivat-ing example in section 2.1. We reused an open-source crisis-management application for firefighters that has been built with Kevoree components. We use two functional-ities of the crisis-management application. The first one is for managing firefighters. The equipment given to each firefighter contains a set of sensors that provides data for the firefighter’s current location, his heartbeat, his body temperature, his accelera-tion movements, the environmental temperature, and the concentraaccelera-tion of toxic gases. These data are collected and displayed in the crisis-management application, which provides a global-view of the situation. The second functionality uses drones to cap-ture real-time video from an advantageous point-of-view.
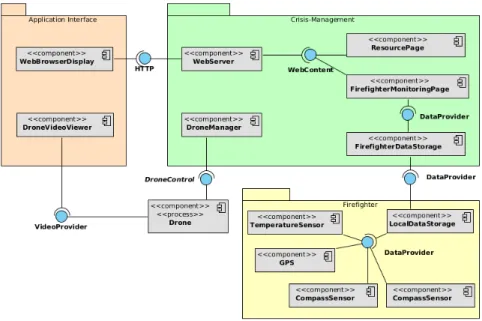
Figure 3 shows the set of components that are involved in our use-case,
includ-ing components for firefighters, drones and the crisis-management application6. The
components in the crisis-management application are used in our experiments, but the physical devices (drones and sensors) are simulated through the use of mock compo-nents. The application presents two components: the first one is a web browser that shows information about each firefighter in the terrain, and the second one allows to watch the video being recorded by any drone in the field. A Redis database is used to store the data that is consumed for the application’s GUI.
Every use case we present extends the crisis-management base application by any one of the following possibilities: adding new or redundant components, adding ex-ternal Java applications with wrapper components (e.g., Weka, DaCapo), or modifying existing components (e.g., to introduce a fault into them). Using this template in the
Figure 3: The component configuration for our crisis-management use-case.
experiments allow us to measure the behavior of our proposal in a more realistic envi-ronment where many components with different features co-exist.
4.1. Measurement Methodology
To obtain comparable and reproducible results, we used the same hardware across all experiments: a laptop with a 2.90GHz Intel(R) i7-3520M processor, running Fedora 19 with a 64 bit kernel and 8GiB of system memory. We used the HotSpot Java Virtual Machine version 1.7.0 67, and Kevoree framework version 5.0.1. Each measurement presented in the experiment is the average of ten different runs under the same condi-tions.
The evaluation of our approach is tightly coupled with the quality of the resource consumption contracts attached to each component. We built the contracts following classic profiling techniques. The contracts were built by performing several runs of our use cases, without inserting any faulty components into the execution. Firstly, we executed the use cases in an environment with global monitoring activated to get information for the global contract. Secondly, per-component contracts were created by running the use cases in an environment with full monitoring.
4.2. Overhead of the instrumentation solution
Our first experiment compares the various instrumentation levels to show the over-head of each one. In this section, Memory instrumentation refers to the technique for accounting memory which leverage bytecode instrumentation, while Heap Exploration refers to the memory accouting technique which leverage on-demand heap exploration. In this experiment, we compare the following instrumentation levels: No monitoring,
Global monitoring, Memory instrumentation, Instructions instrumentation, Memory
and instructions instrumentation(i.e., Full monitoring). We also evaluate the impact
on performance of the two fine-grain memory monitoring approaches we proposed: instrumentation-based and heap-dump-based.
In this set of experiments we used the DaCapo 2006 benchmark suite [41]. We
developed a Kevoree component to execute this benchmark7. The container was
con-figured to use full monitoring and the parameters in the contract are upper bounds of
the real consumption8.
antlr fop
hsqldb jython chart luinde x xalan lusearch 0 20 40 T ime (seconds) No monitoring Global monitoring Memory instrumentation Instructions instrumentation Memory & Instructions instrumentation
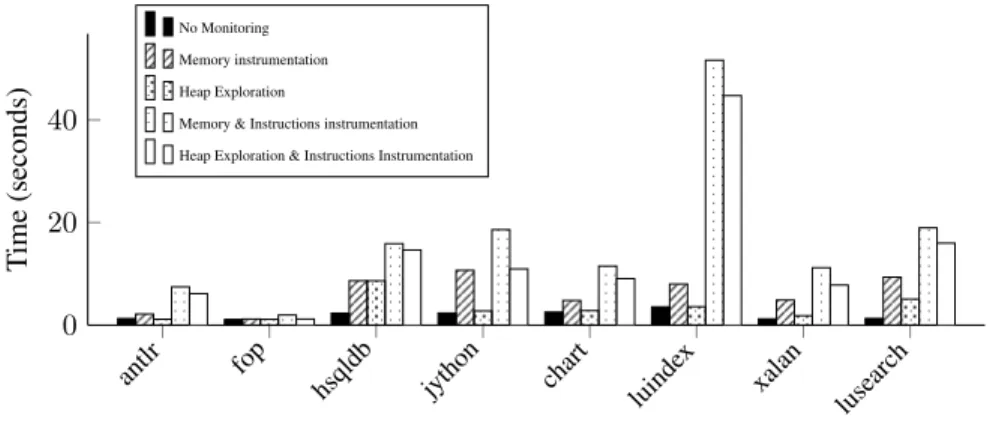
Figure 4: Execution time for tests using the DaCapo Benchmark
Figure 4 shows the execution time of several DaCapo tests under different sce-narios when only instrumentation is used to provide fine-grain monitoring. First, we wish to highlight that Global monitoring introduces no overhead compared with the
No monitoringmode. Second, the overhead due to memory accounting is lower than
the overhead due to instruction accounting. This is very important because, as we described in section 3.2, memory probes cannot be deactivated dynamically.
To perform the comparison, we evaluate the overhead produced for each monitoring mode. We calculated the overhead as:
overhead = W ithInstrumentation GlobalM onitoring
The average overhead due to instruction accounting is 5.62, while the value for memory accounting depends on the monitoring mechanism. If bytecode instrumenta-tion is used, the average overhead is 3.29 which is close to the values reported in [11]. In the case of instruction accounting, these values are not as good as the values reported in [11]; because they obtain a better value between 3.2 and 4.3 for instructions account-ing. The performance difference comes from a specific optimization that we chose not to apply. The optimization provides fast access to the execution context by adding a new parameter to each method. Nevertheless, this solution needs to keep a version
7http://goo.gl/V5T6De
of the method without the new parameter because native calls cannot be instrumented like that. We decided to avoid such an optimization because duplication of methods increases the size of the applications, and with it, the memory used by the heap. In short, our solution can reach similar values if we include the mentioned optimization, but at the cost of using more memory. On the other hand, the values we report are far lower than the values reported in [11] for hprof. Hence, we consider that our solution is comparable to state of the art approaches in the literature.
In figure 5 we compare the execution time of the same benchmarks but using dif-ferent memory monitoring approaches. This comparison is important because, as ex-plained in section 3.2, the two approaches have different CPU footprint. These are controlled experiments where, in order to stress the technique, we demand the execu-tion of a heap exploraexecu-tion step every two seconds, which is not the expected usage pattern. On the contrary, the memory instrumentation technique is executed with the expected usage pattern. In comparison to using memory instrumentation where the av-erage execution time is 3.29, the avav-erage overhead in execution time decreases to 1.79 if the Heap Exploration monitoring mechanism is used. This value is better than the value reported in [11]. These results suggest that this technique has less impact on the behavior of applications being monitored.
antlr fop
hsqldb jython chart luinde x xalan lusearch 0 20 40 T ime (seconds) No Monitoring Memory instrumentation Heap Exploration
Memory & Instructions instrumentation Heap Exploration & Instructions Instrumentation
Figure 5: Comparison of execution time for tests using two different memory monitoring techniques
The results of our experiment shown in figures 4 and 5 demonstrate the extensive impact of the Full monitoring mode, which uses either Memory instrumentation or CPU instrumentation, has on the application. Thus, our Adaptive monitoring mode, which uses Global monitoring and switches to Full monitoring or localized monitor-ing, has the potential to reduce this accumulated overhead due to the fact that Global
monitoringhas no appreciable overhead.
In addition, we plan to study alternatives to improve instruction accounting. For example, we plan to study the use of machine learning for monitoring [42]. Based on a machine learning approach, it is possible to train the monitoring system to do the instruction instrumentation. Then, instead of doing normal instruction instrumentation, we might only do, for example, method-calls instrumentation and with the learning data, the monitoring system should be able to infer the CPU usage of each call, whilst
lowering the overhead.
4.3. Overhead of Adaptive Monitoring vs Full Monitoring
The previous experiment highlights the potential of using Adaptive monitoring. However, switching from Global monitoring to either Full or Localized monitoring introduces an additional overhead due to having to instrument components and activate monitoring probes. Our second experiment compares the overhead introduced by the adaptive monitoring with the overhead of Full monitoring as used in state-of-the-art monitoring approaches.
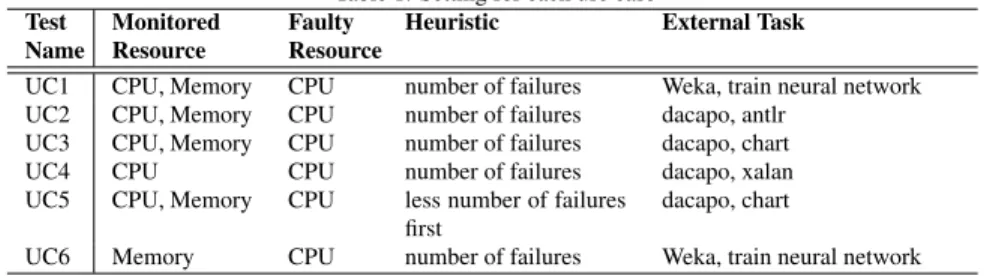
Table 1 shows the tests we built for the experiment. We developed the tests by extending the template application. Faults were introduced by modifying an existing component to break compliance with its resource consumption contract. We reproduce each execution repetitively; thus, the faulty behaviour is triggered many times during the execution of the application. The application is not restarted.
Table 1: Setting for each use case Test Name Monitored Resource Faulty Resource
Heuristic External Task
UC1 CPU, Memory CPU number of failures Weka, train neural network UC2 CPU, Memory CPU number of failures dacapo, antlr
UC3 CPU, Memory CPU number of failures dacapo, chart UC4 CPU CPU number of failures dacapo, xalan UC5 CPU, Memory CPU less number of failures
first
dacapo, chart
UC6 Memory CPU number of failures Weka, train neural network
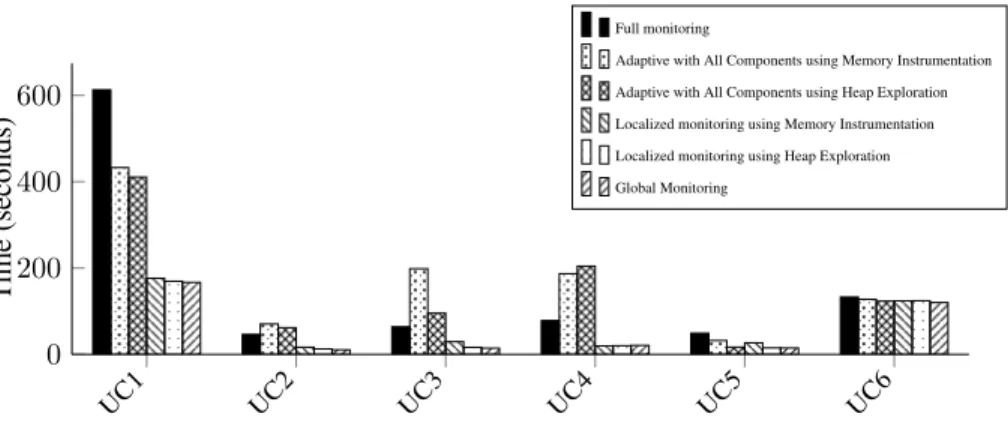
Figure 6 shows the execution time of running the use cases with different scenarios. Each scenario uses a specific monitoring policy (Full monitoring, Adaptive monitoring with All Components, Adaptive monitoring with Localized monitoring, Global moni-toring). All these scenarios were executed with the heap explorer memory monitoring policy. This figure shows that the overhead differences between Full monitoring and
Adaptive monitoring with All Componentsis clearly impacted by scenarios that cause
the system to transition too frequently between a lightweight Global and a fine-grain Adaptive monitoring. Such is the case for use cases UC3 and UC4 because the faulty component is inserted and never removed. Using Adaptive monitoring is beneficial if the overhead of Global monitoring plus the overhead of switching back and forth to All
Components monitoringis less than the overhead of the Full monitoring for the same
execution period. If the application switches between monitoring modes too often then the benefits of adaptive monitoring are lost.
The overhead of switching from Global monitoring to full components or Localized
monitoringcomes from the fact that the framework must reload and instrument classes
to activate the monitoring probes. Therefore, using Localized monitoring reduces the number of classes that must be reloaded. This is shown in the third use-case of figure 6, which uses a heuristic based on the number of failures. Because we execute the faulty component many times, the heuristic is able to select, monitor and identify the faulty component quickly. This reduces overhead by 93%. We use the following equation to calculate overhead:
UC1 UC2 UC3 UC4 UC5 UC6 0 200 400 600 T ime (seconds) Full monitoring
Adaptive with All Components using Memory Instrumentation Adaptive with All Components using Heap Exploration Localized monitoring using Memory Instrumentation Localized monitoring using Heap Exploration Global Monitoring
Figure 6: Execution time for some use cases under different monitoring policies.
Gain = 100 − OurApproach − GlobalM onitoring F ullM onitoring − GlobalM onitoring ∗ 100
We also evaluate the execution time for each use case using the instrumentation-based memory monitoring mode. The average gain in that case is 81.49% and, as shown in previous section, in average it behaves worse than the Heap Exploration mechanism. However, it is worth noting that the difference between using memory monitoring based on instrumentation and heap exploration is less remarkable than in the previous experiment. Observe how in test UC4, using a combination of heap ex-ploration and adaptive monitoring with all components behaves worse than using plain instrumentation-based memory monitoring. In this particular test, activating and de-activating the monitoring probes dominate the execution time. Alas, adding a heap exploration step right after the probes are activated, just add some extra overhead. On the contrary, there is no additional step executed when we use instrumentation to mea-sure the memory usage. Apparently, what matter when the all components strategy is guiding the adaptive monitoring is the ratio among the amount of allocations performed by components and the size of those components.
4.4. Overhead from switching monitoring modes, and the need of a good heuristic As we explain in the previous experiments, even if using Localized monitoring is able to reduce the overhead of the monitoring system, the switch between Global and
Localized monitoringintroduces additional overhead. If this overhead is too high, the
benefits of adaptive monitoring are lost.
In this experiment we show the impact of the application’s size, in terms of number of components, and the impact of the component’s size, in terms of number of classes, on adaptive monitoring. We also show that the choice of the heuristic to select sus-pected components for monitoring is important to minimize the overhead caused from repeated instrumentation and probe activation processes.
For the use case, we created two components and we introduced them into the template application separately. Both components perform the same task, which is
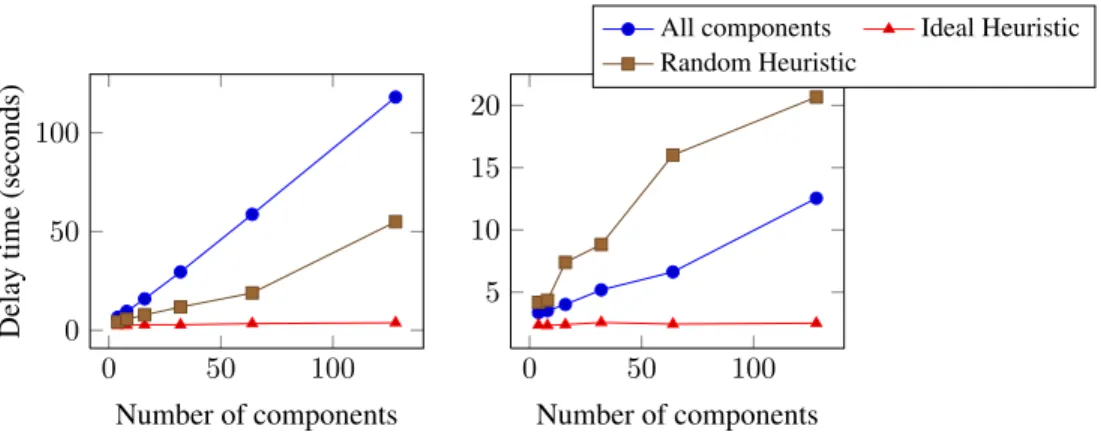
0 50 100 0 50 100 Number of components Delay time (seconds)
Figure 7: Delay time to detect fault with a component size of 115 classes.
0 50 100 5 10 15 20 Number of components
All components Ideal Heuristic Random Heuristic
Figure 8: Delay time to detect fault with a component size of four classes.
performing a primality test on a random number and sending the number to another component. However, one of the components causes 115 classes to be loaded, while the other only loads 4 classes.
We used the same basic scenario with a varying number of primality testing’s com-ponents and component sizes. In this way, we were able to simulate the two dimensions of application size. The exact settings, leading to 12 experiments, are defined by the composition of the following constraints:
• Ncomp = {4, 8, 16, 32, 64, 128} which defines the number of components for
the application
• Sizecomp= {4, 115} which defines the number of classes for a component
With these use cases, we measured the delay to find the faulty component and the execution-time overhead caused by monitoring. Figures 7 and 8 show the delay to detect the faulty component with regards to the size of the application. In the first figure, the component size is 115 classes, and in the second figure, the component size is four classes.
4.4.1. Impact of the application size
Using figures 8 and 10, we see that the size of the application has an impact on the delay to detect faulty components, and also on the monitoring overhead. We also calculated the time needed to find the faulty component with the All components mode after its initialization (the time needed to switch from Global monitoring). This time is around 2 seconds no matter the size of the application. That is the reason the switch from Global monitoring to All components has such a large effect on overhead.
These figures also show that using Localized monitoring instead of All components when switching from Global monitoring helps reduce the impact of the application’s size by reducing the number of components to monitor and the number of classes to in-strument. However, we also see that using a sub-optimal heuristic may have negatively
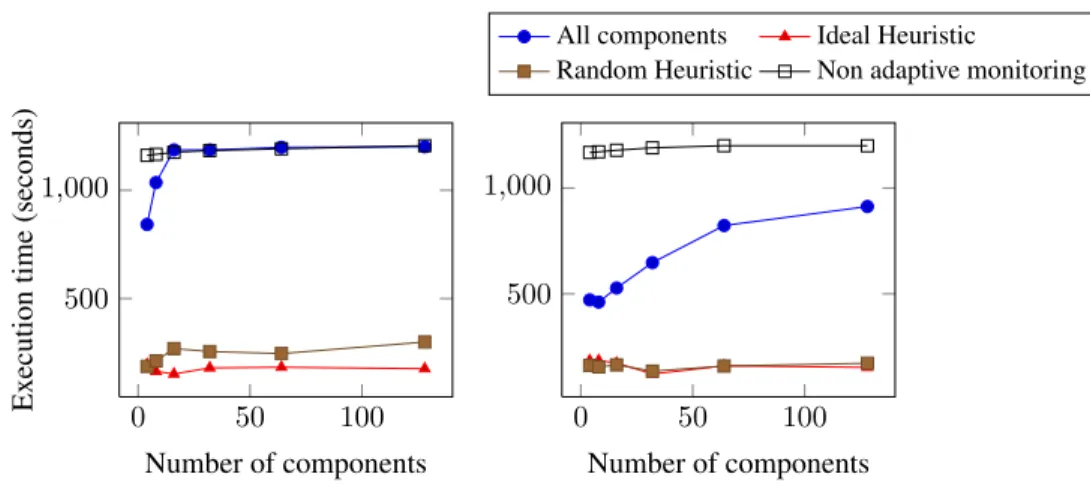
0 50 100 500 1,000 Number of components Ex ecution time (seconds)
Figure 9: Execution time of main task with a component size of 115 classes.
0 50 100
500 1,000
Number of components
All components Ideal Heuristic
Random Heuristic Non adaptive monitoring
Figure 10: Execution time of main task with a component size of four classes.
impacted the delay to detect faulty components. This can be explained by the multiple switches that the Random heuristic may often require to locate the faulty component. 4.4.2. Impact of the component size
In figures 7 and 8 we can observe that the component size greatly impact the per-formance and the delay for ScapeGoat to find the faulty comopnent. Similar to the explanation for the application’s size, component size impacts the switch from Global
monitoringto Localized monitoring, beacause of the class reloading and
instrumenta-tion. A good heuristic rastically reduces the number of transitions; thus, it has a huge impact on the delay. When the components size increase, the choice of a good heuris-tics becomes even more important, because the cost of dynamic monitoring probes injection increase with the size of the components.
5. ScapeGoat to spot faulty components in a scalable diverse web application In this section, we present another application that benefits from the Scapegoat approach. Although the general goal of spotting components that behave abnormally regarding resource consumption remains the same, with this use case we highlight the possibility of using Scapegoat to automatically find buggy components on a scalable modular web application. The section 5.1 presents an introduction to the application use case, while the remainder of the section deals with the experimental setup and the results.
5.1. Use case presentation
We are applying the ScapeGoat approach to check resource consumption contracts
on a web application called MdMS.9 This application offers a web Content
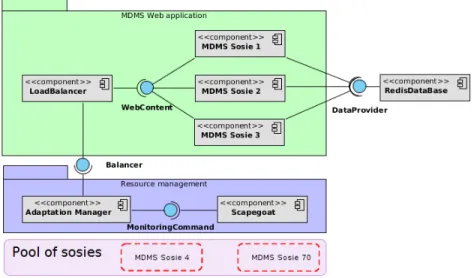
Figure 11: Architecture of MdMS along with Scapegoat and additional components to adapt th system.
ment System based on the Markdown language for editing posts. MdMS uses a typical architecture (as shown in Figure 11) for scalable web applications: a load-balancer con-nected to a set of workers (called MdMS Sosie in the Figure 11), which are themselves connected to a distributed database to retrieve the application specific content. The worker layer of this application can be duplicated across various machines to support a
growing number of clients. The web application is currently online10.
The main characteristic of MdMS is that all workers are not pure clones but di-verse implementations of the MdMS server stack [43]. This proactive diversification of MdMS targets safety [44] and security [45] purposes. In particular, we have used our recent technique for the automatic synthesis of sosie programs [46] in order to auto-matically diversify the workers. A sosie is a variant of a program that exhibits the same functionality (passes the same test suite) and a diverse computation (different control or data flow). Sosie synthesis is based on the transformation of the original program through statement deletion, addition or replacement.
While the construction of sosies focuses on preserving functional correctness, it ignores all the non-functional aspects of the program. Consequently, a sosie offers no guarantee regarding its resource consumption and may contain memory leaks or other overhead on resource consumption that can significantly impact the performance of MdMS.
In this experiment, we use ScapeGoat to monitor the resource consumption of the various sosies of the MdMS workers. This technique enables us to identify sosies in a production environment that do not behave according to the resource consumption contracts, allowing the system to remove these workers and use other sosies. Our goal
in this experiment is to answer the following research question:
• Does ScapeGoat correctly identify the faulty components in a system which in-cludes many variants of the same component?
5.2. Experimental setup
We devised this experiment as a scenario where many clients interact with the web application at the same time by adding and removing articles. The stress produced by these requests increases the resource consumption on the server side which is running on top of Kevoree components. Figure 11 depicts the server side’s configuration. Since
MdMS is a web application developed on top of RingoJS 11, a JavaScript runtime
written in Java, our sosies include the RingoJS framework and the application that has been wrapped into Kevoree components.
In this experiment, we deploy many of these components as back-end servers of the web application and we use ScapeGoat to monitor the consumption of each server. Their contracts regarding resource consumption were built using the mechanism de-scribed in section 4.1 but with the original MdMS worker as a reference component. The application also contains a component acting as a front-end that evenly distributes the requests among back-end servers. This load balancer implements a plain round robin policy.
To produce a realistic load on the web server we have recorded a set of standard
activities on the MdMS web site using Selenium12. We then use the Selenium facilities
to replay these activities many times in parallel to provide the required work load on the server. Our experimental settings feature 120 clients which are scheduled by a pool of 7 concurrent Selenium workers. Each client adds 10 articles to the database through the Website GUI, which represents 16 requests per article, for a total of 19200 requests to the MdMS workers sent through the load balancer. In this experiment, the Selenium workers are executed on the same physical device as the web server, with the same testing platform described in section 4.1.
The experiment is configured as follows. Using the diversification technique de-scribed in [46], we synthesized 20 sosies of the MdMS workers. These sosies are used to execute the application with a varying number of back-ends (from 4 to 10). One particular sosie has been modified by hand to ensure that it violates the original com-ponent’s contract. We execute all the described components as well as the ScapeGoat components on a single instance of Kevoree.
5.3. Experimentation results
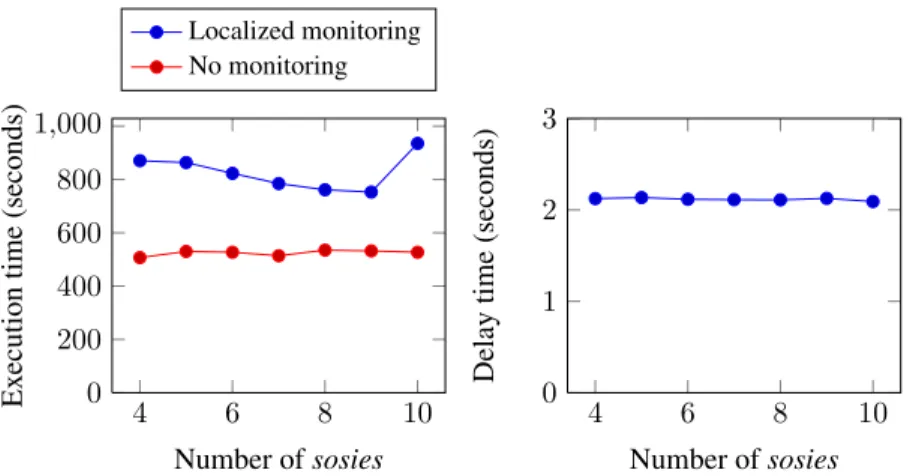
Figure 12 shows the time required on the server side to reply to all the requests sent by Selenium. Although the values might look surprisingly high at first, they are in fact the result of a heavily loaded system. Selenium is actually rendering a couple of web pages for each added article; hence at least 2400 pages are rendered. Moreover, both clients and servers are sharing resources because they run on the same physical device.
11https://github.com/ringo/ringojs 12http://www.seleniumhq.org/
4 6 8 10 0 200 400 600 800 1,000 Number of sosies Ex ecution time (seconds) Localized monitoring No monitoring
Figure 12: Time to obtain the reply to all requests. 4 6 8 10 0 1 2 3 Number of sosies Delay time (seconds)
Figure 13: Average delay time to detect a faulty sosie.
This leads to very stable execution times when monitoring is not activated because the number of requests does not change between experiments, the load balancer distributes these requests evenly, and we are using the same physical device to execute all back-end servers. In the local monitoring series, the global time to execute decreases until reaching 9 sosies. Although counterintuitive, it is caused by the effect of having
local-ized monitoringand load balancing at the same time. For instance, when four sosies
are used, the monitoring probes are periodically injected into one component out of four, hence roughly a quarter of the requests are handled by a slower sosie. However, with eight components the slow execution path is only taken by around 12.5% of the requests. The overhead of Localized monitoring when ten sosies are deployed increases because the physical machine reaches its limit and begins thrashing. As a consequence, low-level interactions with the hardware (e.g. cache misses), the operating system and the JVM slow down the execution. On average, the overhead due to monitoring with both instruction instrumentation and memory instrumentation is 1.59, which is lower than the values shown in section 4.2 for full monitoring despite only one of the instru-mentation mechanisms being enabled in those experiments. The values in this section are better even if we are monitoring both resources because we are using the adaptive approach.
In these experiments, we evaluate the accuracy of the output and its quality in terms of the time needed to find the faulty component. ScapeGoat always spots the correct sosie. It does so because it is an iterative process that continues until finding the faulty component. In addition, ScapeGoat does not output false positives during these experiments. The delay to detect faulty components is shown in Figure 13. In this case, the values remain close to 2 seconds no matter the number of sosies used nor the execution time. This behavior is consistent with the experiments in section 4 because we are also using a good heuristic for the use case. It shows that ScapeGoat can spot faulty components with an acceptable delay in a real application.