HAL Id: inserm-01077107
https://www.hal.inserm.fr/inserm-01077107
Submitted on 23 Oct 2014HAL is a multi-disciplinary open access archive for the deposit and dissemination of sci-entific research documents, whether they are pub-lished or not. The documents may come from teaching and research institutions in France or
L’archive ouverte pluridisciplinaire HAL, est destinée au dépôt et à la diffusion de documents scientifiques de niveau recherche, publiés ou non, émanant des établissements d’enseignement et de recherche français ou étrangers, des laboratoires
Exhaled nitric oxide, nitrite/nitrate levels, allergy,
rhinitis and asthma in the EGEA study.
Rachel Nadif, Marta Rava, Brigitte Decoster, Hélène Huyvaert, Nicole Le
Moual, Jean Bousquet, Valérie Siroux, Raphaëlle Varraso, Isabelle Pin, Farid
Zerimech, et al.
To cite this version:
Rachel Nadif, Marta Rava, Brigitte Decoster, Hélène Huyvaert, Nicole Le Moual, et al.. Exhaled nitric oxide, nitrite/nitrate levels, allergy, rhinitis and asthma in the EGEA study.. European Respi-ratory Journal, European RespiRespi-ratory Society, 2014, 44 (2), pp.351-60. �10.1183/09031936.00202413�. �inserm-01077107�
Exhaled NO, nitrite/nitrate levels, allergy, rhinitis and asthma in the EGEA study
1
Rachel Nadif1,2, Marta Rava1,2, Brigitte Decoster3, Hélène Huyvaert3,4, Nicole Le Moual1,2, 2
Jean Bousquet1,2,5, Valérie Siroux6,7, Raphaëlle Varraso1,2, Isabelle Pin6,7,8, Farid Zerimech4, 3 Régis Matran3 4 Affiliations: 5 1
Inserm, Centre for research in Epidemiology and Population Health (CESP), U1018, 6
Respiratory and Environmental Epidemiology Team, F-94807, Villejuif, France 7
2
Univ Paris-Sud, UMRS 1018, F-94807, Villejuif, France 8
3
Univ Lille Nord de France, F-59000, Lille, France 9
4
Laboratoire de Biochimie, Centre de Biologie Pathologie, CHRU de Lille, F-59000, Lille, 10
France 11
5
CHU Arnaud de Villeneuve, F-34295, Montpellier, France 12
6Inserm, U823, équipe d’épidémiologie environnementale appliquée à la reproduction et la
13
santé respiratoire, Institut Albert Bonniot, F-38042, Grenoble, France 14
7
Univ Joseph Fourier, F-38000, Grenoble, France 15
8
Pédiatrie, CHU de Grenoble, F-38043, Grenoble, France 16
17
Corresponding author:
18
Marta Rava, PhD, Inserm, Centre for research in Epidemiology and Population Health 19
(CESP), U1018, Respiratory and Environmental Epidemiology Team, F-94807, Villejuif, 20
France. Phone number: 33 (0) 145 59 53 58, Fax number: 33 (0) 145 59 51 69 21
E-mail: marta.rava@inserm.fr
Word count: 3173. 23 Conflict of interest 24 None. 25 26 Abstract 27
Background: Although interest in biomarkers in the nitrate-nitrite-NO pathway has recently
28
increased, associations between nitrite (NO2−), nitrate (NO3−) and asthma, allergic 29
sensitization and rhinitis remain unclear. 30
Objective: To evaluate the associations between NO2−/NO3− and exhaled fraction of nitric 31
oxide (FENO) levels with asthma, allergic sensitization and rhinitis.
32
Methods: Plasma and exhaled breath condensate (EBC) NO2−/NO3− and FENO levels were 33
measured in 523 adults of the French Epidemiological study on Genetics and Environment of 34
Asthma. Allergic sensitization was defined by a positive skin prick test for at least one 35
aeroallergen. Subjects were classified as non-sensitized, sensitized and as having allergic 36
rhinitis. 37
Results: Plasma NO2−/NO3− level was unrelated to any disease phenotypes. EBC NO2−/NO3− 38
level was unrelated to any asthma phenotypes. EBC NO2−/NO3− and FENO levels were 39
correlated in sensitized subjects only (r=0.21±0.10, p=0.01). EBC NO2 −
/NO3 −
and FENO levels 40
were higher in sensitized than in non-sensitized subjects (adjusted GM (95%CI): 2.36 (1.96; 41
2.84) vs.1.72 (1.38; 2.14) µmol/mg proteins, p=0.008; and 18.3 (16.7; 20.0) vs.14.8 (13.3; 42
16.5) ppb, p=0.0006 respectively), with gradual relationships from sensitized subjects to those 43
with allergic rhinitis (p<0.0001). 44
Conclusion: Results suggest that EBC NO2−/NO3− and FeNO levels may be considered as 45
biological markers of intensity of allergic sensitization and rhinitis. 46
Key words: asthma, allergic sensitization, rhinitis, adults, NO metabolism, exhaled breath
48
condensate, total nitrite/nitrate, exhaled fraction of NO. 49
Introduction
51
The interest in measuring biological markers in exhaled breath condensate (EBC) in 52
epidemiological studies on respiratory diseases has increased in the last years. Among the 53
pathways involved in the pathophysiology of asthma, the metabolism of nitric oxide (NO) 54
also called the nitrate-nitrite-NO pathway has taken a growing place in this research field [1]. 55
The NO metabolism is complex, and both NO measured by the exhaled fraction of NO (FENO) 56
and NO-related compounds such as nitrites (NO2−) and nitrates (NO3−) are relevant biological 57
markers that may help to better understand the patho-physiology of asthma and allergy [2]. 58
FENO is the most studied one, and it is commonly considered as a non-invasive indirect marker 59
of airway inflammation [3]. Both epidemiological and clinical studies in adults showed 60
increased level of FENO in children and adults with asthma, and positive associations between 61
FENO and allergic sensitization are consistent over the studies, regardless of rhinitis or asthma 62
[4]. Studies on associations between NO2 −
and NO3 −
levels with asthma, allergy or rhinitis 63
have led to more conflicting results both in adults and children [5–17]. Until now, none of 64
these studies has simultaneously performed measurements of EBC NO2−/NO3− and FENO
65
levels in the same subjects. Recently, in a large number of adults from the French 66
Epidemiological study on Genetics and Environment of Asthma (EGEA), EBC NO2−/NO3− 67
and FENO levels were found to be correlated in subjects without asthma [18]. 68
Nitric oxide has different functions and roles in pathophysiology, which may be better 69
explained by considering its compartmentalized production [19]. In this study, we compared 70
the association between total NO2−/NO3− levels measured in two compartments (plasma and 71
exhaled breath condensate) and FENO levels with asthma, allergic sensitization and rhinitis 72
among 523 adults from the EGEA study. We hypothesized that the associations will be 73
different depending on the compartments, biomarkers and outcomes studied. 74
Methods
76
Study design 77
Data used for the analyses were collected in the framework of the 12-year follow-up of 78
EGEA. EGEA is a French cohort study based on an initial group of asthma cases and their 79
first-degree relatives, and controls (first survey, n=2047) [20]. The protocol and descriptive 80
characteristics have been described previously [21,22]. A follow-up of the initial cohort was 81
conducted between 2003 and 2007 [23]. Among the alive cohort (n=2002), 92% (n=1845) 82
completed a short self-administered questionnaire and among them 1601 had a complete 83
examination. All subjects responded to a questionnaire based on international standardized 84
tools to diagnose asthma and to determine respiratory and allergic symptoms, treatments, and 85
environmental exposures. The present cross-sectional analysis includes those who were adults 86
at the second survey (≥ 16 years old, n=1570 adults) with available data on asthma, current 87
rhinitis, allergic sensitization, and available measurements of exhaled breath condensate 88
NO2−/NO3− and FENO levels (n=523). Subjects included in the analyses were younger, 89
reported more often ever asthma and current rhinitis, and had higher levels of NO2-/NO3- and 90
Immunoglobulin E (IgE) than those not included in the analyses (n=1047). The two groups 91
were similar for sex, smoking, current asthma status, allergic sensitization, lung function tests, 92
and eosinophil (EOS) count (see Table 1 in supplementary data). 93
Ethical approval was obtained from the relevant institutional review board committees 94
(Cochin Port-Royal Hospital and Necker-Enfants Malades Hospital, Paris). Written informed 95
consent was signed by all participants. 96
Respiratory phenotypes 98
Subjects with ever asthma were defined by a positive answer to either: “Have you ever had 99
attacks of breathlessness at rest with wheezing?”, or “Have you ever had asthma attacks?”, or 100
if they were recruited as asthmatic cases at the first survey. 101
Allergic sensitization was defined by a positive skin prick test (SPT+) with a mean wheal 102
diameter 3mm than the negative control for at least one of 12 aeroallergens (indoor: cat, 103
Dermatophagoides pteronyssinus, Blattela germanica, outdoor: olive, birch, Parieteria 104
judaica, timothy grass, Cupressus and ragweed pollen, and molds: Aspergillus, Cladosporium 105
herbarum, Alternaria tenuis). Subjects were classified as sensitized if they have one or more 106
SPT+. Current rhinitis was defined by a positive answer to one of the two questions: “Have 107
you ever had rhinitis?" or " Have you ever had hay fever?” and a positive answer to “have 108
you had sneezing problems or a runny nose in the past 12 months?” Allergic rhinitis was 109
defined as having both current rhinitis and one or more SPT+. Subjects were also classified in 110
three groups as non sensitized (no SPT+), sensitized only (having one or more SPT+ and no 111
current rhinitis) and as having allergic rhinitis (one or more SPT+ and current rhinitis). 112
Eosinophilia was defined as eosinophil count ≥5%. Details on other phenotypes are given in 113 supplementary data. 114 115 Biological phenotypes 116
Exhaled breath condensate (EBC) was collected with an RTube™ according a standardized 117
method. Briefly, the RTube (TM) was rinsed with deionized water and dried thoroughly. 118
Participants breathed orally at tidal volumes into a mouthpiece attached to a cold condenser (-119
20°C). They were seated comfortably with a headrest. All headrests and back seats were tilted 120
slightly to avoid any saliva contamination during breathing maneuvers (see supplementary 121
Total nitrite-nitrate (NO2−/NO3−) levels were measured in plasma and EBC as previously 123
described [24]. All measurements were done in duplicate. Analytical intra-run imprecision 124
was below 3%. Measurements with a coefficient of variation >15% and extreme outliers 125
(n=7) were excluded from the analyses (see supplementary data for more details). 126
Measurements of FENO were realized before other pulmonary function tests according to 127
ATS/ERS recommendations (see supplementary data). The measurement was performed only 128
in 3 of the 5 centers involved in the EGEA study, which explained in a large part the attrition 129
on numbers of subjects included in the analysis compared to the total number. FENO level was 130
measured at 50mL/s flow rate as previously described [23]. 131
132
Statistical Methods 133
Joint distribution of asthma, SPT+ and current rhinitis was shown with a Venn diagram 134
(Figure 1). Total plasma and EBC NO2 −
/NO3 −
and FENO levels were log10-transformed as a 135
result of their skewed distribution. 136
In the same study, we previously reported that plasma NO2−/NO3− level was increased with 137
leafy vegetable consumption and decreased in smokers and with storage time, that EBC 138
NO2−/NO3− level was decreased in smokers and with exposure to ambient ozone 139
concentration [24], and that FENO level was associated with season of examination [23]. 140
Furthermore, storage time and season of examination varied with centre. Therefore estimates 141
were adjusted for 1) age, sex, smoking, leafy vegetable consumption and centre for plasma 142
NO2−/NO3−, 2) age, sex, smoking, ambient ozone concentration and centre for EBC 143
NO2−/NO3−, and 3) age, sex, height, smoking and centre for FENO. Since the ratio of higher 144
oxides of nitrogen (HiNOx including NO2− and NO3−) to NO was reported be more 145
informative than each measurement alone by Nguyen et al. [13], the (NO2− + NO3−)/NO ratio 146
(NOx/NO ratio) has also been studied. 147
As inhaled corticosteroids (ICS) use can decrease FENO levels, and as NO2−/NO3− and FENO 148
are biological markers involved in the same pathway, association between ICS use and EBC 149
NO2 −
/NO3 −
level was studied. Since increased body mass index (BMI)/obesity has been 150
associated with lower FeNO level, estimates were also adjusted for BMI as a sensitivity 151
analyses. 152
Associations between total NO2−/NO3− levels, FENO levels, and the NOx ratio (NO2− + 153
NO3−)/NO and asthma phenotypes, allergic sensitization and current rhinitis were estimated 154
with linear regression models. Parameter estimates were assessed by using generalized 155
estimating equations, with an exchangeable working correlation to account for the potential 156
clustering within families (SAS MIXED procedure). The level of statistical significance was 157
set at α=0.05. Two-sided P values were reported for all association estimates. All analyses 158
were conducted using SAS software, version 9.3 (SAS Institute, Inc., Cary, NC, USA). 159
160
Results
161
The characteristics of the 523 adults according to their asthma status are summarized in Table 162
1. As expected, subjects with asthma had significantly higher eosinophilia, lower FEV1% 163
predicted, more often bronchial hyper-responsiveness (BHR), SPT+, and reported more often 164
current rhinitis than subjects without asthma. After adjustment for age, sex and smoking, the 165
following associations between asthma and eosinophilia (odds ratio (OR) 3.12, 95% 166
confidence interval (CI, 1.72-5.66), FEV1% predicted (mean ± SD: 107.7 ± 10.5 vs. 97.5 ± 167
11.0), BHR (OR, 4.18; 2.66-6.57), SPT+ (OR, 5.07; 3.32-7.72) and current rhinitis (OR, 4.62; 168
3.11-6.85) were confirmed (all P<0.0005). EOS count, IgE and FENO levels were significantly 169
higher in subjects with asthma than in those without (all P<0.0001). EBC NO2−/NO3− level 170
was unrelated to ICS use (data not shown, P value=0.5). 171
Pairwise association between EBC NO2−/NO3−, FENO levels and blood eosinophil counts
173
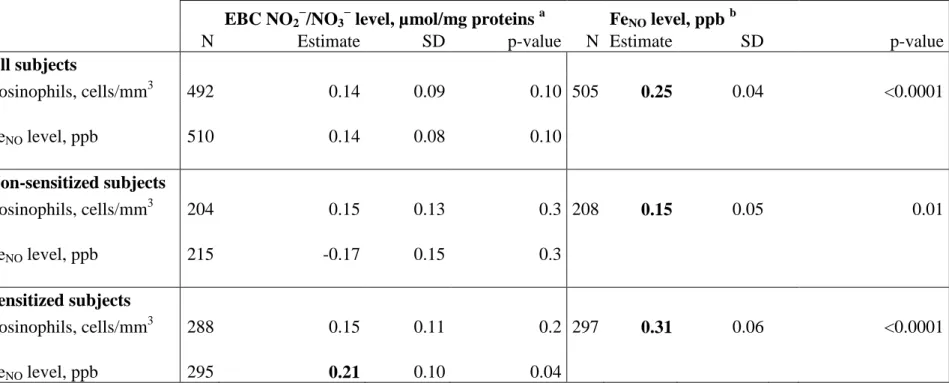
EBC NO2−/NO3− levels were unrelated with EOS, whereas FENO levels were positively 174
associated with EOS in all subjects, both in non-sensitized and sensitized subjects (Table 2). 175
In sensitized subjects, EBC NO2−/NO3− was positively associated with FENO levels. 176
The median FENO value in the population was 15.6 ppb (range 2.4 to 99.0 ppb). Stratification 177
according to this median value showed positive and significant association between EBC 178
NO2−/NO3− level and allergic sensitization in subjects above the median only (2.66 (2.06-179
3.43) vs. 1.64 (1.18-2.28), P=0.01 and 2.03 (1.52-2.71) vs. 1.76 (1.30-2.38), P=0.4 in subjects 180
above and below the median respectively). 181
182
Plasma and EBC NO2−/NO3−, FENO levels and asthma and asthma-related phenotypes
183
Both plasma and EBC NO2−/NO3− levels were unrelated to ever asthma, current asthma, 184
symptomatic score, and asthma control (data not shown, all P values>0.3). Furthermore, 185
plasma NO2−/NO3− level was unrelated to allergic sensitization and current rhinitis. 186
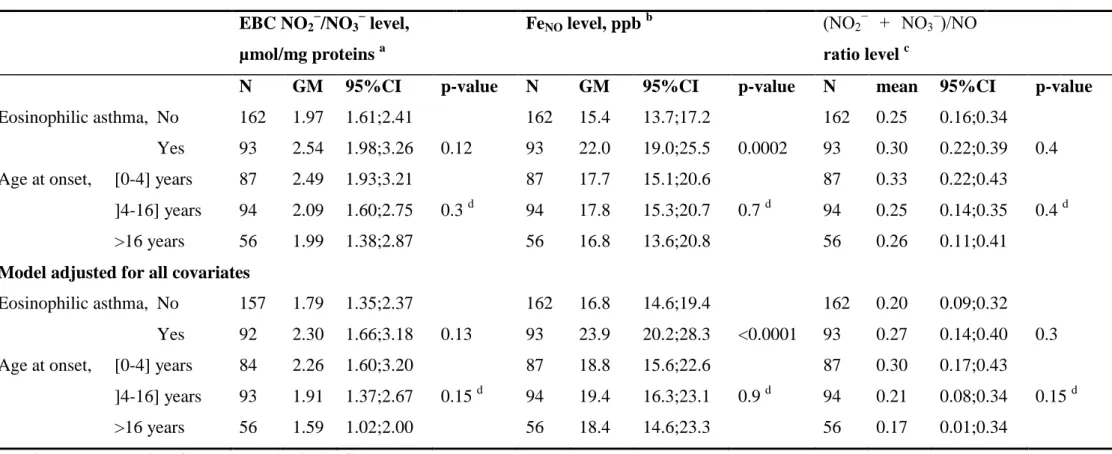
Both plasma and EBC NO2−/NO3− levels were unrelated to eosinophilic asthma nor to age at 187
asthma onset (Table 3). As expected, a positive and significant association was observed 188
between FENO level and eosinophilic asthma (Table 3) but no other significant association was 189 observed. 190 191 EBC NO2 − /NO3 −
and FENO levels, NOx/NO ratio and allergic sensitization
192
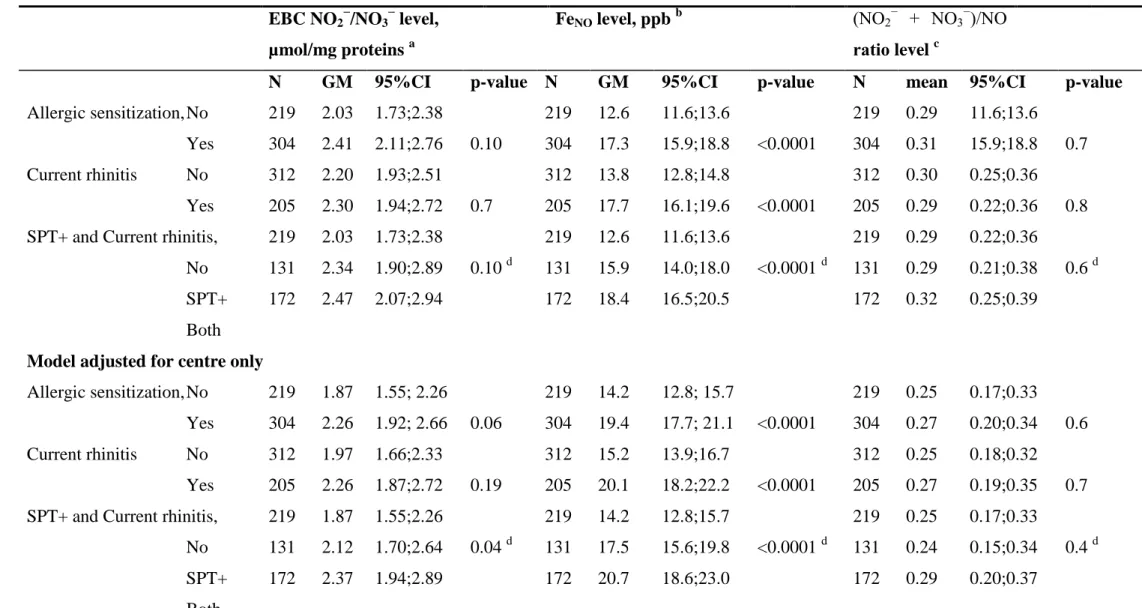
A positive association at borderline significance was observed between EBC NO2−/NO3− level 193
and SPT+ (see Table 4). In a model adjusted for covariates, including asthma, EBC 194
NO2−/NO3− level was positively and significantly associated with SPT+, and a positive 195
association at borderline significance was observed with current rhinitis. Furthermore, 196
positive and gradual increases in EBC NO2−/NO3− level were observed with SPTQ (see Figure 197
1 in supplementary data), and when subjects were classified in the following groups: no 198
SPT+, SPT+ only, and both SPT+ and current rhinitis (see Table 4 and Figure 2). The median 199
EBC NO2 −
/NO3 −
value in our population was 2.25 µmol/mg proteins (range 1.12 to 4.98, 200
Table 1). Stratification according to this median value showed positive and significant 201
associations between subjects above the median value and 1) allergic sensitization (OR, 1.92; 202
1.25-2.97, p=0.003), 2) current rhinitis (OR, 1.52; 1.01-2.28, p=0.04), and 3) SPT+ only or 203
both SPT+ and current rhinitis versus no SPT+ (OR, 1.64; 1.01-2.66, p=0.04, and 2.16; 1.29-204
3.59, p=0.003 respectively) in GEE regression models with adjustement for age, sex, 205
smoking, ambient ozone concentration, asthma and centre. 206
Similarly to EBC NO2−/NO3−, FENO level was also positively related to allergic sensitization
207
expressed as SPT+ (Table 4), and gradually increased with SPTQ (see Figure online for 208
details), and with allergic sensitization and current rhinitis. FENOwas also significantly and 209
positively associated with current rhinitis. The associations between FENOlevels and SPT+, 210
and current rhinitis were confirmed when BMI instead of height was added as covariate in the 211
models (data not shown). 212
No significant association were observed between the (NO2− + NO3−)/NO ratio (NOx/NO 213
ratio) and SPT+, current rhinitis or both (Table 4 and Figure 2). When analysing SPT+ to 214
indoor, outdoor or molds allergens separately, EBC NO2 −
/NO3 −
levels showed positive and 215
significant associations with sensitization to molds allergens, and FENO levels were positively 216
associated to indoor allergens (Table 4). 217
Discussion
219
The present study conducted on a large sample of adults with a precise phenotypic 220
characterization shows for the first time the similarities and differences for the associations of 221
both FENO and exhaled breath condensate NO2−/NO3− levels with asthma, allergic 222
sensitization and rhinitis. Results showed higher EBC NO2−/NO3−and FENO levels in subjects 223
with allergic sensitization, with current rhinitis, and in particular when both are present. Only 224
FENO levels were found to be higher with asthma. EBC NO2−/NO3−and FENO levels were 225
positively associated in sensitized subjects only, and EBC NO2 −
/NO3 −
levels were found to be 226
associated with allergic sensitization in subjects with higher FENO levels only. 227
The selection of the 523 subjects included in the present analyses was driven first by the 228
random availability of the FENO measurements in three of the five participating centres [23], 229
and secondly by the availability of the other variables of interest. Definition of asthma case is 230
very precise in our study since asthmatic cases were recruited in chest clinics, and a procedure 231
was set up to include true asthmatics, leading to a very limited risk of false positives. 232
Prevalence of bronchial hyper-responsiveness, measured by a methacholine challenge test was 233
quite high in subjects without asthma. A possible explanation is that part of the subjects 234
without asthma are first degree relatives of asthma cases. Nevertheless, this result is 235
consistent with the relatively considerable number of asymptomatic subjects with BHR 236
reported in cross-sectional epidemiologic studies, ranging from 19.3 to 62.4%. Subjects 237
included in the analyses had higher EBC NO2−/NO3−and FENO levels than non-selected 238
subjects. Other limitations of the present study were those commonly related to cross-239
sectional analyses of the data. 240
We reported no association between NO2−/NO3− level measured in plasma and any disease 241
phenotypes. We previously reported that plasma and EBC NO2−/NO3− levels were not 242
correlated [18]. The metabolism of NO is complex, and the production of NO2−/NO3− in 243
plasma differs from that in EBC due to their compartmentalization. In plasma NO2−/NO3− 244
production derives from several sources, such as bacteria, enzymatic production and dietary 245
sources [25]. In EBC ionized NO3 −
and NO2 −
(not volatile) may arise from NO after reaction 246
with oxygen [26] or from activated immune cells present in the lining fluid of the lungs [27]. 247
Overall, the specificities of the NO metabolism in plasma and in EBC may partly explain the 248
lack of association with any clinical phenotypes in plasma. Our results are consistent with the 249
hypotheses of Villanueva and Giulivi [19], for whom the compartmentalized production of 250
NO better explains its different functions and roles in pathophysiology. 251
No association was found between total NO2−/NO3− level in EBC and asthma phenotypes, as 252
previously reported in other studies [8,14]. Contrary to our results, other studies have reported 253
total NO2−/NO3− level in EBC to be elevated in subjects with asthma as compared to healthy 254
non-smoking subjects [17], healthy non-atopic controls [5], or controls [9]. These conflicting 255
results may be due to the very small number of subjects included in these studies, the various 256
methodologies used for measuring NO2− and NO3− levels, the choice of the reference group 257
for comparisons and other differences such as those related to phenotypes definition. Beside, 258
information regarding allergic sensitization was not available or subjects were defined as 259
asthmatics if they had both asthma and allergy, suggesting that the increase in NO2−/NO3− 260
level could be more related to allergy than to asthma. Furthermore, none of these previous 261
studies have expressed the NO2−/NO3− level divided by the amount of proteins. As reported by 262
Gessner and Wirtz [28], the measurement of total protein in EBC is important to confirm that 263
protein and peptide markers are comparable between studies. They should always be 264
performed in addition to specific markers investigated, and we previously found that 265
NO2−/NO3− level in EBC was positively related to protein concentration in our study [29]. 266
As reported in the literature [4,30], positive associations between FENO level and asthma, 267
study reported for the first time similarities and differences for the associations of both FENO 269
and exhaled breath condensate NO2−/NO3− levels with asthma, allergic sensitization and 270
current rhinitis. We found positive associations between EBC NO2 −
/NO3 −
and FENO levels in 271
sensitized subjects, and between EBC NO2−/NO3− levels with allergic sensitization in subjects 272
with higher FENO levels. Consistently, we found that both EBC NO2−/NO3− and FENO levels 273
increased with allergic sensitization, with the number of SPT+, and that gradual relationships 274
were observed between sensitized subjects only and those with both allergic sensitization and 275
rhinitis. An immediate practical utility could not be inferred from the results obtained in the 276
framework of this epidemiologic study; but taken together, our results suggest that EBC 277
NO2−/NO3− and FENO levels may be considered as biological markers of intensity of allergic
278
sensitization and rhinitis. Longitudinal studies are also needed to better understand the role of 279
these biomarkers, in line with the idea that part of the "allergic march" involves oxidative and 280
nitrosative processes. 281
By considering together EBC NO2−/NO3− and FENO levels rather than each alone, our results 282
provided complementary interesting information. To go further, we also studied the 283
association between the NOx(NO2− + NO3−)/NO ratio and allergic sensitization. 284
Unfortunately, this ratio was not more informative than considering the measurement of EBC 285
NO2 −
/NO3 −
alone. Contrary to our results, a ratio including also S-nitrosothiols (NO2 −
+ NO3 − 286
+ S-nitrosothiols)/NO was found to better evaluate inflammation in a case-control study on 287
asthma [13] than the measurement of each oxide of nitrogen alone. This discrepancy in the 288
results may be partly explained by the lack of measurement of S-nitrosothiols in our study, by 289
the fact that we studied allergic sensitization rather than inflammation, and/or by differences 290
in study designs. 291
Overall, even if our results need to be replicated, they may suggest a role of the nitrate-nitrite-292
NO pathway in allergic sensitization. We suggest that exposure to allergens results in uptake 293
and proceeding by dendritic cells inducing the development of Th2 cells in sensitized 294
individuals. Recent evidence indicates that airway epithelium also plays an important role in 295
the allergic airway response by the release of IL-25, IL-33 and TSLP which activate dendritic 296
cells, basophils, eosinophils and Th2 cells [31,32]. TSLP, IL-25 and IL-33 promote 297
eosinophilia in airway mucosa by inducing IL-5 production. Eosinophilic airway 298
inflammation may increase the NO concentration and subsequently produces the formation of 299
NO2−, NO3− and reactive nitrogen species in EBC. 300
The results reported in this study highlight the complexity of NO metabolism. Initially 301
considered completely inert, it is now apparent that nitrate and nitrite are physiologically 302
recycled in blood and tissues to form NO and other bioactive nitrogen oxides [2]. They may 303
be viewed as storage pools for NO-like bioactivity, thereby complementing the NO synthase 304
(NOS)-dependent pathway. NO and related compounds are produced by a wide variety of 305
residential and inflammatory cells in the respiratory tract[33]. In response to allergens, both 306
dendritic cells (DCs) and airway epithelial cells are stimulated, and release various cytokines 307
which activate DCs, basophils, mast cells, eosinophils and Th2 cells, leading to eosinophil 308
activation and proliferation [34]. We previously reported that FENO level was positively 309
associated with blood eosinophil counts [18], and there are in vitro evidences that human 310
blood eosinophils produce NO and participate in the regulation of the NO pool in pulmonary 311
tissues [35,36]. Moreover, NO modulates the Th1/Th2 balance by favoring Th2 response and 312
IL-5 production and thus recruiting eosinophils into the airways. Nevertheless, even if EBC 313
NO2−/NO3− level can be viewed as a potential biological marker of allergy in our study, its 314
specific role remains unknown, and mechanistic studies are required. As suggested through 315
the results of the present study, and as reported by Erzurum et al. [37], the complexity of the 316
nitrate-nitrite-NO pathway provide evidence that more targeted biological markers are needed 317
given patient, requiring the integration of multiple factors in a system biology approach. 319
Further studies are also warranted to better investigate the associations we observed in this 320
epidemiological study, and the potential for a practical utility of our findings. 321
In conclusion, we report for the first time in a large epidemiological study that both total 322
NO2−/NO3− and FENO levels in exhaled breath condensate are associated with allergic 323
sensitization and rhinitis. The role of the nitrate-nitrite-NO pathway in the "allergic march" 324
need to be further investigated in longitudinal studies. However, contrary to what has been 325
shown with FENO, we did not find an association of this biomarker with clinical phenotypes 326
of asthma. Studying both exhaled fraction of NO and EBC NO2−/NO3− may be helpful for 327
disentangle the associations between NO metabolism and asthma, allergic sensitization and 328
rhinitis. 329
Acknowledgments
331
The authors thank all those who participated in the study and in the various aspects of the 332
examinations and all those who supervised the study in all centers. The authors are grateful to 333
the three CIC-Inserm units of Necker, Grenoble and Marseille which supported the study and 334
where subjects were examined. They are also grateful to the three biobanks in Lille (CIC-335
Inserm), Evry (Centre National de Genotypage) and Annemasse (Etablissement francais du 336
sang) where biological samples are stored. They are indebted to all the individuals who 337
participated, without whom the study would not have been possible. 338
339
EGEA cooperative group
340
Coordination: V Siroux (epidemiology, PI since 2013); F Demenais (genetics); I Pin (clinical
341
aspects); R Nadif (biology); F Kauffmann (PI 1992-2012). 342
Respiratory epidemiology: Inserm U 700, Paris: M Korobaeff (Egea1), F Neukirch (Egea1);
343
Inserm U 707, Paris: I Annesi-Maesano (Egea1-2) ; Inserm CESP/U 1018, Villejuif: F 344
Kauffmann, N Le Moual, R Nadif, MP Oryszczyn (Egea1-2), R Varraso ; Inserm U 823, 345
Grenoble: V Siroux. Genetics: Inserm U 393, Paris: J Feingold ; Inserm U 946, Paris: E 346
Bouzigon, F Demenais, MH Dizier ; CNG, Evry: I Gut (now CNAG, Barcelona, Spain), M 347
Lathrop (now Univ McGill, Montreal, Canada). 348
Clinical centers: Grenoble: I Pin, C Pison; Lyon: D Ecochard (Egea1), F Gormand, Y
349
Pacheco ; Marseille: D Charpin (Egea1), D Vervloet (Egea1-2) ; Montpellier: J Bousquet ; 350
Paris Cochin: A Lockhart (Egea1), R Matran (now in Lille) ; Paris Necker: E Paty (Egea1-2), 351
P Scheinmann (Egea1-2) ; Paris-Trousseau: A Grimfeld (Egea1-2), J Just. 352
Data and quality management: Inserm ex-U155 (Egea1): J Hochez ; Inserm CESP/U 1018,
353
Villejuif: N Le Moual ; Inserm ex-U780: C Ravault (Egea1-2) ; Inserm ex-U794: N 354
Funding
356
Research funded in part by PHRC-Paris, PHRC-Grenoble, ANR 05-SEST-020-02/05-9-97, 357
ANR-06-CEBS, ANR-CES-2009, Region Nord Pas-de-Calais, Merck Sharp & Dohme 358
(MSD), and the GA2LEN project, Global Allergy and Asthma European Network. 359
360 361
Figure legends
362
Figure 1. Concordance of ever asthma, allergic sensitization (SPT+) and current rhinitis
363
(Proportional Venn Diagram).
364
Data on current rhinitis was missing for four participants without allergic sensitization and 365
asthma, one participant with asthma and one participant with allergic sensitization (n=517). 366
367
Figure 2. Associations between FeNO, total NO2−/NO3− and (NO2− + NO3−)/NO ratio levels 368
in exhaled breath condensate with allergic sensitization, current rhinitis and both.
369
Regression coefficients (Beta) and 95%CI for associations between FeNO, total NO2−/NO3− 370
levels, (NO2− + NO3−)/NO ratio and allergic sensitization, current rhinitis and both, estimated 371
through GEE linear regression methods, and adjusted for covariates: age, sex, smoking, 372
ambient ozone concentration, asthma and centre for NO2−/NO3− level; age, sex, smoking, 373
height, asthma and centre for FeNO level; age, sex, smoking, asthma and centre for (NO2 −
+ 374
NO3−)/NO ratio. 375
376 377
References
378
1. Lundberg JO, Weitzberg E. The biological role of nitrate and nitrite: the times they are 379
a-changin’. Nitric oxide 2010; 22: 61–63. 380
2. Lundberg JO, Weitzberg E, Gladwin MT. The nitrate-nitrite-nitric oxide pathway in 381
physiology and therapeutics. Nat Rev Drug Discov 2008; 7: 156–167. 382
3. Szefler SJ, Wenzel S, Brown R, Erzurum SC, Fahy J V, Hamilton RG, et al. Asthma 383
outcomes: biomarkers. J Allergy Clin Immunol 2012; 129: S9–S23. 384
4. Dweik RA, Boggs PB, Erzurum SC, Irvin CG, Leigh MW, Lundberg JO, et al. An 385
official ATS clinical practice guideline: interpretation of exhaled nitric oxide levels 386
(FENO) for clinical applications. Am J Respir Crit Care Med 2011; 184: 602–615. 387
5. Chérot-Kornobis N, Hulo S, Edmé J-L, De Broucker V, Matran R, Sobaszek A. 388
Analysis of nitrogen oxides (NOx) in the exhaled breath condensate (EBC) of subjects 389
with asthma as a complement to exhaled nitric oxide (FeNO) measurements: a cross-390
sectional study. BMC Res Notes 2011; 4: 202. 391
6. Chladkova J, Krcmova I, Chladek J, Cap P, Micuda S, Hanzalkova Y. Validation of 392
nitrite and nitrate measurements in exhaled breath condensate. Respiration 2006; 73: 393
173–179. 394
7. Corradi M, Pesci A, Casana R, Alinovi R, Goldoni M, Vettori MV, et al. Nitrate in 395
exhaled breath condensate of patients with different airway diseases. Nitric oxide 2003; 396
8: 26–30. 397
8. Dressel H, Müller F, Fischer R, Römmelt H, Hohlfeld JM, Behr J, et al. Independent 398
information of nonspecific biomarkers in exhaled breath condensate. Respiration 2010; 399
80: 401–409. 400
9. Ganas K, Loukides S, Papatheodorou G, Panagou P, Kalogeropoulos N. Total 401
nitrite/nitrate in expired breath condensate of patients with asthma. Respir Med 2001; 402
95: 649–654. 403
10. Dweik RA, Comhair SA, Gaston B, Thunnissen FB, Farver C, Thomassen MJ, Kavuru 404
M, Hammel J, Abu-Soud HM, Erzurum SC. NO chemical events in the human airway 405
during the immediate and late antigen-induced asthmatic response. Proc Natl Acad Sci 406
U S A 2001; 98: 2622-2627. 407
11. Gratziou C, Rovina N, Makris M, Simoes DCM, Papapetropoulos A, Roussos C. 408
Breath markers of oxidative stress and airway inflammation in Seasonal Allergic 409
Rhinitis. Int J Immunopathol Pharmacol 2008; 21: 949–957. 410
12. Malinovschi A, Pizzimenti S, Sciascia S, Heffler E, Badiu I, Rolla G. Exhaled breath 411
condensate nitrates, but not nitrites or FENO, relate to asthma control. Respir Med 412
2011; 105: 1007–1013. 413
13. Nguyen T-A, Woo-Park J, Hess M, Goins M, Urban P, Vaughan J, et al. Assaying all 414
of the nitrogen oxides in breath modifies the interpretation of exhaled nitric oxide. 415
Vascul Pharmacol 2005; 43: 379–384. 416
14. Ojoo JC, Mulrennan SA, Kastelik JA, Morice AH, Redington AE. Exhaled breath 417
condensate pH and exhaled nitric oxide in allergic asthma and in cystic fibrosis. Thorax 418
15. Rihák V, Zatloukal P, Chládková J, Zimulová A, Havlínová Z, Chládek J. Nitrite in 420
exhaled breath condensate as a marker of nitrossative stress in the airways of patients 421
with asthma, COPD, and idiopathic pulmonary fibrosis. J Clin Lab Anal 2010; 24: 422
317–322. 423
16. Robroeks CMHHT, Van de Kant KDG, Jöbsis Q, Hendriks HJE, Van Gent R, Wouters 424
EFM, et al. Exhaled nitric oxide and biomarkers in exhaled breath condensate indicate 425
the presence, severity and control of childhood asthma. Clin Exp All 2007 ; 37: 1303– 426
1311. 427
17. Ueno T, Kataoka M, Hirano A, Iio K, Tanimoto Y, Kanehiro A, et al. Inflammatory 428
markers in exhaled breath condensate from patients with asthma. Respirology 2008; 13: 429
654–663. 430
18. Bouzigon E, Monier F, Boussaha M. Associations between Nitric Oxide Synthase 431
Genes and Exhaled NO-Related Phenotypes according to Asthma Status. PloS ONE 432
2012; 7: e36672. 433
19. Villanueva C, Giulivi C. Subcellular and cellular locations of nitric oxide synthase 434
isoforms as determinants of health and disease. Free Radic Biol Med 2010; 49: 307– 435
316. 436
20. Egea Web Page [Internet]. Available from: https://egeanet.vjf.inserm.fr/ 437
21. Kauffmann F, Dizier MH. EGEA (Epidemiological study on the Genetics and 438
Environment of Asthma, bronchial hyperresponsiveness and atopy)--design issues. 439
EGEA Co-operative Group. Clin Exp All 1995 ; 25 Suppl 2: 19–22. 440
22. Kauffmann F, Dizier MH, Pin I, Paty E, Gormand F, Vervloet D, et al. 441
Epidemiological study of the genetics and environment of asthma, bronchial 442
hyperresponsiveness, and atopy: phenotype issues. Am J Respir Crit Care Med 1997; 443
156: S123–S129. 444
23. Nadif R, Matran R, Maccario J, Bechet M, Le Moual N, Scheinmann P, et al. Passive 445
and active smoking and exhaled nitric oxide levels according to asthma and atopy in 446
adults. Ann Allergy Asthma Immunol 2010; 104: 385-393. Erratum in: Ann Allergy 447
Asthma Immunol 2010; 105: 97-98. 448
24. Rava M, Varraso R, Decoster B, Huyvaert H, Le Moual N, Jacquemin B, et al. Plasma 449
and exhaled breath condensate nitrite-nitrate level in relation to environmental 450
exposures in adults in the EGEA study. Nitric Oxide 2012; 27: 169–175. 451
25. Lundberg JO, Weitzberg E. NO-synthase independent NO generation in mammals. 452
Biochem Biophys Res Commun 2010; 396: 39–45. 453
26. Hunt J. Exhaled breath condensate: an overview. Immunol Allergy Clin North 2007; 454
27: 587–596. 455
27. Fitzpatrick AM, Brown LAS, Holguin F, Teague WG. Levels of nitric oxide oxidation 456
products are increased in the epithelial lining fluid of children with persistent asthma. J 457
Allergy Clin Immunol 2009; 124: 990–996. 458
28. Gessner C, Wirtz H. Interleukins and other proteins. Eur Respir Mon 2010; 49: 217-30. 459
29. Nadif R, Decoster B, Huyvaert H, Briand G, Le Moual N, Pin I, et al. Total 460
Nitrate/Nitrite Levels In Plasma And Exhaled Breath Condensate: Associations With 461
Age And Smoking According To Asthma Among 1159 Adults From The EGEA Study. 462
Am J Respir Crit Care Med 2010; 181:A3109. 463
30. Condensate B. ATS Workshop Proceedings: Exhaled nitric oxide and nitric oxide 464
oxidative metabolism in exhaled breath condensate: Executive summary. Am J Respir 465
Crit Care Med 2006; 173: 811–813. 466
31 Nadif R, Zerimech F, Bouzigon E, Matran R. The role of eosinophils and basophils in 467
allergic diseases considering genetic findings. Curr Opin Allergy Clin Immunol 2013; 468
13: 507-513. 469
32. Diamant Z, Boot JD, Mantzouranis E, Flohr R, Sterk PJ, Gerth van Wijk R. 470
Biomarkers in asthma and allergic rhinitis. Pulm Pharmacol Ther 2010; 23: 468–481. 471
33. Sugiura H, Ichinose M. Nitrative stress in inflammatory lung diseases. Nitric Oxide 472
2011; 25: 138–144. 473
34. Blanchard C, Rothenberg ME. Biology of the eosinophil. Adv Immunol 2009; 101: 81– 474
121. 475
35. Del Pozo V, De Arruda-Chaves E, De Andrés B, Cárdaba B, López-Farré A, Gallardo 476
S, et al. Eosinophils transcribe and translate messenger RNA for inducible nitric oxide 477
synthase. J Immunol 1997; 158: 859–864. 478
36. Iijima H, Duguet A, Eum SY, Hamid Q, Eidelman DH. Nitric oxide and protein 479
nitration are eosinophil dependent in allergen-challenged mice. Am J Respir Crit Care 480
Med 2001; 163: 1233–1240. 481
37. Erzurum SC, Gaston BM. Biomarkers in asthma: a real hope to better manage asthma. 482
Clin Chest Med 2012; 33: 459-471. 483
484 485
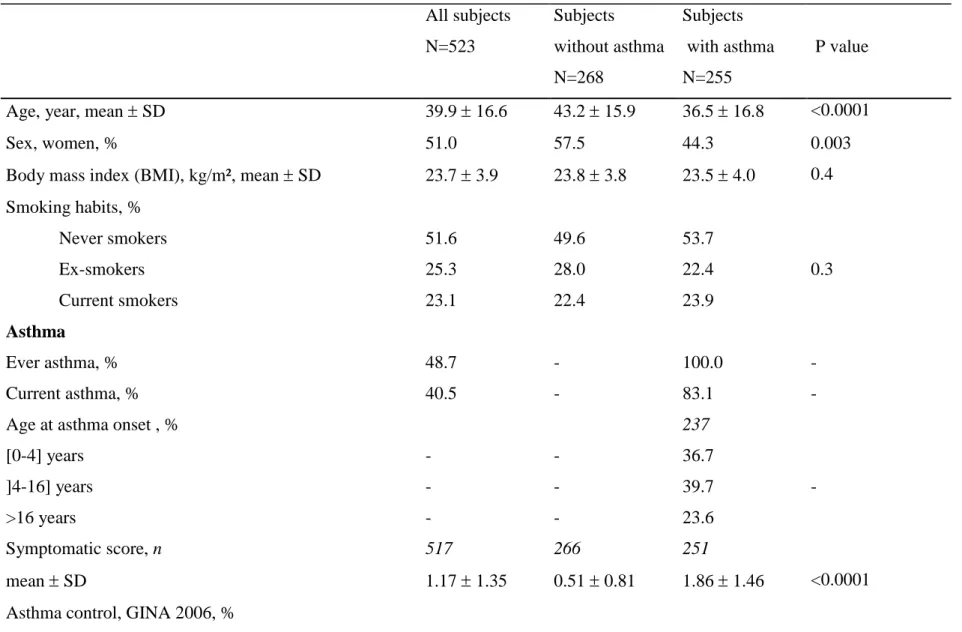
Table 1. Characteristics of subjects according to asthma status All subjects N=523 Subjects without asthma N=268 Subjects with asthma N=255 P value
Age, year, mean SD 39.9 16.6 43.2 15.9 36.5 16.8 <0.0001
Sex, women, % 51.0 57.5 44.3 0.003
Body mass index (BMI), kg/m², mean SD 23.7 3.9 23.8 3.8 23.5 4.0 0.4 Smoking habits, % Never smokers Ex-smokers Current smokers 51.6 25.3 23.1 49.6 28.0 22.4 53.7 22.4 23.9 0.3 Asthma Ever asthma, % 48.7 - 100.0 - Current asthma, % 40.5 - 83.1 -
Age at asthma onset , % [0-4] years ]4-16] years >16 years - - - - - - 237 36.7 39.7 23.6 - Symptomatic score, n mean SD 517 1.17 1.35 266 0.51 0.81 251 1.86 1.46 <0.0001 Asthma control, GINA 2006, %
Controlled Partly controlled uncontrolled 20.6 10.7 8.2 - 42.3 22.0 16.9 - Eosinophilia (cells>5%), % 12.4 6.7 18.4 <0.0001
Eosinophilic asthma (≥250 cells/mm²), % - - 36.5 -
FEV1 % predicted, mean SD 103.4 17.2 108.5 16.6 98.0 17.5 <0.0001
Methacholine test*, PD20≤4 mg, % 45.4 28.8 65.1 <0.0001
Inhaled corticosteroids, last 12 months, % 20.6 2.2 40.0 <0.0001
Inhaled corticosteroids, last 3 months, % 7.3 0.0 14.9 -
SPT+ and current rhinitis
SPT+, % 58.1 38.8 78.4 <0.0001
SPTQ, number of SPT+, median [Q1-Q3] 1 [0-3] 0 [0-1] 2 [1-4] <0.0001
Current rhinitis, % 39.2 22.3 56.9 <0.0001
SPT+ and Current rhinitis, % 32.9 18.0 48.6 <0.0001
Biological phenotypes, GM [Q1-Q3]
EBC NO2−/NO3−, µmol/mg proteins 2.25 [1.12-4.98] 2.33 [1.15-4.81] 2.16 [1.13-5.11] 0.5 FeNO, ppb 15.1 [10.0-23.0] 13.2 [9.00-18.8] 17.5 [11.5-29.6] <0.0001 EBC (NO2− + NO3−)/NO ratio , median [Q1-Q3] 0.30 [0.04-0.60] 0.34 [0.06-0.61] 0.26 [0.04-0.58] 0.16
Plasma NO2−/NO3−, µM 510 39.1 [28.0-53.7] 263 38.9 [26.3-56.4] 247 39.3 [29.1-53.2] 0.8
cells/mm3 170 [100-280] 145 [100-200] 199 [100-300] <0.0001 IgE, IU/ml 81.7 [28.8-226] 49.8 [19.4-128] 137 [59.0-332] <0.0001 SPT+: a mean wheal diameter 3mm than the negative control for at least one of 12 aeroallergens.
The symptomatic score is based on the number of asthma symptoms (wheeze and breathlessness, woken with chest tightness, woken by attack of shortness of breath, attack of shortness of breath at rest, attack of shortness of breath after exercise).
Table 2. Pair-wise association of EBC NO2-NO3 , FeNO levels and eosinophil count in all subjects, and according to allergic sensitization
EBC NO2 −
/NO3 −
level, µmol/mg proteins a FeNO level, ppb b
N Estimate SD p-value N Estimate SD p-value
All subjects Eosinophils, cells/mm3 492 0.14 0.09 0.10 505 0.25 0.04 <0.0001 FeNO level, ppb 510 0.14 0.08 0.10 Non-sensitized subjects Eosinophils, cells/mm3 204 0.15 0.13 0.3 208 0.15 0.05 0.01 FeNO level, ppb 215 -0.17 0.15 0.3 Sensitized subjects Eosinophils, cells/mm3 288 0.15 0.11 0.2 297 0.31 0.06 <0.0001 FeNO level, ppb 295 0.21 0.10 0.04
Estimates are adjusted for a: age, sex, smoking, ambient ozone concentration, asthma and centre; b: age, sex, smoking, height, asthma and centre (GEE linear regression methods).
Table 3. Associations between FeNO, total NO2−/NO3− and ratio levels in exhaled breath condensate with eosinophilic asthma and age at onset EBC NO2 − /NO3 − level, µmol/mg proteins a FeNO level, ppb b (NO2 − + NO3−)/NO ratio level c
N GM 95%CI p-value N GM 95%CI p-value N mean 95%CI p-value
Eosinophilic asthma, No Yes 162 93 1.97 2.54 1.61;2.41 1.98;3.26 0.12 162 93 15.4 22.0 13.7;17.2 19.0;25.5 0.0002 162 93 0.25 0.30 0.16;0.34 0.22;0.39 0.4 Age at onset, [0-4] years
]4-16] years >16 years 87 94 56 2.49 2.09 1.99 1.93;3.21 1.60;2.75 1.38;2.87 0.3 d 87 94 56 17.7 17.8 16.8 15.1;20.6 15.3;20.7 13.6;20.8 0.7 d 87 94 56 0.33 0.25 0.26 0.22;0.43 0.14;0.35 0.11;0.41 0.4 d
Model adjusted for all covariates
Eosinophilic asthma, No Yes 157 92 1.79 2.30 1.35;2.37 1.66;3.18 0.13 162 93 16.8 23.9 14.6;19.4 20.2;28.3 <0.0001 162 93 0.20 0.27 0.09;0.32 0.14;0.40 0.3 Age at onset, [0-4] years
]4-16] years >16 years 84 93 56 2.26 1.91 1.59 1.60;3.20 1.37;2.67 1.02;2.00 0.15 d 87 94 56 18.8 19.4 18.4 15.6;22.6 16.3;23.1 14.6;23.3 0.9 d 87 94 56 0.30 0.21 0.17 0.17;0.43 0.08;0.34 0.01;0.34 0.15 d
Results are expressed as GM or mean (and 95%CI).
Abbreviations: GM: geometric mean; CI: Confidence Interval; EBC: Exhaled Breath Condensate; NO2−/NO3−: nitrite/nitrate. a
: adjusted for age, sex, smoking, ambient ozone concentration, asthma and centre; b: adjusted for age, sex, smoking, height, asthma and centre (GEE regression methods); c: adjusted for age, sex, smoking, asthma and centre; d: p-value for trend.
Table 4. Associations between FeNO, total NO2−/NO3− and ratio levels in exhaled breath condensate with allergic sensitization EBC NO2 − /NO3 − level, µmol/mg proteins a FeNO level, ppb b (NO2 − + NO3−)/NO ratio level c
N GM 95%CI p-value N GM 95%CI p-value N mean 95%CI p-value
Allergic sensitization, No Yes 219 304 2.03 2.41 1.73;2.38 2.11;2.76 0.10 219 304 12.6 17.3 11.6;13.6 15.9;18.8 <0.0001 219 304 0.29 0.31 11.6;13.6 15.9;18.8 0.7 Current rhinitis No Yes 312 205 2.20 2.30 1.93;2.51 1.94;2.72 0.7 312 205 13.8 17.7 12.8;14.8 16.1;19.6 <0.0001 312 205 0.30 0.29 0.25;0.36 0.22;0.36 0.8 SPT+ and Current rhinitis,
No SPT+ Both 219 131 172 2.03 2.34 2.47 1.73;2.38 1.90;2.89 2.07;2.94 0.10 d 219 131 172 12.6 15.9 18.4 11.6;13.6 14.0;18.0 16.5;20.5 <0.0001 d 219 131 172 0.29 0.29 0.32 0.22;0.36 0.21;0.38 0.25;0.39 0.6 d
Model adjusted for centre only
Allergic sensitization, No Yes Current rhinitis No Yes 219 304 312 205 1.87 2.26 1.97 2.26 1.55; 2.26 1.92; 2.66 1.66;2.33 1.87;2.72 0.06 0.19 219 304 312 205 14.2 19.4 15.2 20.1 12.8; 15.7 17.7; 21.1 13.9;16.7 18.2;22.2 <0.0001 <0.0001 219 304 312 205 0.25 0.27 0.25 0.27 0.17;0.33 0.20;0.34 0.18;0.32 0.19;0.35 0.6 0.7 SPT+ and Current rhinitis,
No SPT+ 219 131 172 1.87 2.12 2.37 1.55;2.26 1.70;2.64 1.94;2.89 0.04 d 219 131 172 14.2 17.5 20.7 12.8;15.7 15.6;19.8 18.6;23.0 <0.0001 d 219 131 172 0.25 0.24 0.29 0.17;0.33 0.15;0.34 0.20;0.37 0.4 d
Model adjusted for all covariates Allergic sensitization, No Yes 215 295 1.72 2.36 1.38; 2.14 1.96; 2.84 0.008 219 304 14.8 18.3 13.3; 16.5 16.7; 20.0 0.0006 219 304 0.21 0.29 0.13;0.30 0.22;0.36 0.10 Current rhinitis No Yes 305 199 1.90 2.31 1.57;2.31 1.87;2.84 0.09 312 205 15.4 19.2 14.0;16.9 17.4;21.2 0.0001 312 205 0.24 0.28 0.16;0.31 0.20;0.36 0.3 SPT+ and Current rhinitis,
No SPT+ Both 215 128 166 1.71 2.17 2.50 1.37;2.13 1.70;2.76 2.01;3.12 0.005 d 219 131 172 14.8 16.4 19.7 13.3;16.5 14.6;18.4 17.7;21.9 <0.0001 d 219 131 172 0.21 0.26 0.32 0.12;0.29 0.17;0.36 0.23;0.40 0.06 d
Allergic sensitization (Indoor only) No Yes 215 76 1.66 2.03 1.28; 2.16 1.47; 2.81 0.2 219 80 14.2 17.1 12.7; 15.9 14.8; 19.7 0.02 219 80 0.21 0.26 0.10;0.31 0.13;0.40 0.4 Allergic sensitization (Outdoor only)
No Yes 215 45 1.66 1.78 1.28; 2.15 1.21; 2.62 0.7 219 46 14.6 17.2 13.2; 16.3 14.6; 20.2 0.06 219 46 0.20 0.20 0.09;0.31 0.03;0.36 0.9 Allergic sensitization (Molds only)
No Yes 217 7 1.58 3.96 1.20; 2.06 1.69; 9.29 0.04 219 7 14.5 21.2 13.0; 16.2 14.6; 30.6 0.06 219 7 0.18 0.49 0.07;0.30 0.11;0.87 0.12 Results are expressed as GM or mean (and 95%CI).
Abbreviations: GM: geometric mean; CI: Confidence Interval; EBC: Exhaled Breath Condensate; NO2 −
/NO3 −
: nitrite/nitrate. a
: adjusted for age, sex, smoking, ambient ozone concentration, asthma and centre; b: adjusted for age, sex, smoking, height, asthma and centre (GEE regression methods); c: adjusted for age, sex, smoking, asthma and centre; d: p value for trend.