A CRISPR-based assay for the detection of
opportunistic infections post-transplantation
and for the monitoring of transplant rejection
The MIT Faculty has made this article openly available.
Please share
how this access benefits you. Your story matters.
Citation
Kaminski, Michael M. et al. "A CRISPR-based assay for the detection
of opportunistic infections post-transplantation and for the
monitoring of transplant rejection." Nature Biomedical Engineering
4, 6 (April 2020): 601–609 © 2020 The Author(s)
As Published
http://dx.doi.org/10.1038/s41551-020-0546-5
Publisher
Springer Science and Business Media LLC
Version
Author's final manuscript
Citable link
https://hdl.handle.net/1721.1/125918
Terms of Use
Creative Commons Attribution-Noncommercial-Share Alike
Detailed Terms
http://creativecommons.org/licenses/by-nc-sa/4.0/
A CRISPR-based assay for the detection of opportunistic infections post-transplantation and for
1
the monitoring of transplant rejection
2 3
Michael M. Kaminski1,2,3, Miguel A. Alcantar1, Isadora Lape4, Robert Greensmith2,3, Allison C.
4
Huske1, Jacqueline A. Valeri1,9, Francisco M. Marty5, Verena Klämbt6, Jamil Azzi4, Enver
5
Akalin7, Leonardo V. Riella4*, and James J. Collins1,8,9*
6 7 8
Abstract
9
In organ transplantation, infection and rejection are major causes of graft loss linked by
10
the net state of immunosuppression. To diagnose and treat these conditions earlier, and
11
to improve long-term patient outcomes, refined strategies for the monitoring of patients
12
after graft transplantation are needed. Here, we show that a fast and inexpensive assay
13
based on CRISPR-Cas13 accurately detects BK polyomavirus DNA and cytomegalovirus
14
DNA from patient-derived blood and urine samples, as well as CXCL9 mRNA (a marker of
15
graft rejection) at elevated levels in urine samples from patients experiencing acute
16
renal-transplant rejection. The assay, which we adapted for lateral-flow readout, enables
17
via simple visualization the post-transplantation monitoring of common opportunistic
18
viral infections and of graft rejection, and should facilitate point-of-care
post-19
transplantation monitoring.
20 21 22
1Institute for Medical Engineering and Science and Department of Biological Engineering, Massachusetts Institute of Technology, 23
Cambridge, MA 02139, USA. 2Berlin Institute for Medical Systems Biology, Max Delbrück Center for Molecular Medicine in the 24
Helmholtz Association, 10115 Berlin, Germany. 3Department of Nephrology and Medical Intensive Care, Charité - 25
Universitätsmedizin Berlin, 10117 Berlin, Germany. 4Schuster Transplantation Research Center, Brigham & Women's Hospital, 26
Harvard Medical School, Boston, MA 02115, USA. 5Division of Infectious Diseases, Brigham and Women's Hospital, Boston, MA 27
02115, USA. 6Department of Medicine, Boston Children's Hospital, Harvard Medical School, Boston, MA 02115, USA. 7Montefiore 28
Einstein Center for Transplantation, Montefiore Medical Center, Albert Einstein College of Medicine, Bronx, New York 10467, USA.
29
8Infectious Disease and Microbiome Program, Broad Institute of MIT and Harvard, Cambridge, MA 02142, USA. 9Wyss Institute for 30
Biologically Inspired Engineering, Harvard University, Boston, MA 02115, USA. *corresponding authors, e-mail: jimjc@mit.edu,
31 lriella@bwh.harvard.edu 32 33 Main 34
The clustered regularly interspaced short palindromic repeats (CRISPR) and CRISPR-35
associated (Cas) immune system has recently been adapted for the detection of nucleic acids1–
36
8. These protocols enable rapid, cost-effective DNA and RNA detection in a variety of sample
types with excellent sensitivity and specificity, making them ideal tools for point-of-care (POC) 38
testing. However, most studies to date have used synthetic standards, include few clinical 39
specimens, and lack direct comparison to clinical gold standard diagnostics. 40
Here, we applied and optimized the CRISPR-Cas13 SHERLOCK (specific high-sensitivity 41
enzymatic reporter unlocking) technology for diagnosis of biomarkers highly relevant for renal 42
transplant patients. 43
44
Since the first successful kidney transplantation in 1954, significant improvements in short-term 45
outcomes have been achieved in organ transplantation. However, there has been less progress 46
in long-term outcomes with more than half of the transplanted organs being lost after 10 47
years9,10. Opportunistic infections and transplant organ rejection are leading causes of graft loss,
48
requiring careful adjustment of immunosuppression and life-long monitoring of post-transplant 49
patients11.
50 51
Current diagnostics, however, involve the use of expensive laboratory equipment and intricate 52
multi-step protocols leading to limited availability, high costs and slow turn-around time12,13.
53
Diagnosis of infections by PCR can take several days in clinical settings, and rejection 54
diagnostics require invasive biopsies and histopathological analysis. These factors result in 55
delays in pertinent diagnoses and increase the risk of irreversible allograft injury, especially in 56
resource-limited settings. POC or at-home testing could significantly reduce associated costs 57
and allow for more frequent monitoring, which would lead to earlier diagnosis and treatment of 58
graft dysfunction and common infections. 59
60
In this study, we developed CRISPR-based diagnostic tools for cytomegalovirus (CMV) and BK 61
polyomavirus (BKV) infection, two common opportunistic viruses highly relevant for renal 62
transplant patients14 and other immunocompromised patients15,16. Testing of more than 100
63
clinical specimens from BKV and CMV infected patients over a wide range of virus loads 64
revealed high diagnostic accuracy. We further extended the capability of SHERLOCK to the 65
detection of human CXCL9 mRNA, a biomarker indicative of rejection in renal transplant 66
patients17–19. We anticipate that CRISPR-Cas13-based technologies will be broadly applicable
67
for personalized medicine diagnostics, where repeated testing of biomarkers indicative of 68
disease activity is key to early and effective secondary prevention. 69
70 71
Results
72
Optimization of the CRISPR-Cas13 SHERLOCK technology for the detection of BKV and
73
CMV virus from patient samples
74
To test for active BKV and CMV infection, we isolated DNA from blood and urine of both 75
infected patients and uninfected control patients (Fig. 1a). Subsequently, we applied a modified 76
version of the SHERLOCK protocol for BKV and CMV detection.In brief, conserved regions of 77
BKV and CMV were amplified using isothermal recombinase polymerase amplification (RPA). 78
Incorporation of the T7 promoter sequence into forward primers allowed for subsequent in-vitro 79
RNA transcription using T7 polymerase. A CRISPR guide RNA (crRNA) complimentary to 28 80
nucleotides of the RPA product was used to direct Cas13 from Leptotrichia wadei (LwaCas13a) 81
to the target sequence. Detection of the target resulted in Cas13 activation and subsequent 82
collateral cleavage of an oligonucleotide carrying a quenched fluorophore, whose fluorescence 83
can be measured upon cleavage and correlates with the initial target concentration present in 84
the patient sample1.
85 86
To identify conserved regions in the BKV genome, we aligned all strains accessible from the 87
National Center for Biotechnology Information (
NCBI) and focused on target regions with 88sequence homology of more than 95% among all strains (Fig. 1b). Next, we tested 12 different 89
primer pairs and 3 crRNAs for detection of the BKV genes STA, VP2 and VP3 (Supplementary 90
Fig.1a). We identified a crRNA-primer pair specific for the small T antigen (STA), which allowed 91
detection of the
American Type Culture Collection (
ATCC) quantitative synthetic BKV standard 92(Dunlop strain) down to the low atto-molar range (0.3 aM), representing single-molecule 93
detection in the assay volumes used (Figs. 1c,d). Importantly, systematic assessment of various 94
forward and reverse primer concentrations (Supplementary Fig.1b) revealed a 120/480nM 95
forward/reverse RPA primer concentration to be most sensitive. Using a similar strategy, we 96
identified a conserved region in the CMV UL54 gene (Fig. 1e) as a potential SHERLOCK target 97
which enabled detection of the ATCC diagnostic CMV standard (strain AD-169) down to the low 98
atto-molar range (0.6 aM) (Figs. 1f,g). 99
100
Next, we tested if the diagnostic performance of the SHERLOCK assay would be sufficient to 101
detect BKV and CMV virus in urine and plasma samples from patients. Testing of 31 urine and 102
36 plasma samples showed that the optimized SHERLOCK protocol correctly identified all BKV 103
specimens with 100% sensitivity and specificity (Figs 2a,b, Supplementary Fig.2a). Importantly, 104
this performance could be achieved using the rapid and simple HUDSON (heating unextracted 105
diagnostic samples to obliterate nucleases) protocol2, which involves heating of the sample for
106
10 min at 95°C in the presence of TCEP and EDTA, circumventing the need for time-107
consuming, column-based sample preparations (Supplementary Figs. 2b,c). 108
109
Similarly, the CRISPR assay allowed for detection of CMV positive plasma samples with high 110
sensitivity and specificity (Figs. 2c,d, Supplementary Figs.2b,c). In contrast to our BKV results, 111
this performance could only be achieved using a commercial column-based viral DNA isolation 112
kit, whereas the HUDSON protocol resulted in lower sensitivity for low copy number samples (< 113
1500 IU/mL). Likely, this difference in sensitivity is due to a sample concentration step included 114
in the column-based kit. 115
116
CRISPR-based detection of CXCL9 mRNA as a biomarker of kidney graft rejection
117
Next, we tested whether SHERLOCK could be applied to detect mRNA biomarkers indicative of 118
kidney graft rejection. We selected CXCL9 mRNA as a marker of rejection based on its 119
validation in multicenter studies17,18,20.
120 121
For detection of CXCL9 mRNA, we isolated RNA from pelleted urine cells (Fig. 3a). For 122
amplification, we included a reverse transcriptase into the RPA reaction (rtRPA). Using a 123
synthetic RNA standard, Cas13 alone was sufficient to detect CXCL9 in the low pico-molar 124
range similar to the previously reported sensitivity (Fig. 3b). Addition of a rtRPA reaction 125
followed by T7 transcription and Cas13 activation enabled CXCL9 detection in the atto-molar 126
range (Fig. 3b). 127
128
We next assessed whether this sensitivity was sufficient to discriminate patients undergoing 129
kidney rejection (n=14) from a control group (n=17) (Supplementary Table 1). Importantly, 130
rejection status was determined by gold standard kidney biopsy (Supplementary Table 2). 131
We observed higher CXCL9 mRNA levels in samples from patients with biopsy-proven rejection 132
compared to transplant patients with no rejection or stable graft function, which allowed for the 133
detection of kidney rejection with a sensitivity of 93% (Figs. 3c,d). The area under the receiver-134
operating-characteristic (ROC) curve (AUC) was 0.91 (Fig. 3e). 135
136
We confirmed CXCL9 mRNA upregulation in rejection samples with the qPCR gold-standard 137
assay18 observing higher diagnostic accuracy relative to the CRISPR-based assay
138
(Supplementary Figs. 3a,b,c). Detection of CXCL9 protein with an
enzyme-linked
139immunosorbent assay (
ELISA) showed lower sensitivity but higher specificity (Supplementary 140Figs. 3d,e,f) as compared to CRISPR-based mRNA detection. 141
142
Rapid DNA isolation, CRISPR diagnostics and smartphone-based lateral-flow evaluation
143
allow POC-ready detection of BKV and CMV infection
144
Point-of-care testing (POCT) holds great promise for transplantation medicine since fast and 145
low-cost diagnostics could enable earlier treatment decisions and broader accessibility, thereby 146
lowering the risk of irreversible transplant injury. To optimize BKV and CMV detection for POCT, 147
we combined the rapid HUDSON DNA isolation protocol with SHERLOCK-based target 148
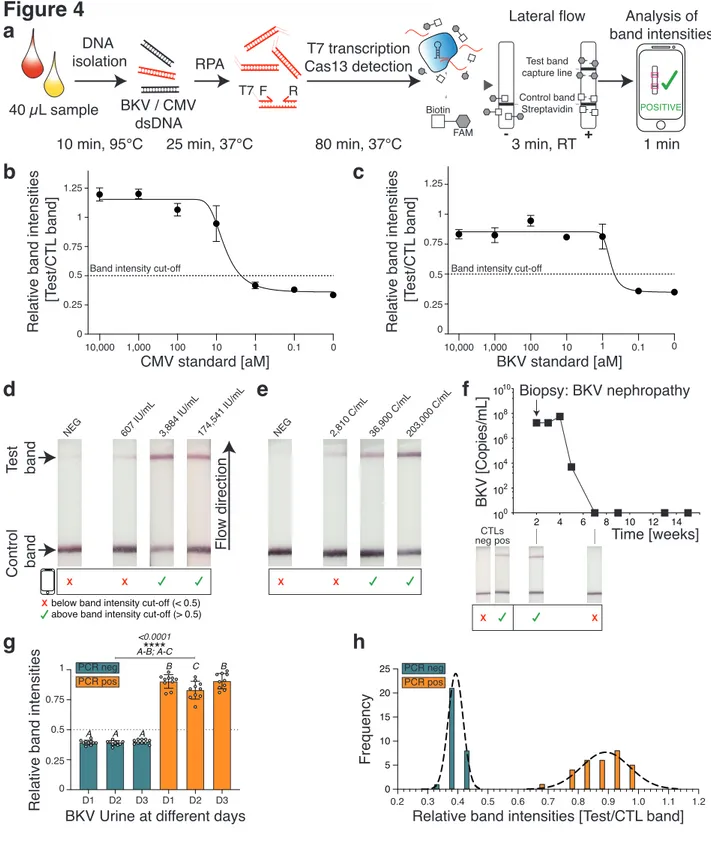
detection and commercially available lateral-flow dipsticks (Fig. 4a). This method enabled an 149
easy-to-read visual output that indicated a positive or negative test result. Since we observed 150
that background noise can result in a faint test band on the lateral flow strip, we developed a 151
smartphone-based software application that allowed quantification of band intensities 152
(Supplementary video 1). Here, the software calculates the ratio of test to control band 153
intensities using images taken with a smartphone camera, enabling simple and rapid 154
discrimination between negative and positive test results. The total turn-around time from 155
isolation to sample detection was below 2 hours. 156
157
We next tested the lateral-flow read-out for the detection of the CMV and BKV synthetic 158
standard (Figs. 4b,c). Similar to our fluorescence-based read-out, we could detect both targets 159
down to the atto-molar range. We set the relative band intensity cut-off discriminating a positive 160
from a negative test result to 0.5, which corresponded to an interpolated concentration of 2.3 aM 161
for the CMV standard and 0.5 aM for the BKV standard. 162
163
Using this protocol, we were able to detect CMV (Fig. 4d) and BKV (Fig. 4e) at different 164
concentrations in patient samples. Although faint test bands were observable at very low 165
concentrations, they were below the band intensity cut-off and thus classified as negative. 166
Further, lateral flow-based CRISPR diagnostics successfully identified BKV infection in a 58-167
year-old male kidney transplant patient who was admitted for graft dysfunction. A kidney biopsy 168
demonstrated BKV nephropathy and qPCR confirmed high viral BKV titers in the blood. 169
After treatment, we could not detect BKV using CRISPR-Cas13 which was confirmed by the 170
absence of viral DNA in qPCR (Fig. 4f). 171
To assess lateral-flow signal variability over time, we tested the same ten BKV positive or 173
negative patient samples on three different days (Figs. 4g,h). We observed that all BKV 174
negative samples were consistently below the band intensity cut-off on the three different days, 175
whereas all BKV positive samples were above. This suggested a low variability of background 176
noise and band intensities. 177
178
We also assessed the influence of incubation time and temperature on lateral-flow band 179
intensity for two different concentrations of the CMV synthetic standard. For the negative 180
control, the relative band intensity stayed below the 0.5 cut-off regardless of the incubation time, 181
similar to our previous results (Supplementary Figs. 4a,b). When detecting 5 or 500 aM of CMV 182
synthetic DNA, we observed a time-dependent increase of band intensities. Importantly, we 183
could observe band intensity values above the cut-off only after 60 min, indicating that our 184
assay incubation time could be further shortened. For different reaction temperatures ranging 185
from 21°C to 39°C, we again observed band intensity ratios below 0.5 for the negative control 186
(Supplementary Figs. 4c,d). While room temperature (21°C) was sufficient to detect 5 and 500 187
aM of CMV synthetic standard, higher temperatures correlated with higher band intensities. 188
These results indicate that reaction time and temperature are important variables if a 189
quantitative lateral flow read-out is the goal. In contrast, highly consistent background noise 190
irrespective of daily variation, incubation time and temperature enables a robust qualitative 191
assay. 192
193
We further optimized the combination of RPA, T7 transcription and Cas13 in one reaction (“one-194
pot reaction”, Supplementary Fig. 5a) by testing different reaction buffers and nucleotide ratios 195
(Supplementary Figs. 5b-d). Using this optimized one-pot reaction, we achieved BKV detection 196
in the atto-molar range (Supplementary Fig. 5e). 197
198
Detection of CXCL9 mRNA levels with lateral-flow enables monitoring of kidney rejection
199
and treatment response
200
Next, we sought to apply the lateral-flow-based assay for the detection of CXCL9 mRNA 201
indicative of acute cellular kidney rejection. Similar to the detection of viral DNA, lateral flow 202
enabled robust detection of CXCL9 synthetic RNA (Fig. 5a) down to the atto-molar range. 203
Using nonlinear regression analysis, we determined that a concentration of 12 aM corresponded 204
to the 0.5 band intensity cut-off. 205
In order to explore the power of our CRISPR-based read-out for rejection monitoring, we 207
selected two patients experiencing allograft cellular rejection as confirmed by biopsy who had at 208
least three prospective samples after the rejection event (Figs. 5b,c). Patient 1 (Fig. 5b) 209
developed an acute cellular rejection (Banff IIA) and showed a good response to treatment with 210
thymoglobulin and pulse methylprednisolone, achieving full clinical recovery. This was reflected 211
by a strong downregulation of CXCL9 mRNA levels as observed in qPCR and return to his 212
baseline serum creatinine (0.9 mg/dL). CRISPR-based testing detected CXCL9 mRNA only 213
during rejection, while the patient was CXCL9 negative after treatment completion. 214
215
In contrast, Patient 2 (Fig. 5c) had an episode of acute cellular rejection Banff IIA with partial 216
improvement of creatinine after treatment (Serum creatinine 3.5 mg/dL down from 7.9). While 217
urine CXCL9 mRNA was reduced initially, it went back up 7 months afterwards, and repeat 218
biopsy revealed chronic active cellular rejection. Overall, monitoring of urine CXCL9 mRNA 219
levels may be a useful tool to assess response to rejection treatment, though further validation 220
in a larger trial is needed. 221
222
Discussion
223
Fast and cost-effective POCT should enable early diagnosis and greater accessibility for 224
patients in low-resource settings, including the opportunity for self-monitoring. Here, we applied 225
CRISPR-Cas13 diagnostics to detect CMV and BKV infection in samples of kidney transplant 226
patients. We extended the use of SHERLOCK for the detection of CXCL9 mRNA, a biomarker 227
of acute cellular rejection of kidney transplants. Together, these developments may enable the 228
cost-effective (Supplementary Table S3) monitoring of patients at risk for opportunistic infection 229
and serve as a tool for earlier detection of rejection and monitoring post-treatment in 230
transplantation. 231
232
BKV and CMV are among the most common opportunistic infections after solid-organ 233
transplantation, being associated with significant morbidity21. However, clinical presentation is
234
variable in transplanted patients and BKV infection frequently presents without clinical 235
symptoms except a creatinine rise, which indicates already established BK nephropathy. Blood 236
testing for BKV and CMV viral load is recommended but not uniformly performed in all centers 237
due to cost limitations, in particular in developing countries. Here, our high-sensitivity, low-cost 238
POC assay could allow for more frequent testing. 239
Rejection is the leading cause of chronic allograft loss. However, rejection is usually detected 241
late since serum creatinine is a delayed marker of allograft injury. Furthermore, the diagnosis of 242
acute rejection currently requires a renal biopsy - an invasive process that is limited by sampling 243
error and assessment variability22. In order to detect graft injury earlier, some centers perform
244
surveillance kidney biopsies at pre-specified time-points post-transplant23. However, these
245
procedures are associated with major risks for patients, such as bleeding, and significant costs 246
(~$3,500/biopsy, which includes the procedure and the pathological analyses of the kidney 247
specimen). Therefore, a sensitive and non-invasive assay such as CRISPR-Cas13-based 248
CXCL9 mRNA testing could allow for more frequent testing and thereby achieve earlier
249
detection of graft rejection, allowing timely diagnosis and treatment. 250
251
Here, we focused on cellular-mediated rejection, the most frequent rejection affecting
252
kidney transplant patients. Screening for donor-specific anti-HLA antibodies (DSA) is
253
currently performed in patients with concern for antibody-mediated rejection. All patients
254
included in our study had a negative test for DSA. Screening prospectively for DSA in
255
all patients is not uniformly performed in part due to lack of specificity of DSA to
256
antibody-mediated rejection
24,25.
257 258
Two novel blood tests that detect the fraction of donor-derived cell-free DNA have become 259
clinically available in kidney transplantation to monitor for rejection26,27. While these assays have
260
shown promising results, they still require a visit to the clinic to draw blood, shipping of the 261
material to outside labs for processing and analysis, and they have a high price tag of US 262
$2,821 per test28. This high price limits the frequency of testing and also prevents the use of this
263
test in resource-limited settings. The advantages of our rejection assay are its low cost, its high 264
sensitivity and its use of urine compared to blood. Since CXCL9 mRNA elevation in the urine 265
can be detected weeks before elevation of creatinine due to rejection29, urine CXCL9 mRNA
266
monitoring may represent a promising technique for earlier rejection detection as well as post-267
treatment monitoring. Lastly, the development of a smartphone application to enable simple and 268
fast interpretation of the lateral-flow assay allows for sharing of results directly with the provider, 269
leading to a convenient way of monitoring patients between clinical appointments. 270
271
Our test was mainly aimed for the qualitative detection of CMV, BKV and CXCL9 at clinically 272
relevant concentrations. However, in many clinical situations, precise quantification of the viral 273
load and changes in biomarker levels are useful. Future iterations of this protocol should, 274
therefore, include quantitation strategies and may build on recent protocols demonstrating semi-275
quantitative read-outs of CRISPR diagnostics3. This would also strengthen the power of
276
CRISPR-based diagnostics, since it could allow for the detection of subtle changes as a 277
deviation from an individualized baseline. Moreover, although most steps could be optimized for 278
a POCT setting, sample isolation for the detection of mRNA still required a column-based 279
approach. Thus, further work will consist in optimizing the protocol for simplified mRNA isolation 280
procedures. In addition, heating represents an essential step in our current sample processing 281
protocol using HUDSON. Thus, the integration of POC heating devices using chemical30 or
282
electromagnetic31 heating might facilitate handling for the primary care provider or patient.
283
Finally, inclusion of more patient samples and prospective analysis will allow for systematic 284
comparison with current clinical practice. 285
286
In summary, this work demonstrates the application of CRISPR-Cas13 for the detection of 287
rejection and opportunistic infection in kidney transplantation. This technology could be easily 288
applied to other solid-organ transplants as well as immune-mediated kidney diseases such as 289
lupus nephritis. Based on its low-cost, ease of use and speed, this assay could allow frequent 290
testing and earlier diagnosis. The next steps in order to advance clinical implementation include 291
studies to validate these findings and to demonstrate the clinical utility of this assay in regard to 292
long-term outcomes of kidney transplant recipients. 293
294
Methods
295
Lateral flow reactions. 20µl of the Sherlock reaction containing the lateral flow reporter-oligo at
296
1µM (sequence in supplementary table 4) were mixed with 80µl of Hybridetect Assay buffer, 297
followed by insertion of lateral flow-sticks (Milenia Hybridetect1, TwistDx Limited, Maidenhead, 298
UK) and incubation for 3min at room temperature, according to the manufacturer’s instructions, 299
before images were taken. 300
Image analysis of lateral flow reactions. The relative band intensities of each of the
lateral-301
flow sticks were measured using ImageJ software (US National Institute of Health). The relative 302
band intensity was calculated as the test band’s mean grey value/control band’s mean grey 303
value. Images were first converted to 8-bit and inverted, before highlighting the band region and 304
measuring its mean grey value. 305
Lateral flow quantification app. The lateral flow quantification algorithm was implemented
306
using Python’s opencv package (v4.1.1). Briefly, images uploaded to the app are automatically 307
converted to grayscale and the colors are inverted. The resultant image is then subjected to a 308
Gaussian blur in order to remove outlier pixels that may result in artifactual bright-spots. 309
Afterward, a threshold is applied to accentuate bright spots. Connected component analysis is 310
then used to isolate regions corresponding to the control and sample bands. These bands are 311
then identified and quantified by calculating the mean intensity of each band. If the sample band 312
cannot be identified due to weak intensity, the sample band’s location is estimated by scanning 313
for bright areas in the upper portion of the lateral flow stick using the control band as a 314
perspective scale. The ratio of the sample to control band is then calculated and displayed to 315
the user. The Android app was developed with Android Studio v3.5.1 (Google, Mountain View, 316
CA) with Java 8 and Gradle v5.4.1 (Supplementary Video 1). To provide a clean user interface, 317
the main screen was limited to three buttons: (1) upload new pictures, (2) specify the target of 318
the assay (i.e., CMV, BKV, or CXCL9), and (3) initiate image analysis. The picture upload 319
process requests read permissions of the phone’s photo gallery. Image analysis allows for two 320
options, with the faster analysis scaling down the image to 50% lower resolution for more rapid 321
results. The pixel array is passed to a Python backend through Chaquopy v6.3.0, a Python SDK 322
for Android. 323
Sample preparation. Patient samples containing CMV or BKV were prepared as indicated,
324
either with the previously described HUDSON protocol2 or the QIAamp MinElute Virus Spin Kit
325
(Qiagen, Hilden, Germany), according to the manufacturer’s instructions. For HUDSON 326
processing, the samples were heated for 10min at 95°C in the presence of 100mM TCEP 327
(Fisher Scientific, USA) and 1mM EDTA (Fisher Scientific, USA). For CXCL9 mRNA detection, 328
45 ml urine was centrifuged for 30min at 2000g at 4°C, followed by washing of the pellet with 329
PBS and resuspension in 200µl RNAlater (Qiagen, Hilden, Germany). All samples were 330
aliquoted and stored at -80°C. RNA was isolated using the RNeasy Micro Kit (Qiagen, Hilden, 331
Germany) and the PureLink RNA Mini Kit (Invitrogen, USA), following the manufacturer’s 332
instructions. 333
Production of crRNAs and LwaCas13a. LwaCas13a was produced by Genscript (Piscataway,
334
USA). crRNAs were synthesized using the HiScribe™ T7 Quick High Yield RNA Synthesis Kit 335
(NEB, Ipswich, USA), according to the manufacturer’s instructions, with the T7 promoter 336
containing annealed oligonucleotides. Reactions were incubated for 16h at 37°C, DNAse (NEB) 337
digested and purified using the RNA Clean & Concentrator-25 kit (ZymoResearch, Irvine, USA). 338
RPA primer and crRNA design. Genetically conserved regions in the BKV and CMV genome
339
were identified using publicly accessible databases (Virus Pathogen Resource and NCBI). 340
Alignments were performed using MAFFT32 and visualized with Jalview33. RPA primer design
was done using NCBI’s PRIMER-BLAST tool with previously described settings3. CXCL9 RPA
342
primers were designed to be in proximity to previously published qPCR primers18. For each
343
region to be amplified, optimal primer pairs were identified by forward and reverse primer 344
screens. Primer concentrations were optimized by testing different forward and reverse primer 345
concentrations in a dilution matrix. crRNAs, 28 nucleotides complementary to the target region, 346
were designed as previously described1,3 and tested for their performance with each RPA
347
primer pair. The sequences, including spacer, direct repeat and T7 promoter, are indicated in 348
Supplementary Table 4. 349
qRT-PCR. RNA isolation, reverse transcription and qPCR were performed as previously
350
described18. Briefly, we reverse transcribed RNA using the TaqMan Reverse Transcription kit
351
(ThermoFisher, Waltham, USA) with random hexamers. The qPCR was performed using cDNA 352
without pre-amplification. qPCR reactions were set up as previously described18. All reactions
353
were performed in duplicate, using the Applied Biosystems StepOne Plus real-time PCR system 354
(ThermoFisher, Waltham, USA). In-vitro transcribed RNA for CXCL9 served as a standard 355
(sequences in Supplementary Table 4). For expression analysis, we employed the comparative 356
CT method34 for relative quantification to 18S RNA (Supplementary Figure 3a) or used absolute
357
quantification based on a CXCL9 standard curve (Figures 5b,c). Expression levels are 358
presented on a logarithmic scale relative to the control, whose average expression was set to 1. 359
RPA reactions. For RPA reactions, the TwistAmp Liquid Basic kit (TwistDx Limited,
360
Maidenhead, UK) was used according to the manufacturer’s instructions with the following 361
modifications. Primer concentrations were 120nM for the forward primer and 480nM for the 362
reverse primer. The total reaction volume was 20µl with a final concentration of dNTPs at 363
7.2mM (each) and MgOAc at 8mM. RPA reactions were incubated at 37°C for 50min. For rt-364
RPA reactions, forward and reverse primers were used at 480nM each and MgOAc at 14mM. 365
1µl GoScript reverse transcriptase (Promega) was added to a 20µl reaction containing DL-366
Dithiothreitol solution (DTT, Sigma-Aldrich) at a final concentration of 19mM. The primer-RNA 367
mix was pre-incubated at 65°C for 10min and the rt-RPA reaction was performed at 42°C for 368
60min. 369
Cas13 reactions. Detection of (rt)RPA amplified targets was performed as described
370
previously1–3 with minor modifications. NEB buffer 2 (NEB, Ipswich, USA) served as cleavage
371
buffer at a final concentration of 1X. 3µl of RPA or rtRPA product were used in a 20µl Cas13 372
reaction. Fluorescence (485nm excitation, 520nm emission) was measured on a plate reader 373
(SpectraMax M5, Molecular Devices, San Jose, USA) every 5min for up to 3h at 37°C. 374
One-pot reaction. One pot RPA-CRISPR reactions were performed with murine RNAse
375
Inhibitor (NEB) at 1U/µl, Cas13 at 45nM, crRNA at 22.5nM, RNAse Alert V2 (Thermofisher) at 376
125nM, human background RNA (from 293T cells) at 1.25ng/µl, T7 polymerase (Lucigen) at 377
0.6µl/20µl, dNTPs at 1.8mM (each), rNTPs at 0.5mM (each), MgOAc at 16mM and the buffers 378
of the RPA TwistAmp Liquid Basic kit (2X, 10X and 20X buffers) at 1X final concentrations. 379
Diagnostic BKV and CMV quantitative PCR. De-identified patient samples were provided by
380
the Crimson Core at Brigham and Women’s Hospital. Quantification of BKV and CMV viral load 381
were performed at the CLIA certified diagnostic core facility at Brigham and Women’s 382
Hospital. In brief, BKV viral load samples were processed using the Luminex Aries instrument 383
(Luminex, Austin, USA) and a laboratory-developed protocol for a probe-free, two-primer, real-384
time PCR system. Following amplification, a thermal melt was performed. The system software 385
allows for a quantitation template, developed using a standard curve calibrated against the 1st
386
WHO International Standard for BKV, to be applied to raw data for production of a quantitative 387
value, reported in copies/mL (C/mL). CMV viral load samples were processed using the Roche 388
Cobas AmpliPrep/Cobas TaqMan CMV Test (IVD) on the Roche-docked Cobas 389
AmpliPrep/TaqMan instrument. This is a real time PCR system that automates specimen 390
preparation, PCR amplification, target detection and quantitation. Results are reported in 391
International Units/mL (IU/mL). 392
Patient populations. For the CMV and BK studies, de-identified samples collected for clinical
393
testing for CMV and BK viremia at the Brigham and Women's Hospital (BWH) were provided by 394
the Crimson Core at BWH. Clinical reported results for CMV and BK viremia were then 395
compared to CRISPR/Cas13 diagnostics results. For the rejection and BK nephropathy 396
samples, patients were recruited prior to a kidney transplant biopsy to investigate an elevation 397
of creatinine at BWH. Prospective sample collection was also performed in few kidney 398
transplant recipients starting in January 2019 until June 2019. Samples started to be collected 399
after one month of transplantation to avoid the impact of surgery and ischemic time. Samples 400
were then collected according to clinical visits for 3-5 collections within the first year of 401
transplant. The kidney transplant cohort is representative of kidney transplant recipients in this 402
geographical location and at a tertiary academic hospital. 403
Study design and participants. The study was approved by the Institutional Review Board at
404
Brigham and Women’s Hospital (2017P000298), and the procedures followed were in 405
accordance with institutional guidelines. In this observational study, a total of 31 kidney 406
transplant patients were enrolled, and informed consent was obtained from all subjects 407
(Supplementary Tables 1,2). Urine samples were collected from patients undergoing kidney 408
biopsy for clinical indications. The cohort of samples was then selected based on the presence 409
of cellular rejection or no rejection on biopsy findings. For the prospective analyzes, samples 410
were provided by a cohort from Montefiore Medical Center, Bronx, NY (Montefiore/Einstein 411
Institutional Review Board (09-06-174). Briefly, longitudinal samples were collected at the 412
following time points: 0-3 months, 6-9 months and 9-12 months post-transplant or when clinical 413
biopsy was performed). Selection of patients was based on availability of at least three samples 414
collected either before or after rejection event that was classified as rejection Banff IA or higher. 415
Ethics statement. We have complied with all relevant ethical regulations. The patient samples
416
used in this study were obtained from the clinical study “Biomarkers in Kidney Transplantation” 417
which was approved by Partners Human Research Committee (2017P000298/PHS). We have 418
obtained written informed consent from all participants. 419
Data availability statement. The authors declare that the data supporting the findings of this
420
study are available within the paper and its supplementary information files. 421
Code availability statement. The lateral flow quantification app code is available at
422 https://github.com/jackievaleri/lateral_flow_quantification_app. 423 424 References 425
1. Gootenberg, J. S. et al. Nucleic acid detection with CRISPR-Cas13a/C2c2. Science (80-. ). 356,
426
438–442 (2017).
427
2. Myhrvold, C. et al. Field-deployable viral diagnostics using CRISPR-Cas13. Science (80-. ). 448,
428
444–448 (2018).
429
3. Gootenberg, J. S. et al. Multiplexed and portable nucleic acid detection platform with Cas13,
430
Cas12a, and Csm6. Science (80-. ). 0179, (2018).
431
4. Chen, J. S. et al. CRISPR-Cas12a target binding unleashes indiscriminate single-stranded DNase
432
activity. Science 360, 436–439 (2018).
433
5. Harrington, L. B. et al. Programmed DNA destruction by miniature CRISPR-Cas14 enzymes.
434
Science (80-. ). 362, 839 LP – 842 (2018).
435
6. Pardee, K. et al. Rapid, Low-Cost Detection of Zika Virus Using Programmable Biomolecular
436
Components. Cell 165, 1255–1266 (2016).
437
7. Hajian, R. et al. Detection of unamplified target genes via CRISPR–Cas9 immobilized on a
438
graphene field-effect transistor. Nat. Biomed. Eng. 3, (2019).
439
8. Wu, Y., Liu, S.-X., Wang, F. & Zeng, M.-S. Room Temperature Detection of Plasma Epstein–Barr
440
Virus DNA with CRISPR–Cas13. Clin. Chem. 65, 591 LP – 592 (2019).
441
9. Lamb, K. E., Lodhi, S. & Meier-Kriesche, H.-U. Long-Term Renal Allograft Survival in the United
442
States: A Critical Reappraisal. Am. J. Transplant. 11, 450–462 (2011).
443
10. Tullius, S. G. & Rabb, H. Improving the Supply and Quality of Deceased-Donor Organs for
Transplantation. N. Engl. J. Med. 378, 1920–1929 (2018).
445
11. Wekerle, T., Segev, D., Lechler, R. & Oberbauer, R. Strategies for long-term preservation of
446
kidney graft function. Lancet 389, 2152–2162 (2017).
447
12. Ross, S. A., Novak, Z., Pati, S. & Boppana, S. B. Overview of the diagnosis of cytomegalovirus
448
infection. Infect. Disord. Drug Targets 11, 466–474 (2011).
449
13. Randhawa, P. et al. Correlates of quantitative measurement of BK polyomavirus (BKV) DNA with
450
clinical course of BKV infection in renal transplant patients. J. Clin. Microbiol. 42, 1176–1180
451
(2004).
452
14. Fishman, J. A. Infection in Organ Transplantation. Am. J. Transplant. 17, 856–879 (2017).
453
15. Sepkowitz, K. A. Opportunistic Infections in Patients with and Patients without Acquired
454
Immunodeficiency Syndrome. Clin. Infect. Dis. 34, 1098–1107 (2002).
455
16. Sundsfjord, A. et al. BK and JC Viruses in Human Immunodeficiency Virus Type 1-Infected
456
Persons: Prevalence, Excretion, Viremia, and Viral Regulatory Regions. J. Infect. Dis. 169, 485–
457
490 (1994).
458
17. Jackson, J. A. et al. Urinary chemokines CXCL9 and CXCL10 are noninvasive markers of renal
459
allograft rejection and BK viral infection. Am. J. Transplant. 11, 2228–2234 (2011).
460
18. Hricik, D. E. et al. Multicenter validation of urinary CXCL9 as a risk-stratifying biomarker for kidney
461
transplant injury. Am. J. Transplant. (2013) doi:10.1111/ajt.12426.
462
19. Schaub, S. et al. Urinary CXCL9 and CXCL10 levels correlate with the extent of subclinical
463
tubulitis. Am. J. Transplant. 9, 1347–1353 (2009).
464
20. Rabant, M. et al. Early Low Urinary CXCL9 and CXCL10 Might Predict Immunological Quiescence
465
in Clinically and Histologically Stable Kidney Recipients. Am. J. Transplant. 16, 1868–1881 (2016).
466
21. Fishman, J. A. Infection in Solid-Organ Transplant Recipients. N. Engl. J. Med. 357, 2601–2614
467
(2007).
468
22. El-Zoghby, Z. M. et al. Identifying specific causes of kidney allograft loss. Am. J. Transplant 9,
469
527–535 (2009).
470
23. Henderson, L. K., Nankivell, B. J. & Chapman, J. R. Surveillance protocol kidney transplant
471
biopsies: their evolving role in clinical practice. Am. J. Transplant 11, 1570–1575 (2011).
472
24. Parajuli, S. et al. Donor-Specific Antibodies in the Absence of Rejection Are Not a Risk Factor for
473
Allograft Failure. Kidney Int. reports 4, 1057–1065 (2019).
474
25. Schinstock, C. A. et al. The Value of Protocol Biopsies to Identify Patients With De Novo
Donor-475
Specific Antibody at High Risk for Allograft Loss. Am. J. Transplant 17, 1574–1584 (2017).
476
26. Bloom, R. D. et al. Cell-Free DNA and Active Rejection in Kidney Allografts. J. Am. Soc. Nephrol.
477
28, 2221–2232 (2017).
478
27. Sigdel, T. K. et al. Optimizing Detection of Kidney Transplant Injury by Assessment of
Donor-479
Derived Cell-Free DNA via Massively Multiplex PCR. J. Clin. Med. 8, (2018).
480
28. UNITED STATES SECURITIES AND EXCHANGE COMMISSION.
https://www.sec.gov/Archives/edgar/data/1217234/000156459018006584/cdna-482
10k_20171231.htm.
483
29. Hricik, D. E. et al. Adverse Outcomes of Tacrolimus Withdrawal in Immune–Quiescent Kidney
484
Transplant Recipients. J. Am. Soc. Nephrol. 26, 3114–3122 (2015).
485
30. Curtis, K. A. et al. Isothermal Amplification Using a Chemical Heating Device for Point-of-Care
486
Detection of HIV-1. PLoS One 7, e31432 (2012).
487
31. Ahn, M.-H., Baek, S.-K., Min, J. & Park, J.-H. A portable electromagnetic induction heating device
488
for point-of-care diagnostics. BioChip J. 10, 208–214 (2016).
489
32. Katoh, K. & Standley, D. M. MAFFT multiple sequence alignment software version 7:
490
improvements in performance and usability. Mol. Biol. Evol. 30, 772–780 (2013).
491
33. Waterhouse, A. M., Procter, J. B., Martin, D. M. A., Clamp, M. & Barton, G. J. Jalview Version 2—
492
a multiple sequence alignment editor and analysis workbench. Bioinformatics 25, 1189–1191
493
(2009).
494
34. Schmittgen, T. D. & Livak, K. J. Analyzing real-time PCR data by the comparative CT method. Nat.
495 Protoc. 3, 1101 (2008). 496 497 Acknowledgments 498
We thank Rebecca Zaffini from viral microbiology (Brigham & Women’s Hospital) for helpful 499
discussion about BKV testing and qPCR. We thank the Crimson Core at Brigham & Women’s 500
Hospital for providing CMV and BKV patient samples. M.M.K was supported by the German 501
Academy of Sciences, Leopoldina (LPDS 2018-01) and the Clinician Scientist Program Berta-502
Ottenstein of the Faculty of Medicine, University of Freiburg, Germany. M.A.A was supported 503
by a National Science Foundation graduate research fellowship (1122374). V.K. was 504
supported by the DFG (403877094). J.J.C. was supported by MIT’s Center for Microbiome 505
Informatics and Therapeutics, the Paul G. Allen Frontiers Group, and the Wyss Institute. We 506
thank Helena de Puig, Nicolaas Angenent-Mari, Aaron Dy and Xiao Tan for helpful discussions. 507
508
Author contributions
509
M.M.K., L.V.R. and J.J.C. designed the study. M.M.K., M.A.A., A.C.H., I.L. and R.G. performed 510
experiments. J.V. and M.A.A. programmed the smartphone app, L.V.R. provided clinical 511
samples. All authors contributed to the writing of the manuscript and interpretation of data. 512
513
Competing interests
514
A patent application is pending. J.J.C is co-founder and director of Sherlock Biosciences. 515
Figure 1
a
Conservation [%] BKV small T Antigen F SP R 100 90 70 80 RFUs BKV standard [aM] ** ** *** ** * n.s. 1 0.05 CTL 0.5 5 50 500 5,000 10 100 1000 F SP R 0.05 CTL 0.5 5 50 500 5,000 RFUs CMV standard [aM] 1 10 100 1000 Conservation [%] CMV UL54 100 90 70 80b
c
d
e
** ** *** ** n.s. n.s.g
f
20 bp 20 bp CMV standard [aM] 10 5 0 0 200 400 600 BKV standard [aM] 0 200 400 600 BKV & CMV dsDNA Cas13 & crRNA ssRNA & quenched fluorophore T7 transcription Cas13 detection RPA Urine Blood DNA isolation T7 F R Reporter cleavage Fluorescence read-out RFUs RFUs 10 5 0 0.002 0.002 <0.001 0.004 0.036 0.359 0.002 0.002 <0.001 0.006 0.160 0.919Figure 2
a
b
BKV plasma HUDSON BKV urine HUDSON CRISPR (+) CRISPR (-) BKV [Copies/mL] 102 104 106 108 0 CMV [IU/mL] CMV plasmaHUDSON Column-basedCMV plasma CRISPR (+) CRISPR (-) CRISPR (+) CRISPR (-) VIRUS (+) VIRUS (-) True positive False negative False positive True negative Sensitivity Specificity BKV plasma HUDSON 17 0 19 0 100% 100% BKV urine HUDSON 15 0 16 0 100% 100% CMV plasma HUDSON 16 4 20 0 80% 100% CMV plasma column-based 20 0 20 0 100% 100%
c
d
102 104 106 108 0b
c
Figure 3
a
T7 transcription Cas13 detection rtRPA RNA isolation T7 F R Reporter cleavage Fluorescence read-out Urine Cells CXCL9 mRNA Cas13 & crRNA ssRNA & quenched fluorophoreCRISPR [RNA] rtRPA-CRISPR [RNA]
RFUs CXCL9 [aM] 107 109 108 1010 106 105 104 103 102 101 CTL 0 1000 500 ****n.s. n.s. **** **** **** n.s. *** **** **** ** <0.0001 <0.0001 <0.0001 <0.0001 <0.0001 <0.0001 0.002 0.426 <0.001 CRISPR (+) CRISPR (-) Rejection (+) Rejection (-) True positive False negative False positive True negative Sensitivity Specificity 13 1 13 4 93% 76% No rejection Rejection 0 200 400 600 800 CRISPR (+) CRISPR (-) ***
Background subtracted RFUs 30 Cut-off <0.001
d
e
1 0.4 0.6 0.8 0 0.2 0.4 0.6 0.8 1 Specificity Sensitivity 0.2 0 AUC=0.91 10 5 0 400 600 FrequencyBackground subtracted RFUs 200
Figure 4
a
DNAisolation Cas13 detectionT7 transcription BKV / CMV
dsDNA RPA
10 min, 95°C 25 min, 37°C 80 min, 37°C 3 min, RT 40 µL sample Lateral flow T7 F R - + 1 min Analysis of band intensities POSITIVE
b
c
d
e
g
h
D1 D2 D3 D1 D2 D3Relative band intensities 0
0.75 0.5 0.25 1 PCR neg PCR pos 0 5 10 15 20 25 Frequency 0.2 0.3 0.4 0.5 0.6 0.7 0.8 0.9 1.0 1.1 1.2 Relative band intensities [Test/CTL band] BKV Urine at different days
CMV standard [aM]
Relative band intensities
[T est/CTL band] 0 0.75 0.5 0.25 1 1.25 10,000 1,000 100 10 1 0.1 0 BKV [Copies/mL] Biopsy: BKV nephropathy Time [weeks] 100 102 104 106 108 1010
f
2 4 6 8 10 12 14 pos neg X X CTLs Band intensity cut-offPCR neg PCR pos 607 IU/mL 3,884 IU/mL 174,541 IU/mL
NEG Test band Control band Flow direction 2,810 C/mL 36,900 C/mL203,000 C/mL NEG X X X X
below band intensity cut-off (< 0.5)
X
above band intensity cut-off (> 0.5)
Biotin FAM Control band Streptavidin Test band capture line BKV standard [aM]
Relative band intensities
[T est/CTL band] 0 0.75 0.5 0.25 1 1.25 10,000 1,000 100 10 1 0.1 0 Band intensity cut-off
****
<0.0001
A-B; A-C
A A A
Figure 5
c
a
Relative band intensities
[T est/CTL band] 0 0.5 1 1.5 1000 100 10 1 0 CXCL9 mRNA [aM] Band intensity cut-off
b
Xbelow band intensity cut-off (< 0.5) above band intensity cut-off (> 0.5)
Creatinine [mg/dL ] CXCL9 expression Time [months] X X pos neg 0 2 4 6 8 10 2 4 6 8 100 101 102 103 104 Biopsy: ACR Time [months] X X X X pos neg 0 2 4 6 8 Biopsy: ACR Creatinine [mg/dL ] 2 4 6 8 CXCL9 expression10 0 101 102 103 104 Biopsy: CCR
Supplementary Information
Contents:
- Supplementary Figures 1-5 - Supplementary Tables 1-4
Figure S1
Supplementary Figure 1 Target genes and primer optimization. a, Target genes tested
for detection of BKV or CMV infection and rejection. b, RPA primer dilution matrix. The Sherlock fluorescence signal of BKV detection (ATCC synthetic standard) at the indicated target concentrations is depicted as colour intensity relative to the highest signal (100). Forward and reverse primer concentrations for RPA as indicated.
Figure S2
Supplementary Figure 2 Comparison of different specimen types and sample processing. a, Detection of BKV in the indicated specimens from the same patient
compared to urine from a healthy control. Different small letters indicate significant differences as assessed by one-way ANOVA and Tukey’s multiple comparisons test. Symbols: mean ± SD of 3 independent reactions. b, Comparison of sample processing by the HUDSON method (red circles) and incubation with Tween80 1% for 20 min at room temperature (blue circles). Tested on 3 different CMV negative patient samples to test for unspecific background noise and one CMV positive patient sample. Fluorescence was normalized to the highest signal (HUDSON, 100). Asterisks indicate significant differences as assessed by Student’s two-tailed t-test. Symbols: mean ± SD of 3 independent reactions.
c, Comparison of different HUDSON-based protocols on a CMV negative (grey circles) and
a CMV positive (black circles) patient sample. Asterisks indicate significant differences to the 95°C/10 min (3884 IU/mL) condition as assessed by one-way ANOVA and Dunnett’s
multiple comparisons test. Symbols: mean ± SD of 3 independent reactions. n.s. not significant, p<0.05 (*), p<0.01 (**), p<0.001(***), p<0.0001 (****) (b,c).
Figure S3
Supplementary Figure 3 CXCL9 mRNA and protein levels in rejection patients and controls. a, qPCR-based detection of CXCL9 mRNA in rejection patients (n=14) and no
rejection control patients (n=17). Blue circles indicate qPCR negative tests and orange circles indicate qPCR positive test results. The dashed line indicates the cut-off
differentiating between a negative and positive test result. b, Sensitivity and specificity of rejection detection by qPCR calculated using the cut-off value depicted in (a). c, Area under the receiver-operating-characteristic (ROC) curve (AUC) assessing the accuracy of qPCR-based rejection diagnostics (1 indicates perfect discriminatory value; 0.5 or less indicates no discriminatory value). d, ELISA-based detection of CXCL9 protein in rejection patients (n=14) and no rejection control patients (n=11). The tested samples were the same as depicted in (a) (rejection) or a subset of them (no rejection). Blue circles indicate ELISA negative tests and orange circles indicate ELISA positive test results. e, Confusion matrix indicating the sensitivity and specificity of ELISA-based rejection detection. f, Area under the receiver-operating-characteristic (ROC) curve (AUC) assessing the accuracy of ELISA-based rejection diagnostics (1 indicates perfect discriminatory value; 0.5 or less indicates no discriminatory value).
Box plot lines: median and quartiles, whiskers: data range, crosses: averages. Each symbol represents a different, independent patient sample. Asterisks: significant difference to control as assessed by Student’s two-tailed t-test. p<0.01 (**) (a,d)
Figure S4
Supplementary Figure 4 Influence of temperature and incubation time on lateral-flow band intensity. a, Incubation of the CRISPR reaction detecting the CMV synthetic standard
at the indicated concentrations for the indicated reaction times. The lateral-flow-based readout was quantified as the ratio of test/control band. The dashed line indicates the assay’s cut-off. Symbols: mean ± SD of 3 independent reactions. Asterisks indicate significant differences to the 60 min control reaction time as assessed by Student’s two-tailed t-test. b, Images of the lateral-flow assays quantified in (a). c, Incubation at different temperatures for the detection of the CMV synthetic standard at the indicated concentrations with lateral flow. Symbols: mean ± SD of 3 independent reactions. Asterisks indicate
significant differences to the 21°C control reaction as assessed by Student’s two-tailed t-test.
d, Images of the lateral-flow assays quantified in (c). n.s. not significant, p<0.05(*), p<0.01
Figure S5
Supplementary Figure 5 Optimization of the one-pot reaction. a, Schematic illustration
of the one-pot assay. b, Effect of CRISPR and T7 transcription reagents upon addition to the RPA reaction. CRISPR reagents were added pooled (+CRISPR reagents) or as a pool with one component missing (+CRISPR reagents -1). CMV synthetic DNA served as target (500aM). A separate CRISPR/T7 reaction served as readout. Fluorescence was normalized to the highest signal (RPA CTL, 100). Asterisks indicate significant differences to the RPA control without any additions (RPA CTL) as assessed by one-way ANOVA and Dunnett’s multiple comparisons test. Symbols: mean ± SD of 3 independent reactions. c,
Concentration matrix of rNTPs and dNTPs in the one-pot reaction. The fluorescence signal is depicted as colour intensity relative to the highest signal. Asterisks indicate significant differences as assessed by Student’s two-tailed t-test. d, Testing of the indicated MgOAc concentrations in the one-pot reaction. CMV synthetic DNA served as target (500aM). Different letters indicate significant differences between groups as assessed by one-way ANOVA and Tukey’s multiple comparisons test. Symbols: mean ± SD of 3 independent reactions. e, One-pot reaction detecting the ATCC quantitative BKV synthetic standard (Dunlop strain) at the indicated concentrations. Symbols: mean ± SD of 3 independent reactions. Asterisks indicate significant differences to no template control (CTL) as assessed by Student’s two-tailed t-test. p<0.05 (*), p<0.01 (**), p<0.001(***), p<0.0001 (****).
Table S1
Supplementary Table 1. Baseline and demographic characteristics of kidney transplanted patients. Baseline characteristics are presented as mean ± SD. For
non-categorical variables, data were analysed using Mann-Whitney test. For non-categorical variables, data were analysed using Fisher’s exact test.
Characteristics All subjects
(N=31)
Rejection (n=14)
No Rejection
(n=17) p-value
Recipient Age (years)
Mean ± SD 59 ± 13 61 ± 12 57 ± 14 0.589 Recipient Gender Female (n, %) 17 (54.8%) 5 (35.7%) 12 (70.6%) 0.076 Male (n, %) 14 (45.2%) 9 (64.3%) 5 (29.4%) Recipient Race African American (n, %) 10 (32.2%) 7 (50.0%) 3 (17.6%) 0.131 Caucasian (n, %) 14 (45.1%) 4 (28.6%) 10 (58.8%) Other / Unknown 7 (22.6%) 3 (21.4%) 4 (23.6%) Donor gender Female (n, %) 20 (64.5%) 9 (64.3%) 11 (64.7%) 0.999 Male (n, %) 11 (35.5%) 5 (35.7%) 6 (83.3%) Donor Source Living (n, %) 11 (35.5%) 4 (28.6%) 7 (41.2%) 0.707 Deceased (n, %) 20 (64.5%) 10 (71.4%) 10 (58.8%)
Number of HLA mismatches
Mean ± SD 4.4 ± 1.2 4.2 ± 0.9 4.6 ± 1.4 0.096
Induction Therapy
Thymoglobulin (n, %) 16 (51.6%) 5 (35.7%) 11 (64.7%) 0.268
Basiliximab (n, %) 14 (45.2%) 8 (57.1%) 6 (35.3%)
Alemtuzumab (n, %) 1 (3.2%) 1 (7.2%) 0 (0.0%)
Time since transplant (months)
Mean ± SD 12 ± 12 14 ± 13 11 ± 12 0.256
Cause of kidney disease
Diabetes 7 (22.6%) 4 (28.5%) 3 (17.6%) 0.464
Polycystic kidney disease 5 (16.2%) 3 (21.5%) 2 (11.8%)
Glomerulopathy 8 (25.8%) 3 (21.5%) 5 (29.5%)
Interstitial Nephritis 3 (9.6%) 0 (0.0%) 3 (17.6%)
Table S2
Supplementary Table 2. Diagnosis at the time of biopsy from rejection patients’ cohort. Data is expressed as mean ± SD. Banff score abbreviations: glomerulitis (g),
interstitial inflammation (i), tubulitis (t), intimal arteritis (v) peritubular capillaritis (ptc),
interstitial fibrosis (ci), tubular atrophy (ct), vascular fibrous intimal thickening (cv), glomerular basement membrane double contours (cg), arteriolar hyalinosis (ah).
Characteristics n=14 Creatinine (mg/dL) 3.24 ± 1.63 eGFR (ml/min/1.73m2) 23.21 ± 9.27 Rejection Type (n, %) Borderline 1 (7.2%) IA/IB 8 (57.1%) IIA/IIB 4 (28.5%) III 1 (7.2%) Banff g score 1.5 ± 1.4 Banff i score 2.4 ± 0.8 Banff t score 2.1 ± 0.8 Banff v score 0.6 ± 0.9 Banff ptc score 1.5 ± 1.3 Banff ci score 1.2 ± 0.7 Banff ct score 1.2 ± 1.0 Banff cv score 1.2 ± 1.0 Banff cg score 0.6 ± 0.9 Banff ah score 0.6 ± 0.9 C4d score 0.6 ± 1.2
Table S3
ELISA
Biolayer
interferometry CRISPR diagnostics qPCR
Reference
RND systems (DCX900)
Gandolfini et al.,
2017 this paper Altona diagnostics, RealStar Kits
Hricik et al., 2013 021003 (CMV); 031003 (BKV)
Analyte CXCL9 protein CXCL9 protein
CXCL9 mRNA; BKV &
CMV DNA BKV & CMV DNA
Speed
Assay length 4h 30min 60min 108min 85min
Hands-on time 1h 20min 10min 10min 10min
Costs Equipment > $5,000 USD > $100,000 USD (OctetRED96) > $5,000 USD (fluorescence) > $5,000 USD
$2.3 USD per test
(lateral flow)
Reagents (per test) $5.4 USD $1 USD $1 USD $20 USD
Sensitivity 11.3 pg/mL 35 pg/mL low attomolar range low attomolar range
POCT compatibility
Isothermal incubation Yes Yes Yes No
Minimal equipment No No Yes (lateral flow) No
Visual output No No Yes (lateral flow) No
Supplementary Table 3. Comparison of CRISPR diagnostics with ELISA, biolayer
Table S4
Name Sequence (5’ – 3’)
RPA Primer
BKV_STA_fwd GAAATTAATACGACTCACTATAGGCATTGCAGAGTTTC
TTCAGTTAGGTCTAAGCC
BKV_STA_rev AATTTTTAAGAAAAGAGCCCTTGGTTTGGATA
CMV_UL54_fwd GAAATTAATACGACTCACTATAGGGCACCAGCCGAAC
GTGGTGATCCGCCGATCGATGAC
CMV_UL54_rev CTATCAGCAACTGGACCATGGCCAGAAAAATCG
CXCL9_fwd GAAATTAATACGACTCACTATAGGTATCCACCTACAAT
CCTTGAAAGACCTTAAAC
CXCL9_rev TTAGACATGTTTGAACTCCATTCTTCAGTGTA
qPCR Primer and Probes
CXCL9_fwd CTTTTCCTCTTGGGCATCATCT CXCL9_rev AGGAACAGCGACCCTTTCTCA CXCL9 probe FAM-TACTGGGGTTCCTTGCACTCCAATCAGA-TAMRA 18S_fwd GCCCGAAGCGTTTACTTTGA 18S_rev TCCATTATTCCTAGCTGCGGTATC 18S_probe FAM-AAAGCAGGCCCGAGCCGCC-TAMRA
Oligos for T7 synthesis of crRNAs
T7_fwd GAAATTAATACGACTCACTATAGG BKV_STA_rev CTGTGTGAAGCAGTCAATGCAGTAGCAAGTTTTAGTCC CCTTCGTTTTTGGGGTAGTCTAAATCCCTATAGTGAGT CGTATTAATTTC CMV_UL54_rev CGCGTCAGCGGATCCACACGGACCTCGTGTTTTAGTC CCCTTCGTTTTTGGGGTAGTCTAAATCCCTATAGTGAG TCGTATTAATTTC CXCL9_rev GCCCTTCCTGCGAGAAAATTGAAATCATGTTTTAGTCC CCTTCGTTTTTGGGGTAGTCTAAATCCCTATAGTGAGT CGTATTAATTTC Synthetic targets CXCL9 GAAATTAATACGACTCACTATAGGATGAAGAAAAGTGG TGTTCTTTTCCTCTTGGGCATCATCTTGCTGGTTCTGAT TGGAGTGCAAGGAACCCCAGTAGTGAGAAAGGGTCG CTGTTCCTGCATCAGCACCAACCAAGGGACTATCCAC CTACAATCCTTGAAAGACCTTAAACAATTTGCCCCAAG CCCTTCCTGCGAGAAAATTGAAATCATTGCTACACTGA AGAATGGAGTTCAAACATGTCTAAACCCAGATTCAGCA GATGTGAAGGAACTGATTAAAAAGTGGGAGAAACAGG TCAGCCAAAAGAAAAAGCAAAAGAATGGGAAAAAACAT CAAAAAAAGAAAGTTCTGAAAGTTCGAAAATCTCAACG TTCTCGTCAAAAGAAGACTACATAA Cleavage Reporter
Lateral Flow 6FAM-mArArUrGrGrCmAmArArUrGrGrCmA-BIO
Fluorescence RNAse ALERT V2 (Thermo)
![Figure 1 a Conservation [%] BKV small T AntigenFSPR100907080 RFUs BKV standard [aM]** ** ****** n.s.15,0005005050.5 0.05 CTL101001000 F SP R 0.05 CTL0.55505005,000RFUs CMV standard [aM]1101001000Conservation [%]CMV UL54100907080bc de**** *****n.s.n.s.gf20](https://thumb-eu.123doks.com/thumbv2/123doknet/14518935.531024/17.892.68.811.58.688/figure-conservation-small-antigenfspr-rfus-standard-standard-conservation.webp)
![Figure 2 a b BKV plasma HUDSONBKV urineHUDSON CRISPR (+)CRISPR (-)BKV [Copies/mL]1021041061080 CMV [IU/mL] CMV plasma HUDSON CMV plasma Column-based CRISPR (+)CRISPR (-) CRISPR (+)CRISPR (-) VIRUS (+) VIRUS (-)True positiveFalse negative False positive Tru](https://thumb-eu.123doks.com/thumbv2/123doknet/14518935.531024/18.892.68.740.72.573/figure-hudsonbkv-urinehudson-crispr-crispr-positivefalse-negative-positive.webp)