HAL Id: inserm-00188484
https://www.hal.inserm.fr/inserm-00188484
Submitted on 19 Nov 2007
HAL is a multi-disciplinary open access
archive for the deposit and dissemination of
sci-entific research documents, whether they are
pub-lished or not. The documents may come from
teaching and research institutions in France or
abroad, or from public or private research centers.
L’archive ouverte pluridisciplinaire HAL, est
destinée au dépôt et à la diffusion de documents
scientifiques de niveau recherche, publiés ou non,
émanant des établissements d’enseignement et de
recherche français ou étrangers, des laboratoires
publics ou privés.
Temporal Tracking of Coronaries in Multi-slice
Computed Tomography.
Soizic Laguitton, Cesary Boldak, Christine Toumoulin
To cite this version:
Soizic Laguitton, Cesary Boldak, Christine Toumoulin. Temporal Tracking of Coronaries in Multi-slice
Computed Tomography.. Conference proceedings : .. Annual International Conference of the IEEE
Engineering in Medicine and Biology Society. IEEE Engineering in Medicine and Biology Society.
Annual Conference, Institute of Electrical and Electronics Engineers (IEEE), 2007, 1, pp.4512-4515.
�10.1109/IEMBS.2007.4353342�. �inserm-00188484�
HAL author manuscript inserm-00188484, version 1
HAL author manuscript
Abstract— A method is proposed that performs a temporal tracking of the coronaries in multi-slice computed tomography (MSCT) dynamic sequences. The process exploits geometric moments and a local cylindrical approximation of the vessel to estimate the local characteristics of the structure in each volume and estimate its displacement along the sequence. The research strategy is based on a region matching process to find the location of the point in the successive volumes. A spatial tracking is then applied to refine its location inside the vessel. Tests have been achieved on simulated and real displacements of coronary segments.
Keywords— Coronary motion, 3D Sequence Tracking, MSCTA, 3D Geometric Moments
I.INTRODUCTION
TUDYING cardiac motion is an important issue with potential application in both diagnostic and intervention planning. The movement of coronaries, induced by the heart beating, can be exploited as an indicator of the cardiac function. The motion pattern of the vessels may also have an impact on the development of atherosclerotic plaque [1]. In the percutaneous revascularization, the accurate guidance of the catheter carrying a balloon or a stent, aims to place this catheter at the atheromateous site while avoiding hurting the plaque, with the induced risks of rupture. Motion of the heart can introduce large changes in the image position of the lesion, requiring the clinician to continuously estimate the position of the target. The simulation of the catheter trajectory from pre-operative data acquired on a MSCT system, allows then optimizing the placement of the catheter while securing the therapeutic gesture.
We propose in this paper a point tracking algorithm to estimate the motion of vascular segments on a cardiac cycle from a volume MSCT sequence.
Point tracking along a sequence of images or volumes is a common problem to several domains such as computer vision and medical imaging. Numerous methods can be found in the literature. Variability inter-patients, deformations of structures and non-linearity of the movement make difficult the use of a motion model [2]. Considering that the tracked point doesn’t have a distinct movement from the surrounding, structure and motion methods [3] can’t be employed. A region matching scheme was chosen. The contributions are the research technique, the selection method, and the combination of features used for the matching process. Depending on the application, different information can be employed for the
correspondence: artificial objects easily detected (landmarks), color, intensity, geometry and shape [4]. We use a combination of geometry and intensity information. The geometry information is extracted modeling locally the vessel with a cylinder and using geometrical moments [5]. Researching the point in the next volume can be considered as an optimization task. In order to avoid local optimum, one can use exhaustive research. However with three dimensions and a maximal magnitude of movement about 1 cm (i.e. 25 voxels) the research will have a high cost. Without prior motion model, others possible approaches are stochastic optimization methods like simulating annealing [6] or genetic algorithm [7]. We propose an original exploration technique in two steps: research of a point of the vessel favoring high intensity region, then refinement of the position with a spatial tracking along the vessel.
Part II exposes the method in three steps: estimation of the local features, temporal tracking and position refinement process. Part III presents the tests achieved and their results. A discussion is finally provided in section IV.
II. VOXEL TRACKING PROCESS
The tracking process was performed into three steps (Fig.1): 1. Estimation of the local characteristics of the vessel
around the considered voxel at time t.
2. Research of a point belonging to the vessel at time t+1,
Temporal Tracking of Coronaries in Multi-slice Computed Tomography
S. Laguitton
1,2, C. Boldak
3, C. Toumoulin
1,21
INSERM, U 642, Rennes, F-35000 France
2
Université de Rennes 1, LTSI, F-35000, France
3 Computer Science Department, Institute of Bialystok, Bialystok, Poland
S
Fig. 1: Schematic representation of the proposed method for the tracking of coronaries in MSCT sequences. The tracking is initiated
interactively on the volume Vt, the position Pt is projected on the next
volume Vt+1, then the temporal tracking and position refinement steps
allow the position to be recovered.
investigating high intensity points situated in a spherical area, and combining geometric and intensity features for the correspondence.
3. Adjustment of the position inside the vessel considering neighboring points located on the vessel central axis, and using the sum of squared differences as a criterion.
A. Estimation of local features
The local characteristics of the structure are expressed in terms of geometry and intensity information. They are computed from the geometrical moments up to the order 2 and the histogram inside a spherical window centered on the point of interest. The vessel is locally modeled by a cylinder of gravity centre P, radius r and orientation (α,β) in 3D space [5]. The centre of gravity is assessed from the zero and one order centered moments. The radius is computed using zero order moment, mean intensity inside (Iv) and outside (Ib) the vessel, and the size of the sphere
where the moments are computed. Mean intensities Iv and Ib
are estimated from a histogram computed on an extended region (including the vessel and the background) around the point P, using an expectation maximization algorithm. The local orientation of the vessel (α,β) is computed from the second order centered moments.
The accuracy of the diameter is directly correlated with the size and the position of the spherical window used to compute the geometrical moments. The window has to be centered on the central axis of the vessel and its size fitted the diameter of the vessel. To adjust the position and the size of the sphere, we use an iterative multiresolution algorithm [5], which alternatively moves the sphere towards its centre of gravity, estimates the vessel radius and adjust the size of the sphere until convergence of the sphere radius on the vessel size.
B. Temporal tracking
Temporal tracking is initiated interactively, selecting a point of a vessel Pinit on the volume Vt in the sequence. The
iterative multiresolution algorithm is applied to adjust this position on the central axis and to estimate accurately the local characteristics of the vessel. The position is named Pt.
Tracking the point Pt along the dynamic 3D sequence
means researching its positions (Pt+1, Pt+2 …) in the
successive volumes (Vt+1, Vt+2 …). No prior knowledge of
the movement was available, except that the maximum movement between two successive volumes is about 1 cm [8][9]. The position Pt+1 in the volume Vt+1 is researched
inside a spherical area centered on the previous position Pt,
with a 1 cm radius. This space is then divided into N small spheres with a radius r equal to the vessel radius estimated at the previous point Pt on the volume Vt. The positions of
the spheres are chosen to optimize the covered space (fig 1). We apply afterwards, on each sphere, the iterative multiresolution algorithm. Each sphere moves towards the
surrounding region of highest intensity. These regions are mainly cardiac cavities and vessels. Local features are then estimated for each small sphere centered on the points
1
i t
P
+ ,i∈[0.. ]N .The matching between the referent region centered on
Pt in the volume Vt and each region centered on 1
i t
P
+ is performed using 3 characteristics: the second order momentsM , the local histogram hist, and the estimated 2radius of the vessel r. We compute a distance
, 1
i t t
D + for each region i:
Where DE is the Euclidean distance, αM2(1), αM2( 2), αr
and αhist are normalization coefficients, (1) 2
M designates the second order moments M011, M101 and M110, and
( 2) 2
M designates M002, M020 and M200. Among the candidates 1
i t
P
+ , the point with the lower value of, 1
i t t
D +is selected as potential candidate (namedPˆt+1). We split in two groups the
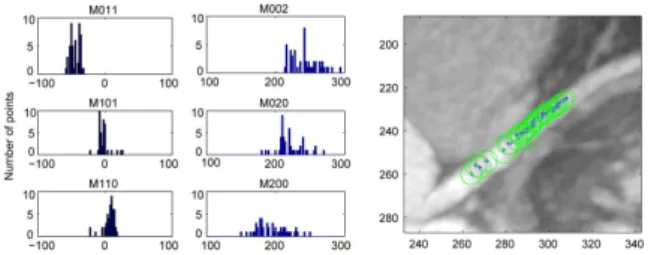
second order moments because, considering several points on a vessel, theirs standard deviations differ (fig.2).
The Euclidean distances for the four features (1) 2
M ,
( 2) 2
M , hist and r are computed for each candidate point
1
i t
P
+ . The candidates are then ordering in ascending order for each feature. Thus, four ranks are assigned to each candidate. The values of coefficientsαM2(1), αM2( 2), αr and αhistare, respectively, the mean Euclidean distances for(1) 2
M , ( 2) 2
M , r and hist, computed on the 20 regions having the lowest sum of the four ranks. We choose the first 20 points because they are, in general, located on the vessel.
C. Refinement inside the vessel
The estimated pointPˆt+1 is assumed to be located on the vessel but not necessarily at the exact position. A spatial tracking process is thus applied on the vessel to refine the point position. It is performed from the pointPˆt+1on a distance of 20 voxels along the vessel, in each opposite
( )
( )
(
)
( )
( )
(
)
( )
( )
(
)
( )
( )
(
)
2 (1) (1) , 1 2 2 1 2 (1) 2 ( 2 ) ( 2 ) 2 2 1 2 ( 2 ) 2 1 2 1 0.5 , 0.5 , 1 1 , i i t t E t t M i E t t M i t t r i E t t hist D D M P M P D M P M P r P r P D hist P hist P + + + + + = α + α + − α + αFig. 2. For each sphere represented on the image, 3D second order moments were computed. The graphics on the left present, for each second order moment, the distribution of the point. The standard deviations for M011/M101/M110 and M002/M020/M200 differ.
direction. The extracted points ˆj1 t
P+ , j∈ −[ 20..20] are
then located on the vessel central axis with a maximum distance from 0
1 1
ˆ ˆ
t t
P+ =P+ equal to 8 mm. The sum of
squared differences computed on a 1 cm side cube is then used to select the most likely position of the voxel Pt+1 in
the volume Vt+1.
The spatial tracking uses the estimated direction of the vessel (α,β) computed from the second order moments. At each iteration, the spatial tracking process moves forward along this direction. To maintain the position on the vessel central axis, the iterative multiresolution algorithm is applied. However, to avoid gaps along the vessel, the displacement is constrained inside a perpendicular plane to the direction (α,β) of the vessel with the distance 1 voxel from the previous extracted point. Loops and reversals detections are also performed at each progression step.
III. RESULTS
The algorithm was tested on dynamic cardiac sequences acquired on a GE LightSpeed system with 64 detectors rings. These sequences include 10 volumes reconstructed from slices acquired every 10% of the cardiac cycle and on several cycles. There are approximately 200 slices per volume, with 512x512 pixels per slice. The resolution is about 0.4x0.4 mm2 per pixel. A preliminary interpolation was performed to make the datasets isotropic. The algorithm was tested on the main branches of coronary arteries: right coronary, left circumflex, left anterior descending, first and second diagonals. The great majority of the vessels were affected with atherosclerosis which means no regular shapes, calcifications and stents. The results are presented on maximum intensity projections (MIP).
A first stage aimed to evaluate the behavior of the algorithm with a simulated displacement of the structures. We applied thus a spatial translation of growing magnitude up to 12 mm, on several of the volumes of each sequence. These tests were promising since the algorithm permit to recover the vessel for motion magnitude over 1 cm.
The method was then tested on real sequences (Fig.3. and 4.). A series of tests was achieved to select the features to be used in the matching process. We had to select the combination of features giving the best results among: geometrical moments up to order 2, histogram, background and vessel intensity, vessel radius and direction. The tests were first achieved on 10 points of one sequence and then the best combination was tested on the others sequences. We found the best results for the combination: second order moments, histogram and rayon with 91% success, against 72% using only second order moments for example.
The whole method (temporal tracking and adjustment process) was applied to assess the trajectories of points of coronary arteries. For one of the sequences, the displacements of several points located along the left anterior descending artery are given Fig.5. Except for one
of the points, when the point moves away from the origin of the artery, the magnitude of the movement increases. This observation is coherent with physiology because the left anterior artery starts from the aorta and then goes towards the apex which is fixed. The greatest motion amplitudes concern thus the proximal segment of the artery.
We also observed the trajectories of a point for different patients. The displacement curve for a point located on the left anterior descending for four patients is presented on Fig.6. Despite significant interpatient variability, the movement directions are similar and
Fig.3: Tracking process applied on a point of the left anterior descending artery situated 2.5 cm away from the left coronary artery origin. a. Position of the voxel Pt in the volume Vt. b. Projection of the
position Pt in the volume Vt+1, the research area is centered on this
point. c. Positions and size of the small spheres contained in the research area, once the iterative multiresolution algorithm was applied. The orange asterisk indicate the selected point
1
ˆ
t
P+. d. Refinement
process. Points extracted with the spatial tracking process are indicated with black dots and the red star indicates thefinal position Pt-1.
Fig. 4: Temporal tracking of a voxel located on the circumflex artery situated 1.5 cm away from the left coronary artery origin. Results are
shown on MIP images. The star indicates the position of the point Pt
found on the volume Vt, the lozenge indicates the previous position of
the point Pt-1, and the asterisk the position of the point obtains without
position refinement process
1 ˆ
t
P+.
different stages in the cardiac cycle are apparent. The first rapid motion corresponds to ventricular systole. After around 40% phase, the movements are due to diastole.
IV. DISCUSSION
The difficulty comes from both the characteristics of the images and the structural complexity of the scene. The images are spatially anisotropic (a linear interpolation between slices needs to be applied), not corrected during the reconstruction in term of motion artifacts (Fig 4. 50% phase). The scene includes different structures such as myocardium, cavities, venous and arterial trees, which are
very close together and have similar intensities. The vessels are thin and affected by atherosclerosis. Thanks to a meticulous choice of the features used for the correspondence and an efficient research strategy, the method overcomes mostly these problems, except when the damages induced by motion artifacts are excessive. The method takes advantage of the vessel pathologies. Indeed, in the case of atherosclerosis, vessels are no longer straight or regular, so it becomes easier to distinguish between neighboring points in a vessel.
V. CONCLUSION
We have proposed a method to track coronaries in dynamic volume sequences in MSCT. It copes with the major problems encountered in this imagery modality. The results are coherent with other studies on coronary motion, performed on biplane angiography [8][9]. The future work will be to accelerate the process, taking advantage of the knowledge acquired from the observation of displacements curves obtained.
ACKNOWLEDGMENT
This work is done in the frame of a contract with the Brittany region.
REFERENCES
[1] Ding, Z. and Friedman, M. H., "Dynamics of Human Coronary Arterial Motion and Its Potential Role in Coronary Atherogenesis", J.
Biomech. Eng. 122, 488-492 (2000).
[2] Cremers D. "Dynamical statistical shape priors for level set based tracking" IEEE Trans. on Pattern Analysis and Machine Intelligence, 28(8): 1262-1273, August 2006
[3] Mitiche A. and Sekkati H., "Optical Flow 3D Segmentation and Interpretation: A Variational Method with Active Curve Evolution
and Level Sets", IEEE Trans on Pattern Analysis and Machine
Intelligence, Vol 28, No. 11, pp. 1818-1829, 2006
[4] Moeslund T.B., Hilton A. and Kruger V., "A survey of advances in vision-based human motion capture and analysis" Computer vision
and image understanding. 2006
[5] Bołdak C et al., "An improved model-based vessel tracking algorithm with application to Computed Tomography Angiography"; J. of
Biocybernetics and Biomédical Engineering, vol 3 (1), 2003, 41:64.
[6] Gu J., Toumoulin C., and Shu H., "Spatio-temporal registration in coronary angiography" Proceedings of the 25th Annual International
Conference of the IEEE EMBS, 2003.
[7] Tagliasacchi M., "A Genetic Algorithm for Optical Flow Estimation"
Image and Vision Computing. Volume 25, Issue 2, February 2007,
pages 141-147
[8] Achenbach S. et al.,"In Plane coronary arterial motion velocity: measurement with Electron-Beam CT", J. of Radiology, vol (216), 2000, 457:463
[9] Shechter G. et al.,"Displacement and velocity of the coronary arteries: Cardiac and respiratory motion", IEEE Transactions on
Medical Imaging, vol. 25(3), 2006, 369:375.
Fig. 6: Displacement of a point of the left anterior descending artery for 4 patients. The point is located about 2 cm from the origin of the left coronary artery. The curve without marker is the mean displacement. a.b.c. Decomposition of the displacement into three 1-D displacements: left/right, post/anterior and inferior/superior. d. 3-D
displacements.
Fig.5. Movement of five points located along the left anterior descending artery. a. The diamond, star, square, circle and triangle show the position of the points on a MIP computed on the 0% phase volume, the lines show the trajectory projected on axial plan. The distance between points is about 1cm. b. Global displacement of the 5 points. The markers on the curves correspond to the marker use to localize the point on the MIP a..The line without marker is the mean displacement.