HAL Id: hal-02639697
https://hal.archives-ouvertes.fr/hal-02639697
Submitted on 28 May 2020HAL is a multi-disciplinary open access archive for the deposit and dissemination of sci-entific research documents, whether they are pub-lished or not. The documents may come from teaching and research institutions in France or abroad, or from public or private research centers.
L’archive ouverte pluridisciplinaire HAL, est destinée au dépôt et à la diffusion de documents scientifiques de niveau recherche, publiés ou non, émanant des établissements d’enseignement et de recherche français ou étrangers, des laboratoires publics ou privés.
Influence of resolution on the X-ray CT-based
measurements of metallic AM lattice structures
Jitendra Singh Rathore, Caroline Vienne, Yann Quinsat, Christophe Tournier
To cite this version:
Jitendra Singh Rathore, Caroline Vienne, Yann Quinsat, Christophe Tournier. Influence of resolution on the X-ray CT-based measurements of metallic AM lattice structures. Welding in the World, Springer, 2020, �10.1007/s40194-020-00920-4�. �hal-02639697�
1
Influence of resolution on the X-ray CT based measurements of
metallic AM lattice structures
Jitendra Singh Rathore1*,†, Caroline Vienne2, Yann Quinsat3, Christophe Tournier1,3 1 Institut de Recherche Technologique SystemX, 91120 Palaiseau, France
2 CEA, LIST, DISC, 91191 Gif-sur-Yvette, France
3 LURPA, ENS Paris-Saclay, Université Paris-Sud, Université Paris-Saclay, 94235 Cachan, France
Abstract
Additive manufactured (AM) lattice structures have become very prominent in recent times especially in air and spacecraft industry for their lower weight and specific mechanical properties. Their stiffness and strength can be controlled by their geometrical properties, such as the shape and dimensions of the unit cell. Geometrical and dimensional accuracy of the AM lattices is therefore one of the most important requirements to meet the desired functionality as there could be significant deviations in the as-produced part from the designed model; thus their measurements are of great significance. X-ray computed tomography (CT) has emerged as a promising solution in the field of industrial quality control over the last few years due to its non-destructive approach. However, CT measurement accuracy depends on various parameters (part material, system, operator, environment, data post-processing), among which the resolution or voxel size of the CT data is crucial. In this work the influence of resolution on the measurement of metallic lattice structure is studied by means of simulations and real CT experiments. The optimized CT acquisition settings are obtained with the help of simulated radiographs and design-of-experiment approach. Three different resolutions are achieved by placing the part at different positions from the X-ray source. The computer-aided design (CAD) model comparison reveals that the majority of surface has a deviation of ± 0.2 mm and the results are slightly affected by the resolution. The wall thickness analysis provides a global observation of the strut and node thicknesses. Individual struts are measured with representative regions of interest (ROIs) considering the manufacturing direction. The measurement results are significantly affected by the resolution (or voxel size) of the CT data. Simulated CT scans with different resolutions have been performed for systematic error estimation in relation to the voxel size.
Keywords: additive manufacturing, lattice structure, x-ray computed tomography, voxel size
1. Introduction
Lattice structures have become very prominent in recent times due to their number of advantages including optimum use of material, shorter production cycle, reduced energy utilization and enhanced properties [1]. These advantages make the lattice structures very suitable for high value aerospace, medical and engineering products. Furthermore, they are also advantageous in context to their entire product life cycles. For instance, the use of lattice structures minimizes material [2, 3] wastage and possibility to be recycled easily, particularly when comprised of a single material. One of the main elements that has hindered the development of these structures is the manufacture of these parts with complex, fully three-dimensional (3D) geometrical features. This limitation to development is now partially removed with the advancements of additive manufacturing (AM) processes. In general, AM offers several advantages as compared to conventional manufacturing methods e.g. casting, forging etc. since AM processes allow to have complex features and geometries in the desired parts which cannot be produced with conventional manufacturing methods. Indeed, the lattice structures are now mainly produced by additive manufacturing methods; the common methods employed are: selective laser sintering; selective laser melting (SLM) and electron beam melting [2].
Nevertheless, the advantages offered by AM parts are very much relied on their geometrical and dimensional accuracy as there could be significant differences between designed and as-produced parts [4]. Therefore, it is very important to characterize the parts geometry as well as the material in order to predict their functional performances to avoid premature failures. In addition, it is desirable to have quality assessment at macro and micro levels corresponding to the overall geometrical deviations and measurements of small features respectively. Moreover, there are numerous metrological challenges associated with the AM parts such as high surface roughness, complex freeform surfaces, internal porosity, entrapped powder material and internal geometrical features [4, 5]. Inadequacy of AM standards is also a metrological
limitation in quality assessment; hence there is need to develop standard for measurements of AM parts. Evidently there is also a need for new measuring technologies and instruments for holistic quality control.
Industrial X-ray computed tomography (CT) is a computer-aided non-destructive technique (NDT) that uses irradiation to produce 3D internal and external representations of a scanned object. Industrial CT scanning has been used in many areas of industry for internal inspection of components. Some of the key uses have been flaw detection, failure analysis, metrology, assembly analysis and reverse engineering applications. Similar to medical imaging, industrial imaging can be used for both radiography (2D) and tomographic (3D). X-ray CT is also being utilized for holistic measurements of AM parts; especially, some of the recent advancements in the field of industrial X-ray CT [6] has made it a preferred solution for quality assessment of AM parts. Van Bael et al. [7] utilized X-ray CT for optimizing the robustness and controllability of the production of porous Ti6Al4V structures produced by SLM by reducing the mismatch between designed and as-produced morphological and mechanical properties. Yan et al. [8] revealed with the help of Micro CT that the gyroid cellular lattice structures with various unit cell sizes ranging from 2 to 8 mm can be manufactured free of defects by the SLM process without the need of additional support structures. It is demonstrated [9] that micro CT provides not only 3D quantification of structure quality, but also a feedback mechanism, such that improvements to the initial design can be made to create more stable and reliable titanium structures for a wide variety of applications. Bauza et al. [10, 11] studied the CT based accuracy of AM parts using a test artefacts. Pyka et al. [12, 13] used X-ray CT for surface topography measurements, by extracting profiles from the slice data obtained from measurements of lattice struts. This work was further extended by Townsend [14] and Thompson et al. [15] by a more extensive examination of XCT topography measurement performance in comparison to conventional optical surface measurement. It is evident that, X-ray CT can be used for extracting surface topography, dimensional measurements and geometrical deviations in context to AM parts. In the current work, an investigation is carried out on the influence of various factors on the CT measurement results for a metallic AM lattice structure. First, a design-of-experiment (DoE) approach is utilized for finding out the optimizated scanning parameters and the optimum part placement by means of CT simulation. With the optimized setting, real CT experiments have been performed achieving three different resolutions. The next section includes the obtained results with their discussions with a model (CT simulation) based correlation of voxel size and the induced error. As an example, a high resolution CT scan of a single beam is also demonstrated. The paper is conclude by highlighting the major findings of the work.
2. Experimentation
This section consists of the details about the metallic lattice structure used for the study and the CT scanning experiments and simulations performed on the lattice structures.
2.1. Metallic lattice structure
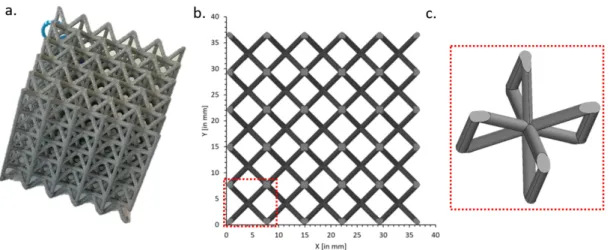
A metallic lattice structure manufactured by Electron-beam melting (EBM) additive manufacturing process was utilized for this study. Different sizes of the lattices are manufactured in form of cubes with equal number of unit cells in all three directions. The lattice structure is composed of five unit cells in each direction which makes the configuration of 5 × 5 × 5 (as shown in Figure 1). The unit cell is a type of body centred cubic arrangement with z struts (BCCz), which results into four vertical struts and four pairs of 45º inclined struts. The vertical struts are shared among four neighbouring unit cells whereas the inclined struts are entirely part of one unit cell. The struts of the lattice are designed as identical solid cylindrical elements with a nominal strut diameter of 1 mm. The material of the lattice is Inconel 718 with a density of 8.47 g/cm3.
First, the lattices is examined for the feasibility study with X-ray CT to find out the optimized scanning conditions followed by acquisition of real CT data at different resolutions as explained in the next section.
Figure 1: The Inconel lattice with 5×5×5 configuration (a), the top view with the nominal dimensions (b) and the BCCz
type of unit cell (c) 2.2. Tomographic characterization of lattice
X-ray CT is a very extensive measurement technique which involves a number of steps for performing the requisite tasks [16] and to acquire high quality data. As shown in Figure 2 the part is placed between a source and a detector, then the projections are acquired while the part is moving around the rotational axis with of speed of rotation depending on the selected number of projections. The closer the part is placed to the source, the higher the resolution is achieved. However, the best resolution is relative to the size of the part due to the field-of-view (FOV) limitation, which is depicted by the X-ray cone. Furthermore, higher resolution can be obtained using region of interest (ROI) scanning or partial scanning. Moreover, the results are influenced by different factors related to the system, object, data processing, environment as well as the operator as explained in [17, 18].
Figure 2 : The schematic representation of X-ray scanning set up
2.2.1 Influence of scanning settings
The scanning parameters (voltage, current, exposure time, choice of physical filter) are defined mainly considering the material, size and the geometry of the object. The attenuation is the function of material density, therefore, higher density materials (e.g. metals, alloys) are usually difficult to penetrate and require high power. Thus, it is first step to visually analyze the part and subsequently find the right set of scanning parameters. The voltage and the current correspond to the intensity of X-rays and the number of photons respectively. The commonly used quality measures in X-ray CT are transmission, signal-to-noise (SNR) ratio and contrast-to-noise ratio (CNR); the transmission is the ratio between the minimal and the maximal X-ray intensity at the detector, which is expressed in the respective grey values in the radiographic image [19]. The standards propose a transmission-based adjustment of scan parameters, with a minimal transmission between 10% and 20%, respectively, to reach an optimal signal-to-noise ratio (SNR) [20, 21]. In order to find out the right set of scanning parameters for the lattice structure, the projection based approach was followed using the radiography module of the commercial NDT simulation software CIVA® developed by CEA [22]. The prior knowledge of
scanning similar parts and/or materials helps in defining the preliminary settings. A design-of-experiment approach composed of three factors as voltage (3 levels), current (3 levels) and thickness of Cu-filter (4 levels) resulting into 36 unique settings; the scheme is shown in Table 1. The minimum, maximum grey levels and their ratio are the responses to be considered for the DoE analysis.
Table 1: Design of experiments approach
Factor Low level Mid-level High level
Voltage [kV] 200 210 220
Current [µm] 80 100 120
Cu-filter thickness [µm] 1 1.5 and 2 2.5
Figure 3: Main effect plots for min. grey level (a), max. grey level (b) and ratio of min. and max. grey levels (c) (the
dashed lines show the total averages)
As explained, the obtained min. grey value, max. grey value and their ratio are used as response variable to perform the statistical analysis. The main effects and the interactions are studied to identify the most influencing parameters. The main effect plots are presented in Figure 3. The min. and max. grey values are increased on increasing voltage and current. On the other hand, increasing the filter thickness reduces both the min. and max. grey values. Moreover, the ratio is not affected by current but improved on increasing the voltage and filter thickness. In general, no interactions were observed among voltage, current and filter thickness. Based on the DoE scheme, the optimized values for voltage and filter thickness are 210 kV and 2.2 mm; and the current is 150 µA (although it does not affect the ratio but change the amplitude of min. and max. grey level, thus a higher value is recommended).
2.2.2 Influence of part placement
The placement of part on the rotary stage may influence the CT results with presence of artefacts. Villarraga-Gómez et al. [23] studied several angular positions and its influence on the CT reconstruction and concluded that the “Vertical orientations or angular positions close to 0° (i.e. on the CT beam cone axis and aligned with vertical and horizontal planes) are not ideal because they cause strong Feldkamp artefacts in the CT image reconstruction process” can be generated by the FDK (Feldkamp Davies-Kress) reconstruction algorithm [24] itself which result in a blurriness in the reconstructed
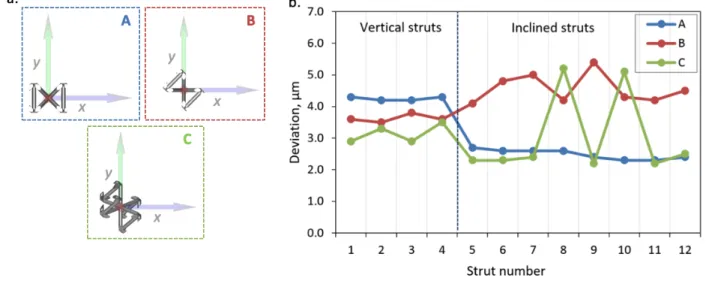
volume. The lattice structure is a complex parts which has features (struts) with several Feldkamp artefacts alignments, therefore, it is difficult to achieve a placement satisfying the above condition with respect to all the struts. As shown in Figure 4-a, three positions (A, B, C) have been studied with simulated CT scans for just one representative unit cell thanks to the periodicity of the structure. The positions A, B and C contain four struts vertical to the X-ray cone, four struts horizontal to the X-ray cone and two struts vertical to the X-ray cone respectively.
Figure 4: The different positions (A, B and C) with respect to X-ray cone (a) and the obtained deviations in the diameter
measurements of all struts of the unit cell (four vertical struts numbered from 1 to 4 and eight inclined struts numbered from 5 to 12) (b)
The corresponding deviations in the strut diameter measurements are plotted in Figure 4-b for the CT data obtained for the A, B and C positions. It is visible that the position A produced very consistent results in contrast to positions B and C. Position C show extreme variations for inclined struts numbered 8 and 10, which remained vertical to the X-ray cone. Therefore, position A orientation is recommended, which is also easier to achieve from the practical point of view to ensure stability of lattice during rotation.
2.2.3 Optimized settings
The tomographic inspection is carried out using the GERIM2 system of the CEA-List which integrates a micro-focus type RX generator and a planar detector. The RX generator is a Viscom XT9225D open tube, with a voltage of maximum acceleration of 225 kV and a maximum power of 320 W. The detector is a matrix of photodiodes with scintillator CsI, brand Perkin Elmer, model XRD 0822, having 1024 × 1024 pixels of 200 µm. The optimized set of scanning parameters are obtained from the previous step and used for the acquisition. The final settings used for the real CT experiment are reported in the Table 2. Three different magnification are used to investigate the effect of resolution on the results. The resolution of the CT data is represented by an isotropic voxel (3D pixel) size which is calculated with the distances of part from the source and detector.
Table 2: Scanning settings Voltage [kV] Current [µA] Exposure time [ms] Cu Filter [mm] No. of projections Voxel [µm] 210 80 1000 2.2 900 38.20 (~38) 210 150 500 2.2 900 57.53 (~58) 210 150 500 2.2 900 101.12 (~101)
6
3. Results and discussion
The post processing of the acquired CT projections is performed in VGStudioMax 3.2 software. The acquired projections are reconstructed using the FDK reconstruction algorithm and a volumetric data set is obtained. The next step is the surface determination, which is performed utilizing the ISO-50% method that defines the surface at mean of the average material grey value and average background grey value. The three volumetric datasets with resolutions 38 µm, 58 µm and 101 µm have been obtained corresponding to same lattice structure. The required analyses and measurements have been performed on the datasets and the results are reported and discussed here.
3.1. Global analysis
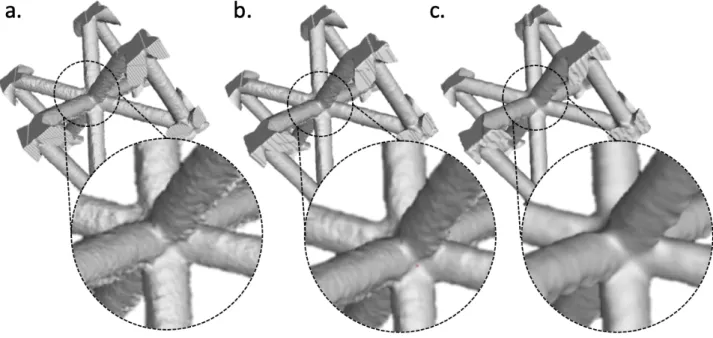
The scan quality is considerably affected by the resolution (voxel size), which can be clearly seen in the reconstructed volumes as shown in Figure 5. The central unit cell is shown here for better visualization. It is evident that lowering the resolution (increasing the voxel size) results in a smoothening or blurring effect on the surface which indicates that less surface details (asperities) are visible. For quantification of the surface deviations, the part volume is registered against the nominal CAD model utilizing Gaussian “Best-fit” alignment approach; where the average deviations between the part and CAD are minimized.
Figure 5: Representation of a unit cell showing smoothening effect for the lattice structure scanned at a voxel size of 38
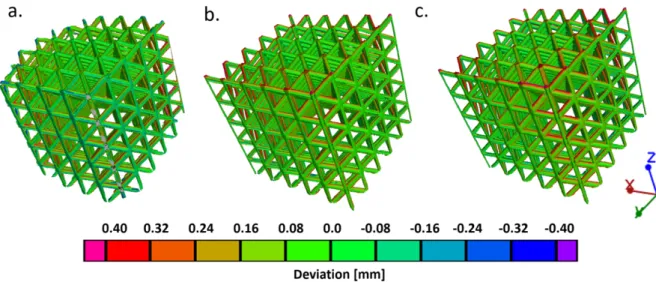
Figure 6: Geometrical deviations from the model in the lattice structure for 38 µm (a), 58 µm (b) and 101 µm (c)
The results of comparison are shown in Figure 6, where the geometrical deviations of the real part against the nominal model are depicted in colour coded maps of surface deviation with green colour representing no or minimum deviation. It should be noted that the voxel size of 38 µm resulted in a slightly less (missing corner) amount of data due to the FOV limitation. With increasing voxel size, the colour maps show slight increase in the red region which corresponds to a surface deviation of 0.40 mm, however, it is not very significantly different. Moreover, the quantification of the deviations is presented in the deviation plots (see Figure 7-a), which show overall deviations higher for 58 µm than 100 µm voxel size. Therefore, clear conclusions are difficult to be drawn from the colour maps and individual local measurements are performed which have been discussed in the next section.
Figure 7: The deviation plots for all three magnifications (a) and wall thickness plots (b) (Normalized surface: the sum is
100%)
A wall thickness analysis can be performed on CT dataset. The wall thickness analysis function available in VGStudioMax 3.2 works on the determined surface of the material. The surface data of both internal and external walls is then used in the wall thickness analysis function, which can be applied with search tolerances to find the minimum distance between the surfaces, within a given search angle. This type of analysis does not require an alignment between measured geometry and nominal model. The results are interpreted by a histogram of wall thickness against the normalized surface (Figure 7-b), which gives an impression of the average thicknesses present in the part. The strut thickness ranges from 0.8 to 1.2 mm and the thickness at nodes is in between 1.4 to 1.6 mm. The histogram shows one large peak for strut thickness between 0.8 and 1 mm and one smaller peak for the nodes between 1.3 to 1.5 mm. The average thicknesses can be computed
accordingly. There is a slight change in the histogram values with respect to the different voxel size of 58 µm and 100 µm (the voxel size of 38 µm is excluded for this comparison as it results in a truncated CT dataset due to limited FOV). 3.2. Local analysis
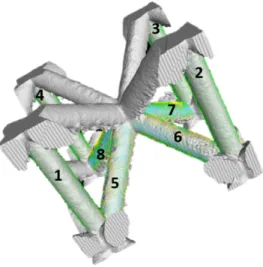
In addition to global comparisons of different resolutions on CT results, it is also important to characterize the part with localized strut measurements and see the effect of resolution on them. As reported earlier, the struts are designed as solid cylindrical elements but the manufacturing process induces several asperities e.g. surface roughness and geometrical deviations usually in range of several micrometers and measurements of these asperities could be adversely affected by the resolution. As mentioned in Figure 8, the strut diameter were measured for all three voxel sizes with a common ROI at the centre of the lattice; eight strut elements were measured (four vertical and four inclined numbered as 1 to 4 and 5 to 8 respectively). Cylindrical element is fitted by selecting a number of points on the surface and the diameter is obtained; different fitting methods were examined.
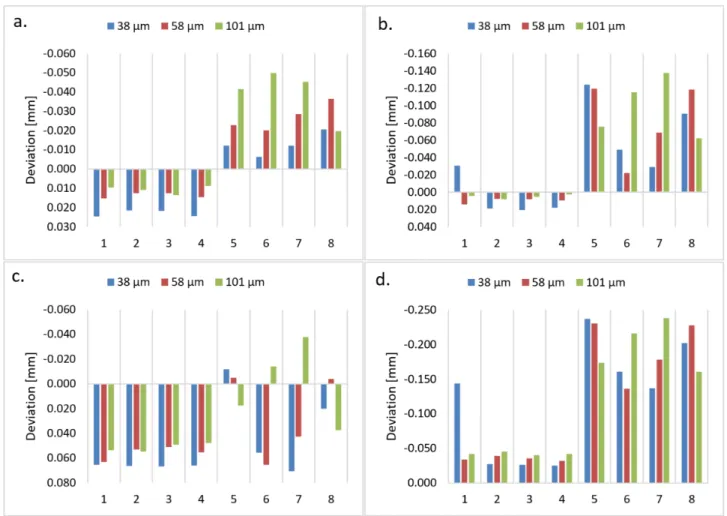
The deviations are calculated against the nominal diameter (1 mm) in the absence of a reference value and the results are reported in Figure 9. The Gaussian (Figure 9-a) and Chebyshev (Figure 9-b) fitting methods show inconsistency in the measured deviations especially for the inclined struts which could be related to the higher roughness on those struts compared to vertical struts. As visible in the plots, the resolution is affecting the results significantly although in an unexpectedly inconsistent manner. The best resolution of 38 µm resulted in a deviation of around 20 µm for vertical struts; and the deviation is lowered on decreasing resolution. Nevertheless, it is important to note that the deviation is calculated against the nominal value instead of a measured reference value, therefore, a simulation based study is performed which is included in the next section. The Figure 9-c and Figure 9-d consist the results of Maximum-inscribed and Minimum-circumscribed fitting methods which gives the local minimum and maximum diameters of the struts and thus an impression of the variability of the shape of the strut.
Figure 9: Deviations in diameter measurements for Gaussian (a), Chebyshev (b), Maximum inscribed (c) and
Minimum-circumscribed fitting methods (d) 3.3. Model based error estimation
This investigation can help in understanding the error estimation depending on the corresponding voxel size of the CT data which was not consistent with the experimental study. The fact that the reference values for the simulated data are the nominal values which is used to quantify the deviations. In contrast, the references values for real parts are needed to be obtained from other measuring techniques. The CIVA simulation program was used to perform the tomographic study (full rotation scan) imitating the real scanning procedure. With the use of Monte-Carlo, scattering can also be considered although it makes the computation very slow. The optimized settings with exposure time 500 ms mentioned in Table 1Table 2 are employed for the simulations and 900 projections are acquired. Since a unit cell is considered for the simulations, a higher resolution of 20 µm was also considered as well as 80 µm; overall five different resolutions are used for simulation. The projections are post-processed in VGStudio Max 3.2 in the similar manner as for real CT projections.
The diameter measurements were performed on the volumetric data and only Gaussian fitting (least square) method was considered. All the strut elements in the unit cell were measured and the deviations with respect to nominal diameter of 1 mm are reported in Figure 10; the vertical struts are numbered from 1 to 4, while the inclined struts are numbered from 5 to 12. In contrast to the experimental result, the simulated results are very consistent with respect to the voxel size. Increasing the voxel size increases the deviation in the measured strut diameters for both vertical and inclined struts, which means higher voxel size results in overestimation of the strut diameter. The overestimation is comparatively higher for the vertical strut than that of inclined struts, which could be attributed to the Feldkamp artefacts. The optimum voxel size for the 5×5×5 lattice structure is 58 µm, which could have resolution-based errors of around 6 µm and 12 µm in the diameter measurement of inclined and vertical struts respectively.
Figure 10: The deviation plots for all five magnifications
3.4. High resolution scan
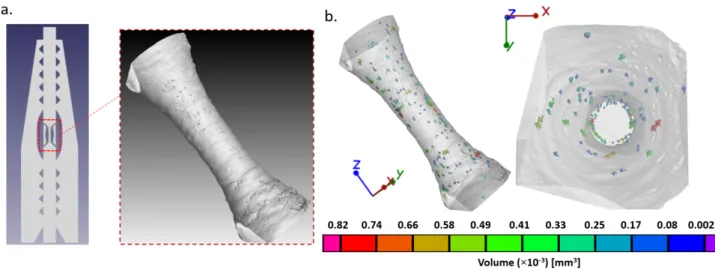
As reported, it was practically not possible to achieve higher resolution for CT acquisition considering the scan of the entire lattice structure within the field of view; therefore, a tensile specimen (Figure 11-a) consisting of a representative strut element of the lattice was utilized to test higher resolution of CT data. The resolution achieved was close to 8 µm. The high resolution of the CT data made it possible to detect the small void/pores which otherwise remained undetected in the lower resolutions full lattice scans. As visible in Figure 11-b, the pores are mainly located in the outer layer of the cylinder and the central portion is mostly defect free which may be attributed to the manufacturing process. The pore diameter ranges from 75 to 250 µm; however, the majority of the pores are of 100 to 150 µm.
Figure 11: CT scan of the tensile specimen (a) and porosity analysis (b)
4. Conclusion
This work was aimed at the feasibility study of X-ray CT for AM metallic lattice structures and investigating the influences of various aspects of CT work flow on the accuracy of measurement results. The following conclusions are drawn from the study: the simulation step helps in efficiently optimizing the scanning parameters using 2D radiographs and design of experiment approach. The real part is scanned with obtained parameters (210 kV; 150 µA and 2.2 mm Cu-filter) at resolution of 38, 58 and 100 µm. The CAD comparison reveals that the majority of surface has a deviation of ± 0.2 mm; however, the results are slightly affected by the resolution. The wall thickness analysis provides a global observation of the strut and node thicknesses. Individual struts are measured with representative ROIs considering the manufacturing direction (vertical or inclined). The vertical struts show consistency in the deviation measurements (from nominal diameter of 1 mm) with respect to voxel size. In contrast, the inclined struts have inconsistent result due to irregularities on the lower
side. Since, the deviations are calculated against the nominal diameter, therefore, the simulated scans of a unit cell were performed replicating the real scan optimized settings. The simulated measurement results indicated consistent trend in the strut diameter measurements and showed that higher voxel size results in overestimation of the strut diameter. The overestimation is comparatively higher for the vertical strut than that of inclined struts, which could be attributed to the Feldkamp artefacts. The optimum voxel size for the 5×5×5 lattice structure is 58 µm, which has resolution-based errors of around 6 µm and 12 µm in the diameter measurement of inclined and vertical struts respectively. Moreover, the high resolution (8 µm) scan of the single strut element exhibits the presence of voids/pores around the exterior portion. The future work includes the reference measurement of the strut element with other optical measurements (Alicona) and a generalized methodology for measuring all the strut elements in the lattice structures efficiently.
References
[1] M. K. Thompson, G. Moroni, T. Vaneker, G. Fadel, R. I. Campbell, I. Gibson, A. Bernard, J. Schulz, P. Graf, B. Ahuja, et al., “Design for additive manufacturing: Trends, opportunities, considerations, and constraints,” CIRP annals, vol. 65, no. 2, pp. 737– 760, 2016.
[2] M. Helou and S. Kara, “Design, analysis and manufacturing of lattice structures: an overview,” International Journal of Computer Integrated Manufacturing, vol. 31, no. 3, pp. 243–261, 2018.
[3] C. B. Williams, J. K. Cochran, and D. W. Rosen, “Additive manufacturing of metallic cellular materials via three-dimensional printing,” The International Journal of Advanced Manufacturing Technology, vol. 53, no. 1-4, pp. 231–239, 2011.
[4] Zanini, F., Pagani, L., Savio, E., Carmignato, S. (2019). Characterisation of additively manufactured metal surfaces by means of X-ray computed tomography and generalised surface texture parameters. CIRP Annals, 68(1), 515-518.
[5] A. Triantaphyllou, C. L. Giusca, G. D. Macaulay, F. Roerig, M. Hoebel, R. K. Leach, B. Tomita, and K. A. Milne, “Surface texture measurement for additive manufacturing,” Surface Topography: Metrology and Properties, vol. 3, no. 2, p. 024002, 2015. [6] A. Thompson, N. Senin, C. Giusca, and R. Leach, “Topography of selectively laser melted surfaces: a comparison of different
measurement methods,” CIRP Annals, vol. 66, no. 1, pp. 543–546, 2017.
[7] S. Van Bael, G. Kerckhofs, M. Moesen, G. Pyka, J. Schrooten, and J.-P. Kruth, “Micro-ct-based improvement of geometrical and mechanical controllability of selective laser melted ti6al4v porous structures,” Materials Science and Engineering: A, vol. 528, no. 24, pp. 7423–7431, 2011.
[8] C. Yan, L. Hao, A. Hussein, and D. Raymont, “Evaluations of cellular lattice structures manufactured using selective laser melting,” International Journal of Machine Tools and Manufacture, vol. 62, pp. 32–38, 2012.
[9] T. B. Kim, S. Yue, Z. Zhang, E. Jones, J. R. Jones, and P. D. Lee, “Additive manufactured porous titanium structures: Through-process quantification of pore and strut networks,” Journal of Materials Processing Technology, vol. 214, no. 11, pp. 2706–2715, 2014.
[10] M. B. Bauza, S. P. Moylan, R. M. Panas, S. C. Burke, H. E. Martz, J. S. Taylor, P. Alexander, R. H. Knebel, R. Bhogaraju, M. O’Connell, et al., “Study of accuracy of parts produced using additive manufacturing,” in ASPE Spring Topical Meeting: Dimensional Accuracy and Surface Finish in Additive Manufacturing, Berkeley, CA, Apr, pp. 13–16, 2014.
[11] S. Moylan, “Progress toward standardized additive manufacturing test artifacts. achieving precision tolerances in additive manufacturing,” in ASPE 2015 spring topical meeting, 2015.
[12] G. Pyka, A. Burakowski, G. Kerckhofs, M. Moesen, S. Van Bael, J. Schrooten, and M. Wevers, “Surface modification of ti6al4v open porous structures produced by additive manufacturing,” Advanced Engineering Materials, vol. 14, no. 6, pp. 363–370, 2012. [13] G. Kerckhofs, G. Pyka, M. Moesen, S. Van Bael, J. Schrooten, and M. Wevers, “High-resolution microfocus x-ray computed tomography for 3d surface roughness measurements of additive manufactured porous materials,” Advanced Engineering Materials, vol. 15, no. 3, pp. 153–158, 2013.
[14] A. Townsend, L. Blunt, and P. J. Bills, “Investigating the capability of microfocus x-ray computed tomography for areal surface analysis of additively manufactured parts,” 2016.
[15] Thompson, A., Senin, N., Maskery, I., Körner, L., Lawes, S. and Leach, R., 2018. Internal surface measurement of metal powder bed fusion parts. Additive Manufacturing, 20, pp.126-133.
[16] Hermanek, P., Rathore, J. S., Aloisi, V., & Carmignato, S. (2018). Principles of X-ray computed tomography. In Industrial X-Ray Computed Tomography (pp. 25-67). Springer, Cham.
[17] Villarraga-Gómez, H., Lee, C., & Smith, S. T. (2018). Dimensional metrology with X-ray CT: A comparison with CMM measurements on internal features and compliant structures. Precision Engineering, 51, 291-307.
[18] Kruth, J. P., Bartscher, M., Carmignato, S., Schmitt, R., De Chiffre, L., & Weckenmann, A. (2011). Computed tomography for dimensional metrology. CIRP annals, 60(2), 821-842.
[19] Kraemer, A., Kovacheva, E., & Lanza, G. (2015). Projection based evaluation of CT image quality in dimensional metrology. Proc. digital industrial radiology and computed tomography (DIR).
[20] Reiter, M., Krumm, M., Kasperl, S., Kuhn, C., Erler, M., Weiß, D., ... & Kastner, J. (2012, September). Evaluation of transmission based image quality optimisation for X-ray computed tomography. In Conference on Industrial Computed Tomography (ICT), Sept (pp. 241-250).
[21] Deutsches Institut für Normung, ‘DIN EN 16016 - Zerstörungsfreie Prüfung- Durchstrahlungsverfahren Computertomographie‘. Beuth Verlag GmbH, Berlin, 2011.
[22] CIVA (2017), The simulation and analysis platform for NDE, http://www.extende.com/
[23] Villarraga-Gómez, H., & Smith, S. T. (2015). Optimal specimen orientation in cone-beam X-ray CT systems (for dimensional metrology). In 30th ASPE Annual Meeting.