HAL Id: hal-01607721
https://hal.archives-ouvertes.fr/hal-01607721
Submitted on 26 May 2020
HAL is a multi-disciplinary open access
archive for the deposit and dissemination of sci-entific research documents, whether they are pub-lished or not. The documents may come from teaching and research institutions in France or abroad, or from public or private research centers.
L’archive ouverte pluridisciplinaire HAL, est destinée au dépôt et à la diffusion de documents scientifiques de niveau recherche, publiés ou non, émanant des établissements d’enseignement et de recherche français ou étrangers, des laboratoires publics ou privés.
Evidencing 98 secondary metabolites of Penicillium
verrucosum using substrate isotopic labeling and
high-resolution mass spectrometry
Thaïs Hautbergue, Olivier Puel, Souria Tadrist, Lauriane Meneghetti, Michel
Péan, Marcel Delaforge, Laurent Debrauwer, Isabelle P. Oswald, Emilien L.
Jamin
To cite this version:
Thaïs Hautbergue, Olivier Puel, Souria Tadrist, Lauriane Meneghetti, Michel Péan, et al.. Evi-dencing 98 secondary metabolites of Penicillium verrucosum using substrate isotopic labeling and high-resolution mass spectrometry. Journal of Chromatography B - Analytical Technologies in the Biomedical and Life Sciences, Elsevier, 2017, in press, �10.1016/j.jchromb.2017.03.011�. �hal-01607721�
Version postprint
Accepted Manuscript
Title: Evidencing 98 secondary metabolites of Penicillium
verrucosumusing substrate isotopic labeling and
high-resolution mass spectrometry
Authors: Tha¨ıs Hautbergue, Olivier Puel, Souria Tadrist, Lauriane Meneghetti, Michel P´ean, Marcel Delaforge, Laurent Debrauwer, Isabelle P. Oswald, Emilien L. Jamin
PII: S1570-0232(17)30403-8
DOI: http://dx.doi.org/doi:10.1016/j.jchromb.2017.03.011
Reference: CHROMB 20505
To appear in: Journal of Chromatography B Received date: 27-10-2016
Revised date: 6-3-2017 Accepted date: 10-3-2017
Please cite this article as: Tha¨ıs Hautbergue, Olivier Puel, Souria Tadrist, Lauriane Meneghetti, Michel P´ean, Marcel Delaforge, Laurent Debrauwer, Isabelle P.Oswald, Emilien L.Jamin, Evidencing 98 secondary metabolites of Penicillium verrucosum using substrate isotopic labeling and high-resolution mass spectrometry, Journal of Chromatography B http://dx.doi.org/10.1016/j.jchromb.2017.03.011
This is a PDF file of an unedited manuscript that has been accepted for publication. As a service to our customers we are providing this early version of the manuscript. The manuscript will undergo copyediting, typesetting, and review of the resulting proof before it is published in its final form. Please note that during the production process errors may be discovered which could affect the content, and all legal disclaimers that apply to the journal pertain.
Version postprint
Evidencing 98 secondary metabolites of Penicillium verrucosum using
substrate isotopic labeling and high-resolution mass spectrometry
Thaïs Hautberguea,b, Olivier Puela,*, SouriaTadrista, Lauriane Meneghettia,b, Michel Péanc,d,e, Marcel Delaforgef, Laurent Debrauwera,b, Isabelle P. Oswalda, Emilien L. Jamina,b
a Toxalim, Université de Toulouse, INRA, INP-ENVT, INP-EI-Purpan, Univ. Toulouse 3 Paul Sabatier, 31027 Toulouse,
France
b Axiom Platform, MetaToul-MetaboHUB, National Infrastructure for Metabolomics and Fluxomics, 31027 Toulouse, France c Groupe de Recherches Appliquées en Phytotechnologie, CEA, IBEB, Cadarache, FR 13108 Saint-Paul-les-Durance, France d UMR Biologie Végétale et Microbiologie Environnementale, CNRS, FR 13108 Saint-Paul-les-Durance, France
e Université d’Aix-Marseille, FR 13007 Marseille, France
f CNRS, URA 2096, CEA Saclay, FR 91191 Gif sur Yvette, France
* Corresponding author: olivier.puel@toulouse.inra.fr
Highlights
Double stable isotope labeling of substrate for labeling the fungal metabolites
Evidencing of 98 secondary metabolites produced by Penicillium verrucosum on wheat
82 unknown secondary metabolites detected on Penicillium verrucosum by HPLC-HRMS
Detailed MS and MS/MS data of all detected unknown metabolites
ABSTRACT: Industrial applications of fungal compounds, coupled with the emergence of fungal threats
to natural ecosystems and public health, have increased interest in filamentous fungi. Among all
pathogenic fungi, Penicillium verrucosum is one of the most common mold-infecting stored cereals in
temperate regions. However, it is estimated that 80% of fungal secondary metabolites remain unknown.
Version postprint
grown on wheat grains labeled with stable isotopes: (i) natural grains (99% 12C); (ii) grains enriched with
97% of 13C; and (iii) grains enriched with 53% of 13C and 97% of 15N. Analyses performed by
high-performance liquid chromatography coupled with high-resolution mass spectrometry (HPLC−HRMS)
enabled the specific detection of fungal metabolites, and the unambiguous characterization of their
chemical formulas. In this way, 98 secondary metabolites were detected and their chemical formulas were
determined. Of these, only 18 identifications could be made based on databases, the literature and mass
spectrometry fragmentation experiments, with the result that 80 were totally unknown. Molecular
networks were generated to analyze these results, leading to the characterization by MSn experiments of
a new fungisporin produced by P. verrucosum. More generally, this article provides precise mass
spectrometric data about all these compounds for further studies of the Penicillium metabolome.
Key words: fungus; Penicillium verrucosum; mass spectrometry; stable isotope labeling; secondary
metabolite; molecular networking
1. Introduction
Filamentous fungi are well-known for their ability to produce a wide range of secondary
metabolites. These molecules are mostly involved in fungal defense and environmental adaptation systems
[1]. Since the discovery of penicillin as the first antibiotic of fungal origin used for human health [2],
natural compounds have attracted great interest in a variety of industrial areas. Today, 42% of the
metabolites adapted for human health applications are derived from fungal compounds [3]. In the
agri-food field, they are commonly used as plant-growth hormones [4] or agri-food additives [5]. On the other hand, fungal secondary metabolites known as ‘mycotoxins’ produce deleterious effects directly on their vegetal
hosts, but also indirectly through human food or livestock feed contamination. Mycotoxins are considered
the most important chronic dietary risk factor, higher than pesticide residues [6]. Various types of toxicity
are associated with fungal metabolites. Some of them display carcinogenic potential, such as aflatoxin,
Version postprint
which is involved in reproductive disorders of farm animals and in hyperestrogenic syndromes in humans
[9]. Moreover, contaminations by mycotoxins produce major economic consequences, due to the
destruction of crops and stocks [10]. Today, although several hundreds of secondary metabolites are
characterized as mycotoxins and about 30 are considered of human and animal health concern, only six
of them are regulated. Furthermore, fungal genome observations suggest that 80% of their secondary
metabolome remains unknown, highlighting the great proportion of compounds still to be discovered [11].
Penicillium verrucosum is one of the most common molds infecting stored cereals in temperate
regions [12]. Its ability to grow at mild temperatures can lead to the infection of grains during their storage,
particularly in case the drying or re-moistening process fails [8,13]. In Canada, annual economic losses
due to the elimination and destruction of infected cereals stocks are estimated to be over 260 million
Canadian dollars [14]. Moreover, ochratoxin A, the major mycotoxin of P. verrucosum, is considered to
be the most potent renal carcinogen of natural origin [15], and is classified as a possible human carcinogen
(Group 2B) [16]. According to some studies, ochratoxin A could be the cause of Balkan Endemic
Nephropathy (BEN), a fatal disease first recorded in 1956 [17–19]. Some other secondary metabolites of
P. verrucosum have been characterized, such as citrinin (nephrotoxic) and ochratoxin B (an unchlorinated
intermediate of ochratoxin A biosynthetic pathway), which are considered as mycotoxins, and some
metabolites belonging to the families of verrucolones and verrucines [20].
Among the relevant analytical techniques for the characterization of secondary metabolites,
untargeted metabolomics using High-Resolution Mass Spectrometry (HRMS) are particularly interesting
[21]. This technique enables the detection of both known and unknown metabolites, and the determination
of their exact mass, and contributes to their structural identification. However, data interpretation remains
complex due to the non-specific detection of compounds including both metabolites and contaminants,
and the difficulty of achieving unambiguous chemical formulas, even with highly accurate mass
measurement [22]. To overcome these difficulties, a number of original analytical approaches using stable
Version postprint
strategy for the specific detection of the metabolites, as well as for the characterization of the global
biochemical composition of biological samples [23]. One SIL strategy consists of growing a fungus on
the non-labeled glucose medium (12C) as well as on the fully 13C labeled glucose. The two extracts are
then pooled and analyzed by High-Performance Liquid Chromatography (HPLC) coupled with HRMS
[24,25]. The detection of two mirror isotopic distributions enables the rapid determination of the number
of carbon atoms in all the detected fungal metabolites, facilitating the determination of their chemical
formula. However, for high-molecular weight compounds, a single isotope labeling might not be enough
to obtain a unique chemical formula and another stable isotope labeling would be required.
Moreover, fungi modulate the synthesis of their secondary metabolites depending on their needs
for the medium colonization. This principle, commonly called OSMAC (One Strain Many Compounds),
means that every small change in growth conditions can completely alter the fungal secondary
metabolism. This implies that the fungal metabolome should be studied in culture conditions as close as
possible to its natural growth environment [26]. As stressed by Hallas-Moller et al. [27], the study of
cereal-associated species such as P. verrucosum has indeed been chemically investigated, but only by
outdated analytical systems and on laboratory culture media. Thus, a SIL method based on the growth of
plant pathogens on labeled cereals was previously developed in our laboratory [28]. To avoid the formula
ambiguity for high-molecular weight metabolites, two isotopic labelings were used by the HPLC-HRMS
analysis of carbon 13 (13C) and nitrogen 15 (15N) labeled wheats. Below, following the successful
validation of the method on the well-documented metabolism of Aspergillus fumigatus [28], we present
the application to the saprophytic fungus P. verrucosum, with the aim of detecting unknown metabolites
produced during wheat grain contamination.
2. Materials and Methods
Version postprint
The formic acid, and solvents used for sample preparation (ethyl acetate and methanol) and for the
analyses (acetonitrile) were purchased from Fisher Scientific (Thermo Fisher Scientific, Illkirch, France).
The ethyl acetate and methanol were HPLC grade and the acetonitrile was MS (mass spectrometry) grade.
Ultrapure water was generated from a Milli-Q system (Millipore, Saint Quentin en Yvelines, France).
Standards of ochratoxin A, citrinin and cyclopiazonic acid were purchased from Sigma (Sigma-Aldrich,
Saint-Quentin Fallavier, France), and ochratoxin B was purchased from Fermentek (Fermentek Ltd,
Jerusalem, Israel).
2.2. Identification of Penicillium verrucosum.
The study was performed on the strain NRRL 5571. Morphological identification was performed as
recommended in the monograph of the Penicillium genus [29]. Genomic identification was conducted
after DNA extraction. After 5 days of culture on YES medium (2.5 g of yeast extract, 10 g of glucose and
500 ml of distilled water), fungal DNA was extracted. After grinding, the mycelium was incubated in an
extraction buffer (CTAB 1%, Tris-HCl pH 8 100 mM, EDTA pH8 20 mM and NaCl 1.4 M)., Chloroform,
phenol, and isopropanol were successively added. The pellet was washed with ethanol 70% and suspended
in water. Amplification was performed with ITS (ITS 4 and 5) and β-tub (a and b) primers according to
Adjovi et al. [30] and the PCR result was subjected to gel electrophoresis. Each isolated fragment was
then purified with a GenElute PCR Clean-Up Kit (Sigma-Aldrich) and the DNA concentrations were
measured with Nanodrop (ND-1000 program, Thermo Fisher Scientific, Illkirch, France). Then, they were
sequenced by the dye terminator technology on an AB3130XL sequencer (Applied Biosystems). The
DNA sequences of ITS and β-tubulin genes were finally compared by sequence alignment and deposited
in GenBank under KY347870 and KY347871 accession numbers respectively.
2.3. Production of 13C- and 13C/15N Labeled Wheats
Uniform isotopic enrichments were performed on the variety Caphorn of Triticum aestivum as
Version postprint
chambers (750 L) during a complete growth cycle, i.e. 6 months, with 13C-labeled CO2 and 15N-labeled
nitrate and ammonium salts: one nearly 100% 13C enriched wheat (referred to as 13C wheat) and one nearly
50% 13C and nearly 100% 15N wheat (referred to as 13C/15N wheat). The isotopic enrichments were
measured with a Delta V Advantage isotope ratio mass spectrometer (Thermo Fisher Scientific, Illkirch,
France): 96.8% ± 0.15% for the 13C wheat, 53.4% ± 0.3% 13C and 96.8% ± 0.07% 15N for the 13C/15N
wheat.
2.4. Fungal Strain and Growth Conditions
The natural and labeled wheat grains were soaked in water and autoclaved twice. The water activity
(aw) of the grains was then measured with an HC2-AW measurement device (Rotronik AG, Basserdorf,
Switzerland), and sterile water was added where necessary to reach an aw of 0.98 before inoculation.
Thirty grams of each type of sterilized labeled wheat grains were placed in thin layers into sterile 140 mm
diameter Petri dishes (Sarstedt, Marnay, France) to create a total of 4 culture media: one dish with 13C
wheat, one dish with 13C/15N wheat and two dishes with 12C wheat. The first three plates were inoculated
with 250 µL of a spore solution (at 105 spore/mL) prepared from the PDA culture of the fungus. The
second 12C wheat Petri plate was used as a control and incubated in the same conditions as the other
samples but without fungus. The fungal cultures were then placed in the dark without shaking for 1 month
at 25°C.
2.5. Metabolite Extraction
After incubation, the content of each Petri dish (wheat grains and mycelium) was extracted with 200
mL of ethyl acetate. After 36 h of shaking on a shaking table IKA Labor technik HS501 (IKA, Staufen,
Germany) at 180 rpm, the extract was filtered and evaporated to dryness. The resulting residue was dissolved in 400 μL of methanol and filtered with 0.45 μm Whatman filters (Whatman, GE Healthcare,
Kent, U.K.) before HPLC−HRMS analysis.
Version postprint
The extracts were analyzed by High-Performance Liquid Chromatography (HPLC) using an Ultimate
3000 system (Thermo Fisher Scientific, Les Ulis, France). A gradient program of 0.1% formic acid in
water (phase A) and 100% acetonitrile (phase B) was used as follows (flow rate, 0.2 mL/min): 0 min 20%
of B, 30 min 50% of B, from 35 to 45 min 90% of B, from 50 to 60 20% of B. A volume of 10 µL was
injected on a reversed-phase Luna C18 column (150 mm × 2.0 mm, 5 μm) (Phenomenex, Torrance, CA,
U.S.A.). HPLC was coupled to a LTQ Orbitrap XL hybrid high-resolution mass spectrometer (Thermo
Fisher Scientific, Les Ulis, France) using electrospray ionization (ESI) in the positive and negative modes.
The ionization parameters were as follows: spray voltage +4.5 kV, capillary temperature 350 °C, sheath
gas (N2) flow rate 40 au (arbitrary units), auxiliary gas (N2) flow rate 6 au for the positive mode, and spray
voltage −3.7 kV, capillary temperature 350 °C, sheath gas flow rate 30 au (N2), auxiliary gas flow rate 10
au (N2) for the negative mode. The full HRMS spectra were acquired at a resolution of 60,000 from m/z
50 to m/z 800. The high-resolution mass analyzer was calibrated in each ionization mode based on the supplier’s protocol and calibration mixtures (Thermo Fisher Scientific, Les Ulis, France). The targeted
MS/MS spectra were performed according to the following parameters: [Parameters for MS/MS by
collision-induced dissociation (CID): resolution= 7500, MSn maximum ion time= 200 ms, isolation
width= 1.5 Da, Act. Q= 0.250 and activation time= 30 ms]. [Parameters for MS/MS by higher energy
collision dissociation (HCD): resolution= 7500, MSn maximum ion time= 200 ms, isolation width= 1.5
Da and activation time= 30 ms]. HCD and CID energies were adjusted to obtain appropriate fragmentation
and maximum structural information. Since the analyses were performed to identify metabolites from a
strictly qualitative point of view, neither quality control samples, nor replicates were necessary.
Analysis by HPLC coupled with diode-array-detection (Ultimate 3000 system, Thermo Fisher
Scientific, Les Ulis, France) were performed to identify anacine. The chromatographic system and
parameters were the same as for HPLC-HRMS analyses. The presence of anacine was monitored at a
wavelength of 220 nm.
Version postprint
Comparisons of proposed 12C, 13C and 13C15N formulas were performed thanks to the MassCompare
program developed in-house (http://www.toulouse.inra.fr/axiomm) using a measurement accuracy of 5
ppm. C, H, O, N, S, P, Cl, K and Na were the only accepted elements.
Identifications of metabolites were classified according to the Metabolomics Standard Initiative
[32]. Metabolites identified at level 1 in our results displayed the same retention time, chemical formula
and MS/MS fragmentation pattern as the standard compound (section 2.1) measured in a parallel analysis
in the same analytical conditions. The metabolites identified at level 2 in our results displayed an MS/MS
or UV spectrum in accordance with the bibliography. The metabolites annotated as compounds known to
be produced by P. verrucosum and presenting coherent MS/MS spectra were identified at the level 3A.
The metabolites annotated as compounds never characterized on P. verrucosum and presenting coherent
MS/MS spectra were identified at the level 3B. Complementary in silico fragmentations were performed
using CFM-ID [33] and compared with experimental MS/MS spectra of annotated metabolites of level 3.
A molecular network generated using GNPS [34] was created from MS/MS spectra in the CID mode
of all annotated secondary metabolites. The software parameters were set as follows: ion mass tolerance=
0.0036 Da, cosine score= 0.7, minimum match fragment ion= 1, maximum connected components= 100
and Top-K= 100, filter peaks removed. The resulting molecular network was visualized in Cytoscape
2.8.2 [35].
3. Results and Discussion
3.1.Certification of Penicillium verrucosum
The identification of fungal strains could be problematic for secondary metabolome studies due to
the lack of robust classification criteria [20], despite the availability of genetic classification. For example,
species such as Penicillium nordicum and P. verrucosum were considered as Penicillium viridicatum for
some time and some of their secondary metabolites are still referenced as P. viridicatum compounds,
Version postprint
crucial for our study to ensure the identification of P. verrucosum. Three different approaches were
investigated. Firstly, a morphological characterization was achieved and displayed both macroscopic and
microscopic Penicillium properties, namely terverticillate conidiophores, rough-walled and globose
conidia. At this stage, no differentiation could be made between P. verrucosum and P. nordicum as these
two species display the same characteristics. Then, cultures on YES agar were performed and showed a
red-brown reverse color characteristic of P. verrucosum under some sporulation areas. This observation
is the only morphological point enabling differentiation between P. verrucosum and P. nordicum [29].
Secondly, the fungal secondary metabolite analysis achieved by HPLC-HRMS led to the identification of
ochratoxin A and citrinin, which were validated by comparison with the standards. Ochratoxin A is known
to be produced by both P. nordicum and P. verrucosum but, according to the Penicillium classification of
Larsen et al. [20], only P. verrucosum is known to produce citrinin in addition to ochratoxin A. Finally, a
genetic identification was conducted. Since Samson et al. [36] estimated that β-tubulin sequences are
relevant species markers, we compared the β-tubulin DNA sequences of the studied fungus with the
standard sequences of P. verrucosum and P. nordicum. As a result, β-tubulin sequences showed strong
similarities with those of P. verrucosum. ITS DNA sequences are well-conserved sequences also used as
species markers in fungal studies. Comparison of the ITS sequences confirmed the strong similarity
between the studied strain (NRRL 5571) and the standard sequences of P. verrucosum. To conclude, the
three identification steps (morphological observations, metabolite characterizations and genetic
validation) were in accordance with the identification of P. verrucosum. NRRL 5571 was also classified
as P. verrucosum by Larsen et al. in a study characterizing 48 P. verrucosum strains [20].
3.2.HPLC-HRMS Analysis of the Three Wheat Cultures
The characterization of the fungal secondary metabolome was carried out according to the protocol
previously developed in our group [28]. Natural wheat, 13C wheat and 13C15N wheat were infected with
P. verrucosum under adapted culture conditions (i.e. culture in the dark at 25°C for 30 days). A control
Version postprint
metabolites were then extracted and the samples analyzed separately by HPLC-HRMS. The extracts were
not pooled in order to limit the complexity of MS spectra due to the complex isotopic compositions used
in our protocol and to avoid possible overlapping signals despite the high-resolution power provided by
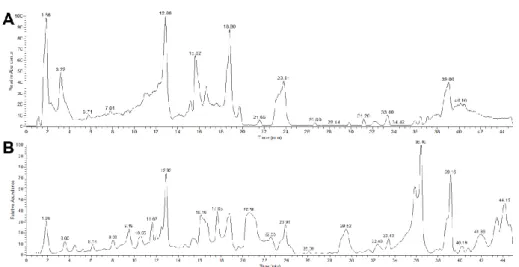
the Orbitrap analyzer. The total ion current chromatograms obtained in the positive and negative
ionization modes are presented in Figure 1. First, the chromatogram and mass spectrum obtained from the
13C15N labeling experiment were analyzed to specifically detect all the secondary metabolites. The
isotopic labeling with 50% 13C and 100% 15N provides an easily recognizable signal, since it generates a
specific ion pattern corresponding to a normal distribution of 12C/13C on the mass spectrum (Figure 2C).
These specific signals could be exclusively attributed to either the labeled substrate or the fungal
metabolites, enabling the removal of any contaminant or chemical used during incubation or extraction.
Here, 91 and 130 specific isotopic patterns were detected by positive (ESI+) and negative (ESI-)
electrospray ionization modes respectively. Among these signals, 33 adducts and in-source fragment ions
were rejected in the ESI+ mode (68 were rejected for the ESI - mode) in order to consider only molecular
ions for each secondary metabolite [37]. This led to a final listing of 58 signals in the positive ionization
mode and 62 in the negative mode. The same approach was applied to the 13C labeling experiment, in
which secondary metabolites displayed another specific pattern (Figure 2B) due to the 3% of remaining
12C. For each previously detected 13C15N labeled ions, the 13C equivalent signal was found in HRMS
spectra. Each secondary metabolite was finally searched in the HRMS spectra obtained from the natural
12C experiment (Figure 2A). To validate the detection of similar metabolites in the three parallel
HPLC-HRMS analyses (12C, 13C and 13C15N), chromatographic retention times and MS/MS spectra were
compared. As displayed in Figure 2, MS/MS spectra were conducted on precursor ions detected at the
same retention time (26.7 min in the example given in Figure 2), evidencing that the same metabolite was
detected in the three labeled substrates. Finally, wheat molecules were rejected by comparing extract and
control samples. In this way, 3 and 13 compounds were eliminated from the ESI+ and ESI - results,
respectively. A final list of the 98 secondary metabolites detected from P. verrucosum is reported in Table
Version postprint
For further identification of the detected metabolites, the first step was the determination of their
chemical formulas. Each secondary metabolite, measured m/z in 12C, 13C and 13C15N extracts was
compared using MassCompare, a software developed in-house. This tool calculates all the possible
chemical formulas for each 12C, 13C and 13C15N metabolites, selects the common ones, and calculates the
number of carbon and nitrogen atoms by subtractions between 12C, 13C and 13C15N m/z values. In this way,
MassCompare provides the unique chemical formula of each metabolite. Concerning the example
illustrated in Figure 2, the mass difference between the m/z ratio of the 12C ion (m/z 370.1285) and the 13C-labeled ion (m/z 390.1951) was used to determine the number of carbon atoms (n
C= 20). The mass
differences between the m/z of the 12C ion, the 13C-labeled ion and the 13C/15N-labeled ion (m/z 382.1667)
enabled the calculation of the number of nitrogen atoms (nN= 1) by MassCompare. With this information,
the software determined a single chemical formula per metabolite (C20H19O6N for the example of Figure
2). As displayed in Table 1, the metabolite formulas are almost homogenous in terms of heteroatom
composition with a majority of oxygenated structures, and only seven non-oxygenated metabolites. Over
half of the 98 metabolites contain at least one nitrogen atom. These observations were in agreement with
the general composition of fungal secondary metabolites. These extrolites are synthesized by two major
types of enzymes. The first, polyketide synthases (PKS), synthesize secondary metabolites from acetyl or
malonyl groups to generate oxygenated compounds [38]. The second, nonribosomal peptide-synthetases
(NRPS) ensure the incorporation of amino acids, leading to the synthesis of nitrogenous secondary
metabolites. Among all detected metabolites, only three display other heteroatoms: one chlorinated and
two sulfured formulas. The chlorinated compound was identified as the well-known ochratoxin A. To the
best of our knowledge, it is the first time that sulfur containing metabolites has been detected in P.
verrucosum.
3.3.Dereplication of Known Secondary Metabolites
Experimental MS/MS spectra were compared with the open-access GNPS library of natural
Version postprint
to allow its identification. Alternatively, the database of natural compounds Antibase (2012) [39], coupled
with the literature on fungal secondary metabolites, was used to successfully annotate several compounds
according to their chemical formulas.
Ochratoxin A (compound 1 in Figure 3) is considered as the major toxin of P. verrucosum involved
in the sanitary and economic troubles caused by this fungus [40,41]. This metabolite was suspected to be
detected at 32.4 min at m/z 404.0897 with a chlorinated isotopic pattern after positive ionization of the
12C sample. Separate observation of the 12C spectrum, with consideration of the chlorine atom, led to eight
possibilities of chemical formulas using the nitrogen rules. The comparison of the three lists of possible
formulas from the three different wheat cultures and calculation of the number of carbon and nitrogen
atoms finally led to a unique chemical formula: C20H19O6NCl. This result was confirmed by corresponding
data obtained in the negative mode. The comparison of chromatographic and MS/MS patterns of the
metabolite with those of the standard of ochratoxin A validated the identification at level 1 [32] (see
section 2.7). Similarly, analysis of the standard of citrinin, a well-known P. verrucosum metabolite
(compound 3 in Figure 3) [20,42], confirmed its production by the studied strain. Ochratoxin B
(compound 2 in Figure 3) was also identified at a level 1 (C20H20O6N) at RT= 26.7 min, in accord with
other works which noticed the excretion of this dechlorinated intermediate of the biosynthesis pathway of
ochratoxin A by P. verrucosum [20,29]. Cyclopiazonic acid, never observed in P. verrucosum, was
proposed for annotation of the metabolite C20H20O3N2 but the chromatographic and MS/MS results
obtained from the reference compound ruled out this hypothesis.
Since many natural products are unavailable as reference compounds [37], some secondary
metabolites already known to be produced by P. verrucosum were detected without it being possible to
validate their identifications. The quinazolines verrucine A (compound 6 in Figure 3) [20,43], verrucine
B (compound 7 in Figure 3) [20,43] and verrucine F (compound 9 in Figure 3) [44] were annotated. Their
MS/MS spectra displayed a loss of ammonia and a consecutive loss of carbon monoxide in accordance
Version postprint
B have already been reported [43], allowing the identification of verrucines A and B at a level 2. Since
standards were not available, in silico fragmentations were also performed using CFM-ID [33]. Although
it should not be considered as proof of identification, this innovative tool provides relevant supporting
information. The comparison between experimental and simulated MS/MS spectra is shown in Figure 4A
for the formally identified ochratoxin B as an example of successful simulation. Application of CFM-ID
to the putative quinazoline structures showed that in silico spectra were in accord with the annotation of
the three verrucines. Indeed, the same two major fragment ions at m/z 360.2 and m/z 332.2 were detected
in both experimental and in silico MS/MS spectra of verrucines A and B (Figure 4B). The same result
was obtained with the annotated verrucine F (m/z 375.1450), which shared two fragment ions at m/z 358.2
and m/z 330.2 with the simulated MS/MS spectrum (Figure 4C). Verrucolone, also known as arabenoic
acid (compound 5 in Figure 3) and referenced as a typical P. verrucosum metabolite [45], was attributed
to the detected C6H10O4 formula. The experimental MS/MS spectrum was compared to CFM-ID
simulations and some common fragment ions were observed at m/z 129.0, 117.0, 115.0 and 103.0.
Verrucine F and verrucolone were therefore identified with a level 3A (see section 2.7).
Some secondary metabolites detected in our extracts have already been characterized in
Penicillium fungi but not in the P. verrucosum strain. Unfortunately, no standards of these supposed
secondary metabolites were available. In this case, the only supporting information came from the MS/MS
or UV spectra available from the literature and from comparison with in silico fragmentations. Anacine
(compound 8 in Figure 3) is known to be produced by Penicillium nordicum, one of the closest fungi of
P. verrucosum [20]. This compound is a quinazoline belonging to the verrucines family [46]. In this study,
anacine was identified at a level 2 since its UV spectrum was in accordance with the spectrum from
literature [43]. Moreover, the unsaturated analog of anacine, namely aurantiomide C (compound 10 in
Figure 3) was proposed for the annotation of C18H2103N4. To our knowledge, this secondary metabolite
was characterized in Penicillium aurantiogriseum [47] but never in P. verrucosum. Although its MS/MS
spectrum was not available in literature, an in silico simulation was performed and compared with the
Version postprint
same way, brevianamide F (compound 11 in Figure 3), a metabolite of Penicillium brevicompactum [39]
and a precursor of fumitremorgins in Aspergillus fumigatus [48], was proposed for the annotation of
C16H17O2N3. In this case again, no MS/MS information was available in the literature, and the in silico
MS/MS simulation displayed almost all the fragment ions observed on the experimental spectrum. LL-P880β (compound 4 in Figure 3), another Penicillium metabolite whose fragmentation pattern was not
published, was suspected based on database researches [39]. This pestalotin analog, also named
hydroxy-pestalotin, was reported to be synthesized by Penicillium sp. without any precision about the species [39].
Moreover, in a study of the pestalotins family, Rahbaek et al. reported that PC-2, LL-P880γ and two
verrucosapyrones displaying very similar structures, were secreted by several strains of P. verrucosum
[45]. Consequently, P. verrucosum likely forms part of the Penicillium species able to produce LL-P880β.
Finally, several cyclic tetrapeptides of the fungisporin family were suspected to be produced by P.
verrucosum. Indeed, the metabolite C28H36O6N4 showed a fragmentation pattern in accordance with a
tetrapeptide structure and was identified as fungisporin C (compound 12 in Figure 3). This natural
compound was previously described by Klitgaard et al. in Aspergillus nidulans but the study did not report
the fragmentation spectrum [49]. Furthermore, the degradation products of fungisporin A (compound 13
in Figure 3), fungisporin B (compound 14 in Figure 3), fungisporin D (compound 15 in Figure 3) and
cyclo-(Tyr-Trp-Val-Val) (compound 16 in Figure 3) were observed. The MS/MS spectrum of the
degradation products of fungisporin A was presented by Ali et al. in their study characterizing
fungisporins in Penicillium chrysogenum [50]. It was therefore possible to identify at a level 2 the
compound 13 (Table 1) as a hydrolysis product of fungisporin A.
3.4. Unknown Secondary Metabolites
Finally, 85 formulas could not be associated with known Penicillium secondary metabolites. This
observation is in accord with the estimation based on genomic data claiming that more than 80% of fungal
secondary metabolomes remain uncharacterized [11]. All detected secondary metabolites are listed in
Version postprint
generated from each secondary metabolite by higher energy collision dissociation (HCD) (Table 2) as
well as by collision-induced dissociation (CID) (Table S1, supplementary data) are provided together with
their relative intensity. This complementary information is presented as an argument for further studies
into these secondary metabolites. CID and HCD modes provide complementary information useful for
structural analyses of fungal secondary metabolites. The resonant excitation mode used in CID within the
linear ion trap rarely leads to consecutive fragmentations, whereas the non-resonant excitation of HCD
could generate this kind of informative fragmentations. On the other hand, the CID mode is useful to study
the filiation between the fragment ions formed in the consecutive MSn experiments. Unlike CID, the HCD
mode is carried out without the low mass cut-off restriction, allowing the detection of low mass fragment
ions.
In Table 1, several metabolites, including those identified, present the same chemical formula but
are detected at different retention times. Since two isomers may display very different structures, MS/MS
experiments were carried out. Two metabolites with the chemical formula C18H20N4O3 were detected in
the positive ionization mode (Table 1: PVer_341.16_20.1 and PVer_341.16_15.1). This formula was
annotated as aurantiomide C (compound 10 in Figure 3), and the two isomers displayed very similar
MS/MS spectra (three same fragment ions in similar relative abundances, Table 2). Similarly, two isomers
of C18H22N4O3 with very similar MS/MS spectra and UV spectra (data not shown) (Table 2) were detected
in positive ionization mode and annotated as anacine (compound 8 in Figure 3) (Table 1:
PVer_343.17_12.7 and PVer_343.17_17.9).
Conversely, several metabolites with different molecular weights may share a common structure.
For example, C6H10O4, annotated by Antibase as verrucolone (PVer_147.06_3.1), and C6H8O3
(PVer_129.05_7.6) shared three common ions observed in their MS/MS spectra (Table 2), including two
specific fragmentations: m/z= 97.0280 and m/z= 87.0437. The metabolite C6H8O3 (PVer_129.05_7.6) was
Version postprint
To overcome the complex manual comparison of hundreds of fragmentation patterns, some
bioinformatics tools are available, such as MS2LDA [51] or the GNPS Molecular Networking system
[34] which was developed for the study of natural products. This latter system highlights ions according
to the similarity of their MS/MS spectra. In this way, a molecular network was generated from the MS/MS
spectra of all annotated secondary metabolites (Figure 5). This network displays already detected similar
compounds such as ochatoxins A and B, or isomers, and ions linked through non-specific neutral losses:
H2O between ochratoxin B and the node 299.09 or NH3 and CO between verrucines and the node 391.14.
The other groups consist of unknown molecules with the same formula.
More interestingly, the two metabolites at m/z= 511.29 shared seven common ions, suggesting a
high similarity. The corresponding fragmentation patterns were scrutinized to explain the structural
differences between the compound at RT= 18.0, annotated as the hydrolyzed fungisporin A, and the
metabolite at RT= 18.7. The MS/MS spectra of the two metabolites are shown in Figure 6. MS3 and MS4
experiments were performed to validate that the common ions displayed the same structure, and to obtain
more structural information (Figure S2). Both the MS/MS fragmentation patterns of the two metabolites
show a dipole ion at m/z 247.1435 and m/z 265.1539 and consecutive losses of 99 and 147. Thus, it was
suggested that m/z= 247.1435 consisted of a valine and a phenylalanine residue at the N-terminal
extremity (Figure 6, ions b2) and that the m/z 265.1539 consisted of a valine and a phenylalanine residue
in the C-terminal extremity of the two peptides (Figure 6, ions y2). Moreover, the MS3 spectrum of the
m/z 265 fragment ion of hydrolyzed fungisporin A showed a m/z 118.0860 (C5H12NO2) corresponding to
a C-terminal valine (Figure S2 A), whereas the same MS3 of PVer_511.29_18.7 displayed a m/z 166.0860
suggesting a C-terminal phenylalanine (Figure S2 B). This was confirmed by the presence of a fragment
ion at m/z 346.2113 on its MS2 spectrum (Figure 6, ion b
3). Finally, the MS3 spectra of the m/z 247.1435
fragment ion of both hydrolyzed fungisporin A and PVer_511.29_18.7 were perfectly similar, suggesting
that the N-terminal extremities of the two metabolites are identical. In this way, the linear tetrapeptide
Val-Phe-Phe-Val was confirmed at RT= 18.0 min. According to Ali et al., this molecule is suspected to
Version postprint
allowed the identification of its isomer detected at RT= 18.7 min as the tetrapeptide Val-Phe-Val-Phe.
Based on the assumption that this linear compound also resulted from the hydrolysis of a cyclic peptide
[50], a cyclic Val-Phe-Val-Phe structure was suspected.
3.5. Conclusion
The use of two isotope labelings of fungal substrate and HPLC-HRMS analyses enabled the
detection of 98 secondary metabolites produced by P. verrucosum grown on wheat grains, and led to the
unambiguous determination of all their chemical formulas. Among these metabolites, 18 structural
hypotheses were proposed from databases, at least nine of which were observed for the first time in P.
verrucosum: anacine, aurantiomide C, brevianamide F, LL-P880β and at least six fungisporins. The lack
of available reference compounds remains problematic for natural product studies. This can be partially
balanced by using informatics tools for the simulation of fragmentation spectra. In this study, CFM-ID
was successfully used for several P. verrucosum metabolites, providing relevant supporting information
about the metabolite annotations. However, 79 secondary metabolites remained unidentified. A molecular
network was generated with the GNPS system, enabling the detection of a metabolite of interest. This new
metabolite was characterized by MSn experiments as a linear tetrapeptide, most likely resulting from the
hydrolysis of the cyclic Val-Phe-Val-Phe. In any case, the 98 metabolites detected in this study constitute
a valuable source of information for further works focused on identification of new metabolites. These
data will be useful for purification and structural analyses with the help of complementary analyses by
NMR for example, for application to the particular P. verrucosum metabolome, or more generally to other
Version postprint
Acknowledgements
The label substrates were produced by the Groupe de Recherches Appliquées en Phytotechnologie, CEA,
IBEB, Cadarache, FR 13108 Saint-Paul-les-Durance, France. The authors are grateful to Andrew Morris
who corrected the manuscript. The authors also are grateful to Pascal Bourdaudhui, who developed the
software MassCompare, and to Jean-Claude Tabet for his kind help with the mass spectrometry analyses
and data monitoring. The authors would also like to thank the French National Infrastructure of
Metabolomics and Fluxomics (MetaboHUB-ANR-11-INBS-0010) for their support.
Funding Sources
This study was co-funded by INRA and French Minister of Higher Education and Research in the context
Version postprint
References
[1] A.A. Brakhage, Regulation of fungal secondary metabolism, Nat. Rev. Microbiol. 11 (2013) 21–
32.
[2] R. Hare, W. Florey, A.D. Gardner, N.G. Heatley, M.A. Jennings, J. Orr-Ewing, A.G. Sanders, E.P.
Abraham, E. Chain, C.M. Fletcher, H.W. Florey, New light on the history of penicillin, Med. Hist.
26 (1982) 1–24.
[3] A.A. Brakhage, V. Schroeckh, Fungal secondary metabolites - Strategies to activate silent gene
clusters, Fungal Genet. Biol. 48 (2011) 15–22.
[4] C. Bömke, B. Tudzynski, Diversity, regulation, and evolution of the gibberellin biosynthetic
pathway in fungi compared to plants and bacteria, Phytochemistry. 70 (2009) 1876–1893.
[5] J. Avalos, A. Prado-Cabrero, A. Estrada, Neurosporaxanthin production by Neurospora and
Fusarium, in: J.-L. Barredo (Ed.), Microb. Carotenoids from Fungi Methods Protoc., Springer S,
New York 2012, 2012: pp. 153–159.
[6] T. Kuiper-Goodman, Toxicology Letters risk assessment, Toxicol. Lett. 82/83 (1995) 853–859.
[7] D.L. Eaton, E.P. Gallagher, Mechanisms of aflatoxin carcinogenesis, Annu. Rev. Pharmacol.
Toxicol. 34 (1994) 135–172.
[8] T.R. Bui-Klimke, F. Wu, Ochratoxin A and human health risk: A review of the evidence, Crit. Rev.
Food Sci. Nutr. 55 (2015) 1860–1869.
[9] A. Zinedine, J.M. Soriano, J.C. Moltó, J. Mañes, Review on the toxicity, occurrence, metabolism,
detoxification, regulations and intake of zearalenone: An oestrogenic mycotoxin, Food Chem.
Toxicol. 45 (2007) 1–18.
[10] J.W. Bennett, M. Klich, Mycotoxins, Clin. Microbiol. Rev. 16 (2003) 497–516.
[11] E.M. Fox, B.J. Howlett, Secondary metabolism: Regulation and role in fungal biology, Curr. Opin.
Version postprint
[12] S. Elmholt, P.H. Rasmussen, Penicillium verrucosum occurrence and ochratoxin A contents in
organically cultivated grain with special reference to ancient wheat types and drying practice,
Mycopathologia. 159 (2005) 421–432.
[13] N. Magan, R. Hope, V. Cairns, D. Aldred, Post-harvest fungal ecology: Impact of fungal growth
and mycotoxin accumulation in stored grain, Eur. J. Plant Pathol. 109 (2003) 723–730.
[14] F. Wu, T. Bui-Klimke, K. Naumoff Shields, Potential economic and health impacts of ochratoxin
A regulatory standards, World Mycotoxin J. 7 (2014) 387–398.
[15] T. Kuiper-Goodman, P.M. Scott, Risk assessment of the mycotoxin ochratoxin A, Biomed.
Environ. Sci. 2 (1989) 179–248.
[16] International Agency for Research on Cancer (IARC), Ochratoxin A, IARC Monogr. Eval.
Carcinog. Risk Chem. to Humans. 56 (1993) 489–521.
[17] P. Kroghl, B. Haidt, R. Pleftinas, S. Ceovic, Balkan (endemic) nephropathy and foodborn
ochratoxin A: Preliminary results of a survey of foodstuffs, Acta Path. Microbiol. Scand. Sect. B.
85 (1977) 238–240.
[18] F. Malir, V. Ostry, A. Pfohl-Leszkowicz, J. Malir, J. Toman, Ochratoxin A: 50 years of research,
Toxins (Basel). 8 (2016) 12–15.
[19] T. Bui-Klimke, F. Wu, Evaluating weight of evidence in the mystery of balkan endemic
nephropathy, Risk Anal. 34 (2014) 1688–1705.
[20] T.O. Larsen, A. Svendsen, J. Smedsgaard, Biochemical characterization of ochratoxin A-producing
strains of the genus Penicillium, Appl. Environ. Microbiol. 67 (2001) 3630–3635.
[21] M.T. Henke, N.L. Kelleher, Modern mass spectrometry for synthetic biology and structure-based
discovery of natural products, Nat. Prod. Rep. 33 (2016) 942–950.
[22] W.B. Dunn, A. Erban, R.J.M. Weber, D.J. Creek, M. Brown, R. Breitling, T. Hankemeier, R.
Version postprint
spectrometry-focused untargeted metabolomics, Metabolomics. 9 (2013) 44–66.
[23] C. Bueschl, R. Krska, B. Kluger, R. Schuhmacher, Isotopic labeling-assisted metabolomics using
LC-MS, Anal. Bioanal. Chem. 405 (2013) 27–33.
[24] C. Bueschl, B. Kluger, M. Lemmens, G. Adam, G. Wiesenberger, V. Maschietto, A. Marocco, J.
Strauss, S. Bödi, G.G. Thallinger, R. Krska, R. Schuhmacher, A novel stable isotope labelling
assisted workflow for improved untargeted LC-HRMS based metabolomics research,
Metabolomics. 10 (2014) 754–769.
[25] N.K.N. Neumann, S.M. Lehner, B. Kluger, C. Bueschl, K. Sedelmaier, M. Lemmens, R. Krska, R.
Schuhmacher, Automated LC-HRMS(/MS) approach for the annotation of fragment ions derived
from stable isotope labeling-assisted untargeted metabolomics, Anal. Chem. 86 (2014) 7320–7327.
[26] H.B. Bode, B. Bethe, R. Hofs, A. Zeeck, Big effects from small changes: Possible ways to explore
nature’s chemical diversity, ChemBioChem. 3 (2002) 619–627.
[27] M. Hallas-Moller, K.F. Nielsen, J.C. Frisvad, Influence of the medium and preferred cereal
substrate on secondary metabolite production by species from Penicillium series Viridicata, Planta
Med. 82 (2016) S1–S381.
[28] P.M. Cano, E.L. Jamin, S. Tadrist, P. Bourdaud’Hui, M. Péan, L. Debrauwer, I.P. Oswald, M.
Delaforge, O. Puel, New untargeted metabolic profiling combining mass spectrometry and isotopic
labeling: Application on Aspergillus fumigatus grown on wheat, Anal. Chem. 85 (2013) 8412–
8420.
[29] J.C. Frisvad, R.A. Samson, Polyphasic taxonomy of Penicillium subgenus Penicillium: A guide to
identification of food and air-borne terverticillate Penicillia and their mycotoxins, Stud. Mycol. 49
(2002) 1–173.
[30] Y.C.S. Adjovi, S. Bailly, B.J.G. Gnonlonfin, S. Tadrist, A. Querin, A. Sanni, I.P. Oswald, O. Puel,
Version postprint
section and aflatoxin B1 in cassava, Food Microbiol. 38 (2014) 151–159.
[31] M. Pean, S. Boiry, J.-C. Ferrandi, F. Gibiat, O. Puel, M. Delaforge, Production and use of
mycotoxins uniformly enriched with stable isotopes for their dosage in biological samples: (1)
Production of uniformly enriched biomass, J. Label. Compd. Radiopharm. 50 (2007) 563–564.
[32] L.W. Sumner, A. Amberg, D. Barrett, M.H. Beale, R. Beger, C.A. Daykin, T.W. Fan, O. Fiehn, R.
Goodacre, J.L. Griffin, T. Hankemeier, N. Hardy, J. Harnly, Proposed minimum reporting
standards for chemical analysis Chemical Analysis Working Group (CAWG) Metabolomics
Standards Initiative (MSI), NIH. 3 (2007) 211–221.
[33] F. Allen, A. Pon, M. Wilson, R. Greiner, D. Wishart, CFM-ID: A web server for annotation,
spectrum prediction and metabolite identification from tandem mass spectra, Nucleic Acids Res.
42 (2014) 1–6.
[34] M. Wang, J.J. Carver, V. V Phelan, L.M. Sanchez, N. Garg, Y. Peng, D.D. Nguyen, J. Watrous,
C.A. Kapono, T. Luzzatto-Knaan, C. Porto, A. Bouslimani, A. V Melnik, M.J. Meehan, W.-T. Liu,
M. Crüsemann, P.D. Boudreau, E. Esquenazi, M. Sandoval-Calderón, R.D. Kersten, L.A. Pace,
R.A. Quinn, K.R. Duncan, C.-C. Hsu, D.J. Floros, R.G. Gavilan, K. Kleigrewe, T. Northen, R.J.
Dutton, D. Parrot, E.E. Carlson, B. Aigle, C.F. Michelsen, L. Jelsbak, C. Sohlenkamp, P. Pevzner,
A. Edlund, J. McLean, J. Piel, B.T. Murphy, L. Gerwick, C.-C. Liaw, Y.-L. Yang, H.-U. Humpf,
M. Maansson, R.A. Keyzers, A.C. Sims, A.R. Johnson, A.M. Sidebottom, B.E. Sedio, A. Klitgaard,
C.B. Larson, C.A. Boya P, D. Torres-Mendoza, D.J. Gonzalez, D.B. Silva, L.M. Marques, D.P.
Demarque, E. Pociute, E.C. O’Neill, E. Briand, E.J.N. Helfrich, E.A. Granatosky, E. Glukhov, F.
Ryffel, H. Houson, H. Mohimani, J.J. Kharbush, Y. Zeng, J.A. Vorholt, K.L. Kurita, P. Charusanti,
K.L. McPhail, K.F. Nielsen, L. Vuong, M. Elfeki, M.F. Traxler, N. Engene, N. Koyama, O.B.
Vining, R. Baric, R.R. Silva, S.J. Mascuch, S. Tomasi, S. Jenkins, V. Macherla, T. Hoffman, V.
Agarwal, P.G. Williams, J. Dai, R. Neupane, J. Gurr, A.M.C. Rodríguez, A. Lamsa, C. Zhang, K.
Version postprint
Litaudon, J.-L. Wolfender, J.E. Kyle, T.O. Metz, T. Peryea, D.-T. Nguyen, D. VanLeer, P. Shinn,
A. Jadhav, R. Müller, K.M. Waters, W. Shi, X. Liu, L. Zhang, R. Knight, P.R. Jensen, B.Ø. Palsson,
K. Pogliano, R.G. Linington, M. Gutiérrez, N.P. Lopes, W.H. Gerwick, B.S. Moore, P.C.
Dorrestein, N. Bandeira, Sharing and community curation of mass spectrometry data with Global
Natural Products Social Molecular Networking, Nat. Biotechnol. 34 (2016) 828–837.
[35] P. Shannon, A. Markiel, O. Ozier, N.S. Baliga, J.T. Wang, D. Ramage, N. Amin, B. Schwikowski,
T. Ideker, Cytoscape: a software environment for integrated models of biomolecular interaction
networks, Genome Res. 13 (2003) 2498–2504.
[36] R.A. Samson, K.A. Seifert, A.F.. Kuijpers, J.A.M.. Houbraken, J.C. Frisvad, Phylogenetic analysis
of Penicillium subgenus Penicillium using partial β -tubulin sequence, Stud. Mycol. 49 (2004) 175–
200.
[37] K.F. Nielsen, T.O. Larsen, N. Keller, T.S. Bugni, The importance of mass spectrometric
dereplication in fungal secondary metabolite analysis, Front. Microbiol. 6 (2015) 71.
[38] Y.H. Chooi, Y. Tang, Navigating the fungal polyketide chemical space: From genes to molecules,
J. Org. Chem. 77 (2012) 9933–9953.
[39] H. Laatsch, Antibase 2012: The natural compound identifier, (2012).
https://application.wiley-vch.de/stmdata/antibase.php (accessed January 2, 2017).
[40] S.C. Duarte, A. Pena, C.M. Lino, A review on ochratoxin A occurrence and effects of processing
of cereal and cereal derived food products, Food Microbiol. 27 (2010) 187–198.
[41] J.C. Frisvad, O. Filtenborg, Classification of terverticillate Penicillia based on profiles of
mycotoxins and other secondary metabolites, Appl. Environ. Microbiol. 46 (1983) 1301–1310.
[42] M. Kokkonen, M. Jestoi, A. Rizzo, The effect of substrate on mycotoxin production of selected
Penicillium strains, Int. J. Food Microbiol. 99 (2005) 207–214.
Version postprint
quinazolines from Penicillium verrucosum structurally related to anacine from Penicillium
aurantiogriseum, J. Nat. Prod. 62 (1999) 1578–1580.
[44] S.L. Leong, J. Schnürer, A. Broberg, Verrucine F, a quinazoline from Penicillium verrucosum, J.
Nat. Prod. 71 (2008) 1455–1457.
[45] L. Rahbaek, S. Sperry, J.C. Frisvad, T.O. Larsen, PC-2, LL-P888gamma and some novel analogue
alpha-pyrones from Penicillium nordicum, P. verrucosum and P. olsonii, Biochem. Syst. Ecol. 31
(2003) 313–317.
[46] J.M. Boyes-Korkis, K.A. Gurney, J. Penn, P.G. Mantle, J.N. Bilton, R.N. Sheppard, Anacine, a
new benzodiazepine metabolite of Penicillium aurantiogriseum produced with other alkaloids in
submerged fermentation, J. Nat. Prod. 56 (1993) 1707–1717.
[47] Z.H. Xin, Y. Fang, L. Du, T. Zhu, L. Duan, J. Chen, Q.Q. Gu, W.M. Zhu, Aurantiomides A-C,
quinazoline alkaloids from the sponge-derived fungus Penicillium aurantiogriseum SP0-19, J. Nat.
Prod. 70 (2007) 853–855.
[48] S. Maiya, A. Grundmann, S.M. Li, G. Turner, The fumitremorgin gene cluster of Aspergillus
fumigatus: Identification of a gene encoding brevianamide F synthetase, ChemBioChem. 7 (2006)
1062–1069.
[49] A. Klitgaard, J.B. Nielsen, R.J.N. Frandsen, M.R. Andersen, K.F. Nielsen, Combining stable
isotope labeling and molecular networking for biosynthetic pathway characterization, Anal. Chem.
87 (2015) 6520–6526.
[50] H. Ali, M.I. Ries, P.P. Lankhorst, R.A.M. Van Der Hoeven, O.L. Schouten, M. Noga, T.
Hankemeier, N.N.M.E. Van Peij, R.A.L. Bovenberg, R.J. Vreeken, A.J.M. Driessen, A
non-canonical NRPS is involved in the synthesis of fungisporin and related hydrophobic cyclic
tetrapeptides in Penicillium chrysogenum, PLoS One. 9 (2014) e98212.
Version postprint
untargeted substructure exploration in metabolomics, Proc. Natl. Acad. Sci. U. S. A. 113 (2016)
13738–13743.
Version postprint
FIGURE CAPTIONS
Fig. 1. Total ion current chromatograms obtained in the positive (A) and negative (B) ionization modes
from the extract of wheat grains infected by Penicillium verrucosum.
Fig. 2. Detection of ochratoxin B: mass spectra detected at RT= 26.7 min after positive ESI-HPLC-MS
from extract of Penicillium verrucosum grown (A) on natural 99% 12C wheat grains, (B) on grains labeled
with 97% of 13C and (C) on grains labeled with 53% of 13C and 97% of 15N. Right-hand panels display
the corresponding CID MS/MS spectra from culture (D) on natural 99% 12C wheat grains, (E) on grains
labeled with 97% of 13C and (F) on grains labeled with 53% of 13C and 97% of 15N.
Fig. 3. Secondary metabolites identified from Penicillium verrucosum. The chemical formulas were
calculated after comparison of the m/z ratios obtained from cultures of P. verrucosum in 12C wheat, 97%
13C wheat and 53% 13C / 97% 15N wheat. a Identification at level 1, b at level 2, c at level 3 of compounds
known to be produced by P. verrucosum, d at level 3 of compounds never characterized in P. verrucosum
but in other Penicillium species.
Fig. 4. Comparison between experimental MS/MS spectra (ESI+ high-resolution CID) of three secondary
metabolites of Penicillium verrucosum and the simulated MS/MS spectra of their respective structural
hypotheses. (A) Successful in silico simulation: experimental MS/MS spectrum of ochratoxin B (upper
part) (identified by homology to an authentic standard) and theoretical MS/MS generated by CFM-ID
(lower part). (B) MS/MS spectrum obtained from the secondary metabolite C21H21N4O3 detected at RT=
18,4 min (upper part) and in silico fragmentation of verrucines A and B using CFM-ID (lower part). (C)
MS/MS spectrum obtained from the secondary metabolite C21H19N4O3 detected at RT= 18,7 min (upper
part) and in silico fragmentation of verrucine F using CFM-ID (lower part).
Fig. 5. Molecular network of the secondary metabolome of Penicillium verrucosum, created with the
GNPS software from the targeted MS/MS spectra (ESI+ high-resolution CID): nodes name: m/z ratio and
Version postprint
in the HRMS spectrum, black edges: connected MS/MS spectra according to GNPS software, red dotted
edges: manually connected isomers which were not detected by GNPS.
Fig. 6. Comparison of the MS/MS spectra (ESI+ high-resolution CID) of two secondary metabolites
produced by Penicillium verrucosum grown on wheat grains. (A) MS/MS spectra of C28H38N4O5 detected
at RT= 18.0 min (PVer_511.29_18.0). (B) MS/MS spectra of C28H38N4O5 detected at RT= 18.7 min
Version postprint
TABLE CAPTIONS
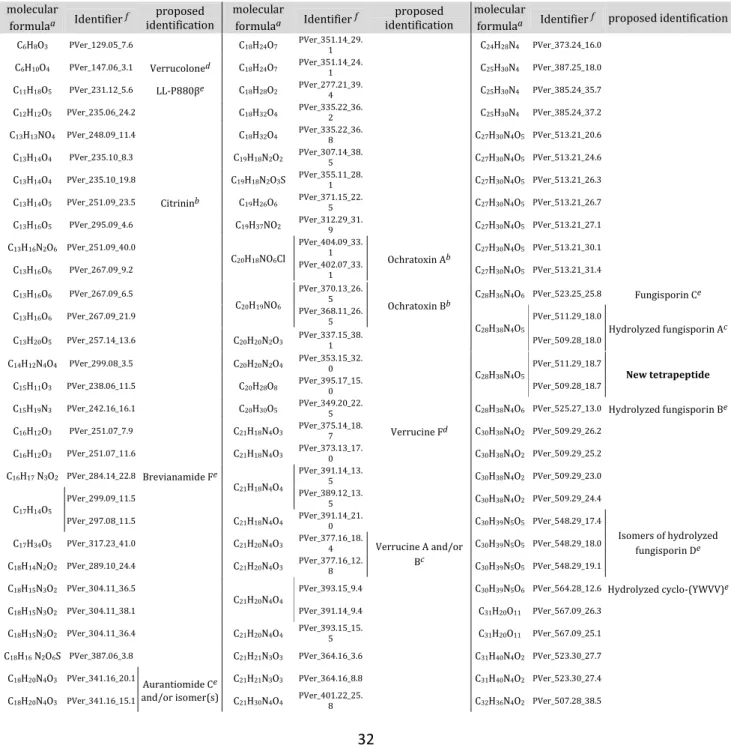
Table 1. List of the secondary metabolites detected in Penicillium verrucosum grown on wheat grains. a
The chemical formulas were calculated after comparison of the m/z ratios obtained from the culture of P.
verrucosum in 12C wheat, 97% 13C wheat and 53% 13C/96% 15N wheat. b Identification at level 1, c at level
2, d at level 3 of compounds known to be produced by P. verrucosum, e at level 3 of compounds never
characterized in P. verrucosum but in other Penicillium species, f secondary metabolites identifier
(PVer_m/z_RT).
molecular
formulaa Identifier f identification proposed
molecular
formulaa Identifier f identification proposed
molecular
formulaa Identifier f proposed identification C6H8O3 PVer_129.05_7.6 C18H24O7 PVer_351.14_29.1 C24H28N4 PVer_373.24_16.0
C6H10O4 PVer_147.06_3.1 Verrucoloned C18H24O7 PVer_351.14_24.1 C25H30N4 PVer_387.25_18.0
C11H18O5 PVer_231.12_5.6 LL-P880βe C18H28O2 PVer_277.21_39.4 C25H30N4 PVer_385.24_35.7
C12H12O5 PVer_235.06_24.2 C18H32O4 PVer_335.22_36.2 C25H30N4 PVer_385.24_37.2
C13H13NO4 PVer_248.09_11.4 C18H32O4 PVer_335.22_36.8 C27H30N4O5 PVer_513.21_20.6
C13H14O4 PVer_235.10_8.3 C19H18N2O2 PVer_307.14_38.5 C27H30N4O5 PVer_513.21_24.6
C13H14O4 PVer_235.10_19.8 C19H18N2O3S PVer_355.11_28.1 C27H30N4O5 PVer_513.21_26.3
C13H14O5 PVer_251.09_23.5 Citrininb C19H26O6 PVer_371.15_22.5 C27H30N4O5 PVer_513.21_26.7
C13H16O5 PVer_295.09_4.6 C19H37NO2 PVer_312.29_31.9 C27H30N4O5 PVer_513.21_27.1
C13H16N2O6 PVer_251.09_40.0
C20H18NO6Cl
PVer_404.09_33. 1
Ochratoxin Ab C27H30N4O5 PVer_513.21_30.1 C13H16O6 PVer_267.09_9.2 PVer_402.07_33.1 C27H30N4O5 PVer_513.21_31.4
C13H16O6 PVer_267.09_6.5
C20H19NO6
PVer_370.13_26. 5
Ochratoxin Bb C28H36N4O6 PVer_523.25_25.8 Fungisporin Ce C13H16O6 PVer_267.09_21.9 PVer_368.11_26.5
C28H38N4O5
PVer_511.29_18.0
Hydrolyzed fungisporin Ac C13H20O5 PVer_257.14_13.6 C20H20N2O3 PVer_337.15_38.1 PVer_509.28_18.0
C14H12N4O4 PVer_299.08_3.5 C20H20N2O4 PVer_353.15_32.0
C28H38N4O5
PVer_511.29_18.7
New tetrapeptide
C15H11O3 PVer_238.06_11.5 C20H28O8 PVer_395.17_15.0 PVer_509.28_18.7
C15H19N3 PVer_242.16_16.1 C20H30O5 PVer_349.20_22.5 C28H38N4O6 PVer_525.27_13.0 Hydrolyzed fungisporin Be
C16H12O3 PVer_251.07_7.9 C21H18N4O3 PVer_375.14_18.7 Verrucine Fd C30H38N4O2 PVer_509.29_26.2
C16H12O3 PVer_251.07_11.6 C21H18N4O3 PVer_373.13_17.0 C30H38N4O2 PVer_509.29_25.2
C16H17 N3O2 PVer_284.14_22.8 Brevianamide Fe
C21H18N4O4
PVer_391.14_13.
5 C30H38N4O2 PVer_509.29_23.0
C17H14O5
PVer_299.09_11.5 PVer_389.12_13.5 C30H38N4O2 PVer_509.29_24.4
PVer_297.08_11.5 C21H18N4O4 PVer_391.14_21.0 C30H39N5O5 PVer_548.29_17.4
Isomers of hydrolyzed fungisporin De C17H34O5 PVer_317.23_41.0 C21H20N4O3 PVer_377.16_18.4 Verrucine A and/or
Bc
C30H39N5O5 PVer_548.29_18.0
C18H14N2O2 PVer_289.10_24.4 C21H20N4O3 PVer_377.16_12.8 C30H39N5O5 PVer_548.29_19.1
C18H15N3O2 PVer_304.11_36.5
C21H20N4O4
PVer_393.15_9.4 C30H39N5O6 PVer_564.28_12.6 Hydrolyzed cyclo-(YWVV)e
C18H15N3O2 PVer_304.11_38.1 PVer_391.14_9.4 C31H20O11 PVer_567.09_26.3
C18H15N3O2 PVer_304.11_36.4 C21H20N4O4 PVer_393.15_15.5 C31H20O11 PVer_567.09_25.1
C18H16 N2O6S PVer_387.06_3.8 C21H21N3O3 PVer_364.16_3.6 C31H40N4O2 PVer_523.30_27.7
C18H20N4O3 PVer_341.16_20.1 Aurantiomide Ce
and/or isomer(s)
C21H21N3O3 PVer_364.16_8.8 C31H40N4O2 PVer_523.30_27.4
Version postprint
C18H22N4O3 PVer_343.17_12.7 Anacinec
and/or isomer(s)
C21H30N4O4 PVer_401.22_21.9 C32H42O7 PVer_537.29_39.5
C18H22N4O3 PVer_343.17_17.9 C22H27N3 PVer_334.23_15.8 C32H42O8 PVer_553.28_38.7
C18H24O7 PVer_351.14_18.1 C22H27N3 PVer_332.21_35.6 C32H42O8 PVer_553.28_38.3
C18H24O7 PVer_351.14_29.0 C23H21N5O3 PVer_416.17_14.6
C37H42N4O5
PVer_623.32_36.3 C18H24O7 PVer_351.14_24.6 C23H23N3O4 PVer_406.17_8.8 PVer_621.30_36.3
C38H42N4O1
Version postprint
Table 2. Secondary metabolites detected from Penicillium verrucosum after culture on wheat grains and
their MS/MS fragmentation in higher energy collision dissociation (HCD) mode. The fragmentation
spectra are presented as a list of fragment ions with their relative intensity. a The chemical formulas were
calculated after comparison of the m/z ratios obtained from the culture of P. verrucosum in 12C wheat,
97% 13C wheat and 53% 13C / 96% 15N wheat. b Secondary metabolites identifier (PVer_m/z_R T).
Version postprint Identifie r f molecu lar formul aa paren t ion 12C m/z (Da) RT (min ) MS/MS mode (Normalize d Collision Energy)
m/z of majors fragment ions (% relative intensity)
PVer_129.0 5_7.6 C6H8O3 [M+H]+ 129.0544 7.6 HCD (20) 129.0544(100) 87.0437(12) 97.0281(8) 55.0176(6) 111.0439(3) PVer_147.0 6_3.1 C6H10O4 [M+H]+ 147.0655 3.1 HCD (20) 147.0655(5) 129.0543(100) 117.0543(32) 97.0280(17) 85.0280(17) 99.0437(7) 87.0437(7) 75.0437(6) 55.0176(5) 71.0488(5) 115.0387(3) PVer_231.1 2_5.6 C11H18O5 [M+H]+ 231.1229 5.6 HCD (20) 231.1227(100) 181.0857(70) 127.0387(27) 213.1120(26) 195.1014(25) 81.0332(22) 139.0750(21) 155.1064(21) 141.0543(13) 151.1116(10) PVer_235.0 6_24.2 C12H12O5 [M-H]- 235.0616 24.2 HCD (60) 235.0616(100) 217.0510(85) 191.0718(70) 163.0770(5) 189.0562(2) PVer_248.0 9_11.4 C13OH413N [M+H] + 248.0 916 11.4 HCD (20) 248.0914(100) 230.0810(87) PVer_235.1 0_8.3 C13H14O4 [M+H]+ 235.0965 8.3 HCD (20) 235.0964(100) 217.0687(2) 191.0699(2) PVer_235.1 0_19.8 C13H14O4 [M+H]+ 235.0965 19.8 HCD (20) 235.0963(47) 193.0855(100) 165.0907(7) 217.0854(6) 207.1014(4) 139.1114(4) 211.0958(2) 137.0955(3) PVer_251.0 9_23.5 C13H14O5 [M+H]+ 251.0912 23.5 HCD (20) 251.0915(100) 233.0807(45) PVer_295.0 9_4.6 C13HO166N2 [M-H] - 295.0 936 4.6 HCD (60) 295.0936(15) 221.0573(100) 251.1039(20) 236.0807(7) 193.0622(25) 249.0885(6) 122.0252(9) 137.0361(9) 208.0859(8) PVer_251.0 9_40.0 C13H16O5 [M-H]- 251.0924 40.0 HCD (60) 251.0924(100) 233.0823(9) 163.0769(9) 189.0562(5) 207.1030(6) PVer_267.0 9_9.2 C13H16O6 [M-H]- 267.0871 9.2 HCD (60) 267.0871(100) 249.0772(6) 207.0666(16) 163.0769(5) 193.0875(4) 237.0773(3) 205.0875(2) PVer_267.0 9_6.5 C13H16O6 [M-H]- 267.0871 6.5 HCD (60) 267.0871(100) 239.0721(5) 249.0563(1) PVer_267.0 9_21.9 C13H16O6 [M-H]- 267.0871 21.9 HCD (60) 267.0871(95) 221.0825(100) 249.0773(10) 177.0926(10) 203.0719(4) PVer_257.1 4_13.6 C13H20O5 [M+H]+ 257.1381 13.6 HCD (35) 257.1382(65) 157.0493(100) PVer_299.0 8_3.5 C14H12N4 O4 [M-H] - 299.0 783 3.5 HCD (60) 299.0783(35) 256.0731(100) 228.0421(15) 145.0413(30) 213.0673(5) 238.0627(3) 185.0361(3) PVer_238.0 6_11.5 C15H11O3 [M-H]- 238.0640 11.5 HCD (60) 238.0637(100) 210.0694(2) PVer_242.1 6_16.1 C15H19N3 [M+H]+ 242.1647 16.1 HCD (20) 242.650(100) 111.0915(33) PVer_251.0 7_7.9 C16H12O3 [M-H]- 251.0712 7.9 HCD (60) 251.0712(100) 250.0646(13) 223.0771(6) 211.0405(4) PVer_251.0 7_11.6 C16H12O3 [M-H]- 251.0712 11.6 HCD (60) 251.0712(100) 233.0612(3) 223.0770(2) PVer_284.1 4_22.8 C16HO172N3 [M+H] + 284.1388 22.8 HCD (20) 284.1390(100) 130.0648(30) 170.0597(3) 132.0804(3) PVer_299.0 9_11.5 C 17H14O5 [M+H] + 299.0 907 11.5 HCD (20) 299.0912(60) 205.0493(100) 281.0807(6) 189.0543(6) 253.0857(3) 107.0490(3) 187.0388(3) 159.0438(1) 263.0702(1) PVer_297.0 8_11.5 [M-H]- 297.0773 HCD (60) 297.0773(10) 253.08874(100) 238.0641(6) 159.0456(4) 109.0300(4) 93.0350(4) 226.0626(2) PVer_317.2 3_41.0 C17H34O5 [M-H]- 317.2327 41.0 HCD (60) 317.2327(100) 257.2127(52) 299.2229(6) 115.0770(3) 59.0143(18) 183.1395(4) 195.1759(4) 255.2334(4) 85.0663(1) PVer_289.1 0_24.4 C18HO142N2 [M-H] - 289.0 977 24.4 HCD (60) 289.0977(100) 116.0510(33) 261.1039(24) PVer_304.1 1_36.5 C18HO152N3 [M-H] - 304.1 087 36.5 HCD (60) 304.1087(26) 213.0549(100) 261.1037(29) 183.0567(8) 286.0988(6) 159.0568(3) 145.0410(3) 212.0470(3) 262.0989(3) PVer_304.1 1_38.1 C18HO152N3 [M-H] - 304.1 087 38.1 HCD (60) 304.1087(100) 213.0548(100) 261.1038(25) 286.0998(5) 183.0569(7) PVer_304.1 1_36.4 C18H15N3 O2 [M-H] - 304.1 087 36.4 HCD (60) 304.1102(3) 213.0548(100) 261.1040(25) 286.0992(5) 183.0569(7) 159.0569(4) PVer_387.0 6_3.8 C18OH616S N2 [M-H] - 387.0 655 3.8 HCD (60) 387.0662(100) 176.0356(75) 353.0784(55) 202.0149(50) 269.0570(52) 121.0296(20) 231.0414(16) 277.0297(15) 121.0296(21) 270.0646(16) PVer_341.1 6_20.1 C18HO203N4 [M+H] + 341.1 604 20.1 HCD (20) 341.1605(55) 324.1338(100) 296.1389(10) PVer_341.1 6_15.1 C18H20N4 O3 [M+H] + 341.1 604 15.1 HCD (20) 341.1601(60) 324.1337(100) 296.1388(8) 151.1114(2) 195.1013(1) PVer_343.1 7_12.7 C18HO223N4 [M+H] + 343.1747 12.7 HCD (20) 343.1758(45) 326.1496(100) 298.1546(5) PVer_343.1 7_17.9 C18HO223N4 [M+H] + 343.1 747 17.9 HCD (20) 343.1758(45) 326.1495(100) 298.1545(5) 270.0869(2) PVer_351.1 4_18.1 C18H24O7 [M-H]- 351.1448 18.1 HCD (60) 351.1448(100) 307.1190(60) 249.0773(60) 333.1351(9) 205.0874(11) 101.0248(4) 219.1028(3) PVer_351.1 4_29.0 C18H24O7 [M-H]- 351.1448 29.0 HCD (60) 351.1450(65) 201.0924(100) 245.1188(80) 277.1449(42) 263.1293(21) 231.1033(21) 233.1188(19) 213.0923(6) PVer_351.1 4_24.6 C18H24O7 [M-H]- 351.1448 24.6 HCD (60) 351.1448(55) 321.1347(100) 307.1190(55) 245.0825(40) 201.0924(35) 233.1186(5) 259.0980(5) PVer_351.1 4_29.1 C18H24O7 [M-H]- 351.1448 29.1 HCD (60) 351.1448(60) 201.0925(100) 245.1189(80) 277.1448(45) PVer_351.1 4_24.1 C18H24O7 [M-H]- 351.1448 24.1 HCD (60) 351.1450(100) 321.1349(45) 249.0773(30) 307.1191(25) 245.0826(18) 201.0924(17) 101.0614(19) PVer_277.2 1_39.4 C18H28O2 [M+H]+ 277.2158 39.4 HCD (20) 277.2164(100) 179.1431(12) 135.1168(5) 259.2060(3) 121.1011(3) 235.1696(1) 161.1325(1) PVer_335.2 2_36.2 C18H32O4[M+Na]+ 335.2187 36.2 HCD (35) 335.2187(100) 317.2079(3) 190.1235(3) PVer_335.2 2_36.8 C18H32O4[M+Na]+ 335.2187 36.8 HCD (35) 335.2187(100) 190.1232(20) PVer_307.1 C19H18N2 [M+H] 307.1 38.5 HCD(35) 307.1439(75) 229.0971(100) 201.1022(12) 111.0553(10) 292.1207(2)