HAL Id: tel-03135236
https://tel.archives-ouvertes.fr/tel-03135236v3
Submitted on 8 Feb 2021HAL is a multi-disciplinary open access archive for the deposit and dissemination of sci-entific research documents, whether they are pub-lished or not. The documents may come from teaching and research institutions in France or abroad, or from public or private research centers.
L’archive ouverte pluridisciplinaire HAL, est destinée au dépôt et à la diffusion de documents scientifiques de niveau recherche, publiés ou non, émanant des établissements d’enseignement et de recherche français ou étrangers, des laboratoires publics ou privés.
Knowledge graphs based extension of patients’ files to
predict hospitalization
Raphaël Gazzotti
To cite this version:
Raphaël Gazzotti. Knowledge graphs based extension of patients’ files to predict hospitalization. Modeling and Simulation. Université Côte d’Azur, 2020. English. �NNT : 2020COAZ4018�. �tel-03135236v3�
Prédiction d’hospitalisation par la génération de
caractéristiques extraites de graphes de
connaissances
Raphaël GAZZOTTI
Laboratoire d’Informatique, Signaux et Systèmes de Sophia Antipolis (UMR7271)
Présentée en vue de l’obtention du grade de docteur en Informatique de l’Université Côte d’Azur
Dirigée par :
Mr. Fabien GANDON, Directeur de Recherche,
INRIA Dirigée par :
Mme. Catherine FARONZUCKER, Maître de
conférences, Université Côte d’Azur Soutenue le : 30 Avril 2020
Devant le jury, composé de : Président du jury :
Mr. Andrea TETTAMANZI, Professeur, Université Côte d’Azur
Rapporteurs :
Mme. Sandra BRINGAY, Professeure, Université Paul Valéry Montpellier 3
Mme. Sylvie DESPRES, Professeure, Université
Sorbonne Paris Nord Examinateur :
Mr. Olivier DAMERON, Maître de conférences,
Université de Rennes 1 Invité :
Mr. David DARMON, Maître de conférences,
Prédiction d’hospitalisation par la génération de
caractéristiques extraites de graphes de
connaissances
Résumé
L’utilisation de dossiers médicaux électroniques (DMEs) et la prescription électronique sont des priorités dans les différents plans d’action européens sur la santé connectée. Le développement du DME constitue une formidable source de données ; il capture tous les épisodes symptomatiques dans la vie d’un patient et doit permettre l’amélioration des pratiques médicales et de prises en charge, à la condition de mettre en place des procé-dures de traitement automatique.
A ce titre nous travaillons sur la prédiction d’hospitalisation à partir des DMEs et après les avoir représentés sous forme vectorielle, nous enrichissons ces modèles afin de profiter des connaissances issues de référentiels, qu’ils soient généralistes ou bien spécifiques dans le domaine médical et cela, dans le but d’améliorer le pouvoir pré-dictif d’algorithmes de classification automatique. Déterminer les connaissances à ex-traire dans l’objectif de les intégrer aux représentations vectorielles est à la fois une tâche subjective et destinée aux experts, nous verrons une procédure semi-supervisée afin d’automatiser en partie ce processus.
Du fruit de nos recherches, nous avons ébauché un produit destiné aux médecins généralistes afin de prévenir l’hospitalisation de leur patient ou du moins améliorer son état de santé. Ainsi, par le biais d’une simulation, il sera possible au médecin d’évaluer quels sont les facteurs impliqués dans le risque d’hospitalisation de son patient et de définir les actions préventives à planifier pour éviter l’apparition de cet événement.
Cet algorithme d’aide à la décision a pour visée d’être directement intégré au logi-ciel de consultation des médecins et nous avons pour ce faire développé une interface graphique élaborée en collaboration avec de nombreux corps de métiers avec notamment les premiers concernés, des médecins généralistes.
Knowledge graphs based extension of patients’ files
to predict hospitalization
Abstract
The use of electronic medical records (EMRs) and electronic prescribing are priorities in the various European action plans on connected health. The development of the EMR is a tremendous source of data; it captures all symptomatic episodes in a patient’s life and should lead to improved medical and care practices, as long as automatic treatment procedures are set up.
As such, we are working on hospitalization prediction based on EMRs and after hav-ing represented them in vector form, we enrich these models in order to benefit from the knowledge resulting from referentials, whether generalist or specific in the medical field, in order to improve the predictive power of automatic classification algorithms. De-termining the knowledge to be extracted with the objective of integrating it into vector representations is both a subjective task and intended for experts, we will see a semi-supervised procedure to partially automate this process.
As a result of our research, we designed a product for general practitioners to prevent their patients from being hospitalized or at least improve their health. Thus, through a simulation, it will be possible for the doctor to evaluate the factors involved in the risk of hospitalization of his patient and to define the preventive actions to be planned to avoid the occurrence of this event.
This decision support algorithm is intended to be directly integrated into the physi-cian consultation software. For this purpose, we have developed a graphical interface developed in collaboration with many professional bodies, including the first to be con-cerned, general practitioners.
Remerciements
Je tiens à remercier mes directeurs de thèse, Catherine Faron Zucker et Fabien Gan-don, pour leur rigueur scientifique, leur encadrement et leurs conseils avisés, sans qui cette thèse n’aurait pas vu le jour.
Je souhaite exprimer ma gratitude aux membres du jury pour avoir accepté d’examiner et d’évaluer cette thèse.
Merci à Félix pour m’avoir offert l’opportunité de travailler au sein de son entreprise sur des thématiques et avec des partenaires stratégiques.
Merci à Virginie et à David pour nous avoir permis de travailler avec les données de leur département, pour avoir apporté leur expertise et pour avoir exprimé une probléma-tique leur tenant à cœur.
Merci à Elisa qui a apporté une dimension plus concrète à ce travail, en premier lieu scientifique, de part ses illustrations.
Merci à Christine pour son support à toutes épreuves dans les méandres des dé-marches administratives.
Merci aux membres de l’équipe WIMMICS qui m’ont permis de grandir aussi bien d’un point de vue professionnel, intellectuel que humain.
Je tiens tout particulièrement à remercier Noëlle et Hervé pour m’avoir soutenu et avoir été auprès de moi au cours de toutes ces années.
Contents
Contents vii
List of Figures xi
List of Tables xiii
1 Introduction 1
2 Basic representation of raw data from electronic medical records 5 2.1 Characteristics of PRIMEGE: a database of general practitioner consultations 5
2.2 Relevant state of the art vector representations of textual data . . . 9
2.3 Relevant work on the representation of time-series data . . . 13
2.4 Vector representation of electronic medical records . . . 14
2.4.1 Preprocessing of texts in electronic medical records . . . 15
2.4.2 Non sequential modelling of electronic medical records . . . 15
2.4.3 Sequential modelling of electronic medical records. . . 16
2.5 Discussion . . . 17
2.6 Conclusion . . . 18
3 Predicting hospitalization on a basic representation of electronic medical records19 3.1 Prediction of hospitalisation from electronic medical records . . . 19
3.2 Relevant state of the art machine learning algorithms . . . 22
3.2.1 Non sequential machine learning algorithms . . . 22
3.2.2 Sequential machine learning algorithms . . . 24
3.3 Experimental study . . . 25
3.3.1 Experimental setting . . . 25
3.3.2 Search space for hyperparameters of machine learning algorithms . 25 3.3.3 Measure of test’s accuracy . . . 27
3.3.4 Results . . . 28
3.4 Discussion . . . 28
3.5 Conclusion . . . 29
4 Enrichment of representations of electronic medical records with domain knowl-edge 30 4.1 Relevant works on domain knowledge enrichment . . . 31
4.1.1 Relevant works on representations exploiting knowledge graphs . . . 31
Approaches exploiting medical reports and biomedical knowledge graphs . . . 31
Graph embeddings and transformer based representations . . . 33
4.1.2 Entity linking approaches for domain knowledge enrichment. . . 34
CONTENTS
4.2.1 Knowledge extraction based on Wikidata . . . 36
4.2.2 Knowledge extraction based on DBpedia . . . 37
Preselected DBpedia concepts to be searched for in EMRs. . . 38
Automatic selection of concepts from DBpedia . . . 39
SPARQL query for medical concepts extraction . . . 39
Inter-rater reliability of DBpedia concept annotation . . . 41
4.2.3 Notations and feature sets using general knowledge sources . . . 44
4.3 Knowledge extraction based on domain specific ontologies . . . 45
4.3.1 Knowledge extraction from ATC . . . 46
4.3.2 Knowledge extraction from ICPC-2 . . . 47
4.3.3 Knowledge extraction from NDF-RT . . . 48
4.3.4 Notations and feature sets using domain specific ontologies . . . 49
4.4 Integrating ontological knowledge in vector representations of electronic medical records . . . 50
4.5 Discussion . . . 51
4.6 Conclusion. . . 53
5 Predicting hospitalization based on electronic medical records representation enrichment 55 5.1 Protocol & evaluation . . . 55
5.1.1 Material and softwares . . . 57
5.1.2 Search space for hyperparameters of machine learning algorithms . 57 5.2 Notation and characteristics of candidate feature sets . . . 58
5.3 Evaluating the impact of ontological knowledge on prediction . . . 60
5.3.1 Evaluation of the enrichment with concepts extracted from knowl-edge graphs . . . 60
5.3.2 Evaluation of the selection of concepts extracted from DBpedia for the enrichment of electronic medical records representations . . . . 63
Evaluation of manual vs. automatic selection of relevant subjects . . 63
Generalization of concepts vector . . . 64
5.3.3 Statistical hypothesis testing with concepts extracted from knowledge graphs . . . 65
5.4 Discussion . . . 67
5.5 Conclusion. . . 69
6 Decision support application 70 6.1 Specifying requirements with a focus group . . . 71
6.2 Related work and existing applications . . . 72
6.3 Application scenarios . . . 78
6.3.1 General practitioner’s perspective . . . 78
6.3.2 Patient’s perspective . . . 78
6.4 Specificities of the application from the perspective of the predictive algo-rithm . . . 79
6.4.1 Ordering of health problems . . . 79
6.4.2 Simulation of the hospitalization prevention . . . 81
6.5 Design of the interface . . . 82
6.6 Perspectives of evolution of the application and interface . . . 88
6.7 Conclusion and Future Work . . . 92
CONTENTS
A Appendix I
A.1 Appendix figures . . . I
A.2 Appendix tables . . . II
List of Figures
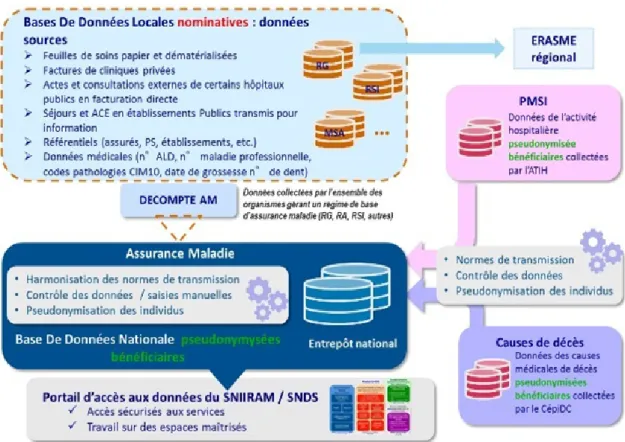
2.1 Diagram illustrating the methods of collecting, processing and distributing health data with the SNDS. At the top right, there is data from the PMSI. At the bottom right, we find data from CépiDC. At the left, there is data from the SNIIRAM. Source:https://bit.ly/36R1FhY. . . 6
2.2 Example of generated vector representation by BOW from textual documents. Source:FONCUBIERTARODRIGUEZ[2014]. . . 10
2.3 Example of tree generated by Brown clustering for 7 words from the JNLPBA corpus. Source:TANGet al.[2014]. . . 11
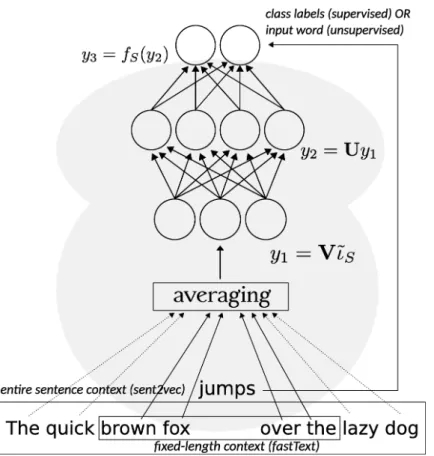
2.4 Embedding vector learned through a shallow neural network. Source: AGI
-BETOVet al.[2018]. . . 12
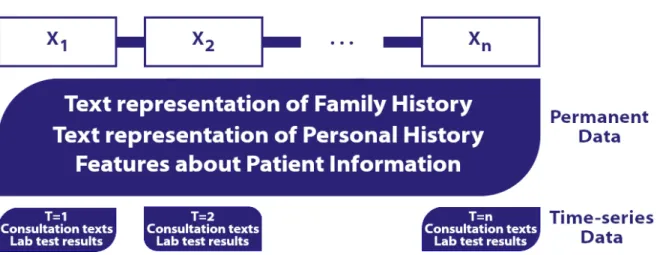
2.5 Diagram illustrating the sequential representation of an electronic medical record. . . 17
3.1 Diagram representing the consultations considered before (events from t0
to tn−1) the detection of a hospitalization (event tn). . . 20
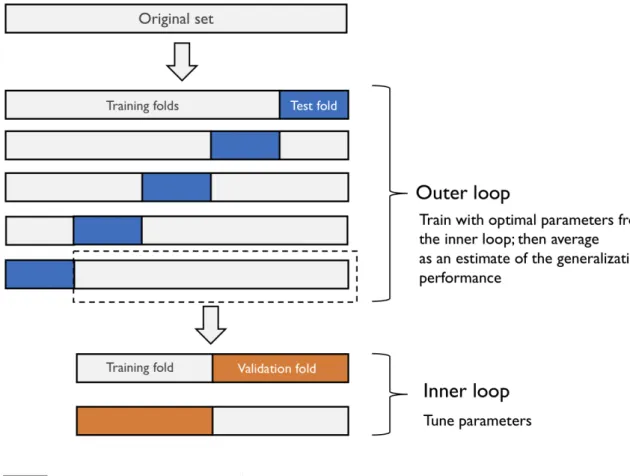
3.2 Illustration of the nested-cross validation process. Source: https://bit. ly/2ClKLuX. . . 26
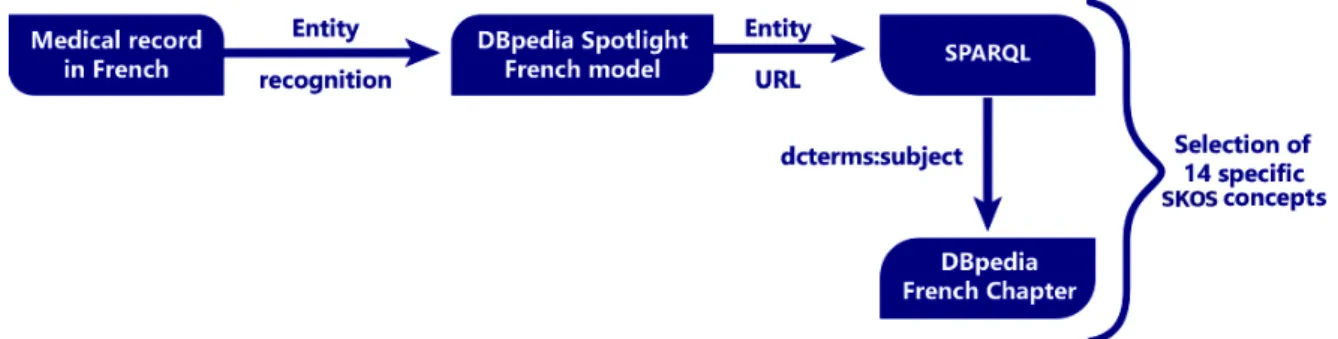
4.1 Workflow diagram to extract DBpedia subjects from the list of 14 manually pre-selected subjects. . . 38
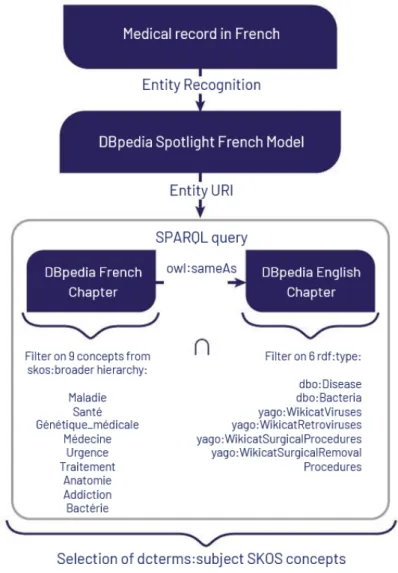
4.2 Workflow used to extract candidate subjects from EMR. . . 41
4.3 Workflow used to compute inter-rater reliability for both human and ma-chine annotations. . . 42
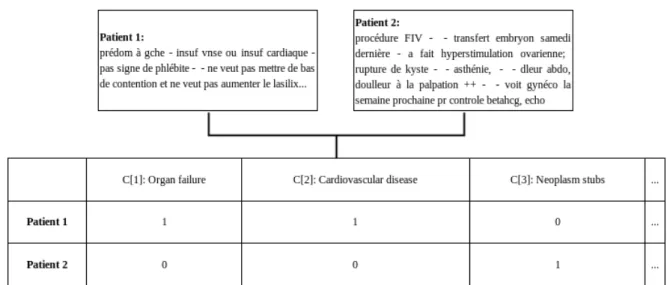
4.4 Concept vectors generated for two EMRs with the bag-of-words approach under the +s configuration. The translation and correction of the texts are (a) for patient 1: “predom[inates] on the left, venous or cardiac insuf[ficiency], no evidence of phlebitis, does not want to wear compression stockings and does not want to increase the lasix". and (b) for patient 2: “In vitro fertil-ization procedure, embryo transfer last Saturday, did ovarian hyperstimula-tion, cyst rupture, asthenia, abdominal [pain], [pain] on palpation ++, will see a gyneco[logist] next week [for] a beta HCG, echo check-up". . . 51
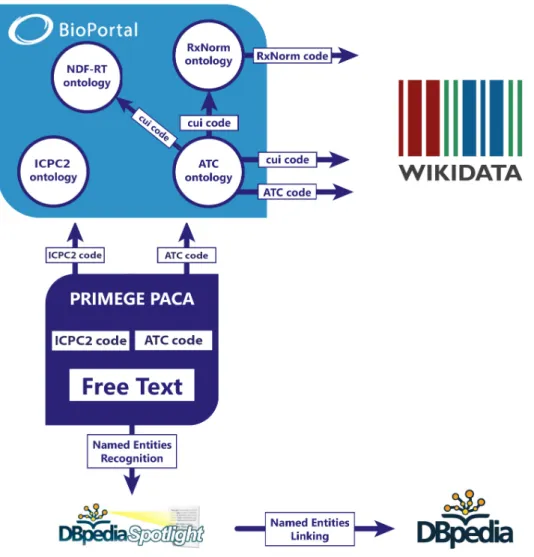
4.5 Workflow of the mapping used to match ATC codes, ICPC2 codes with med-ical domain ontologies. The links used to proceed to the mapping with the knowledge bases Wikidata and DBpedia are also described. . . 53
5.1 Histograms that represent the average F1 score and standard deviations un-der logistic regression for the vector sets consiun-dered in the Table 5.1.. . . 62
5.2 Convergence curve obtained following the training on n (x-axis) KFold par-titions for different configurations of the Table 5.1. . . 64
LIST OF FIGURES
5.3 Histograms that represent the average F1 score and standard deviations un-der logistic regression for different configurations of the Table 5.1. . . 65
5.4 Histograms that represent the average F1 score and standard deviations un-der logistic regression for the vector sets consiun-dered in the Table 5.5 and with the generalized concepts vectors approach described in Section 5.3.2.. . . . 66
6.1 Illustration of the 30-day re-admission prediction panel from the software developed by Health Catalyst. The area (1) allows to select a population of interest. The area (2) displays scores and probability related to the re-admission of the patient. The area (3) displays the top re-re-admission factors. Source:https://bit.ly/2NwqSaF. . . 73
6.2 Former interface of the 30-day re-admission prediction panel from the soft-ware developed by Health Catalyst. Source:https://bit.ly/2TwJNFV. . . 74
6.3 Illustration of the re-admission prediction tool for patients undergoing tran-scatheter aortic valve replacement developed byKHERAet al.[2019]. Source:
https://bit.ly/3075UnC. . . 75
6.4 Illustration of the CardioRisk tool. Source:http://www.cardiorisk.fr/. . 76
6.5 Illustration of the CDVI software, Cardiovascular Risk Calculator. Source: https://mile-two.gitlab.io/CVDI/. . . 77
6.6 View on the selection panel; this screen exists only in the demonstrator, which allows to select a patient according to different criteria. The patients searched here have hypercholesterolemia, aged between 70 and 88 years and are smokers. . . 83
6.7 GP view with the expected hospitalization risk after management of the ‘Smok-ing’ and ‘Depression’ factors. . . 84
6.8 Global overview panel on the patient’s file, ‘Details’, under the tab ‘History’. The demonstrator allows to add new pathologies. . . 85
6.9 View on the tab that refers to lesser impact factors with details about meth-ods and metrics involved in the software. . . 86
6.10 Patient view with the total gain on the hospitalization risk after the manage-ment of the ‘Smoking’ and ‘Depression’ factors. . . 87
6.11 Mock-up screen that contains patient information on the left part and on the right is displayed geolocalized epidemiological alerts. . . 89
6.12 First version of our interface with the risk factors and the prediction of hos-pitalization. . . 89
6.13 Direction imagined for the synthesis screen on the patient’s health condition. 90
6.14 First version of the synthesis screen on bioassays with a link to the recom-mendations of the HAS. . . 91
A.1 Relational diagram of the PRIMEGE database. Source: LACROIX-HUGUES
List of Tables
2.1 Data collected in the PRIMEGE database. . . 8
2.2 Data volume contained in the PRIMEGE database. . . 8
2.3 Example of consultation found in PRIMEGE. The translation and correc-tions of the texts are for ‘Reason of consultation’: "tetanus vaccination", for ‘History’: "Appendicitis" and for ‘Observation’: "In [First Grade], good gen-eral condition, clear pul[monary] auscul[tation], reg[ular] [heart sounds] without breathing, eardrums OK". . . 9
2.4 Example of consultation found in PRIMEGE. The translation and correc-tions of the texts are for ‘Reason of consultation’: "Results of specialized tests and examinations, depression", for ‘History’: "Type IIb Dislipidemia, non-toxic multinodular Goitre, Hypertension, Arthrosis of the knee, hemoc[c]ult" and for ‘Active problem’: "Non-toxic multinodular Goitre, Type IIb Dislipi-demia, Hypertension, Arthrosis of the knee".. . . 9
3.1 Ft p, f p of the selected classifiers on the balanced dataset DSB. . . 28
4.1 List of manually chosen concepts in order to determine a hospitalization, these concepts were translated from French to English (the translation does not necessarily exist for the English DBpedia chapter). . . 38
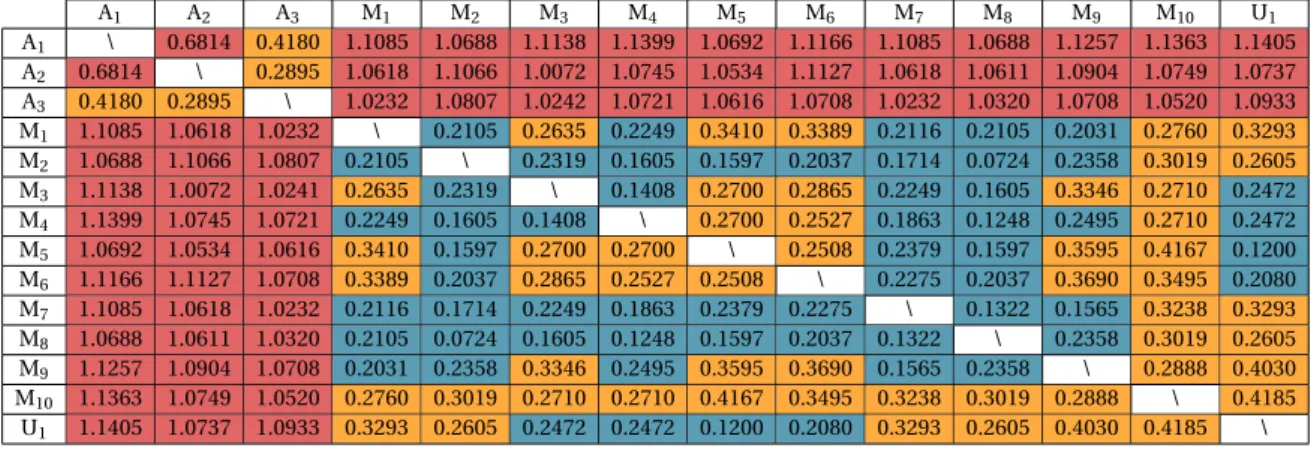
4.2 Correlation metric (1 −ku− ¯(u− ¯uku).(v− ¯2kv− ¯v)vk2, with ¯u, the mean of elements of u, and
respectively ¯v, the mean of elements of v) computed on the 285 subjects.
A1to A3refers to human annotators and M1to M10refers to machine
anno-tators through feature selection annotation on theζ approach (considering the 10 K-Fold). U1is the union of subjects from the sets M1to M10. Cells in redare strictly superior to 0.5, cells inorangeare between 0.25 and 0.5, cells incyanare strictly inferior to 0.25. . . 43
4.3 Alternative concept vector representations resulting from the EMR of a pa-tient under Tahor with the NDF-RT knowledge graph. . . 51
5.1 Ft p, f p for the different vector sets considered on the balanced dataset DSB. 61
5.2 Confusion matrix of the random forest algorithm (on the left) and the logis-tic regression (on the right) on the basel i ne (‘H’ stands for Hospitalized and ‘Not H’ for ‘Not Hospitalized’). . . 61
5.3 Confusion matrix of +t +s ∗+c2+w a +wi (on the left) and +t +c2+w a +wi (on the right) approaches under the logistic regression algorithm (‘H’ stands for Hospitalized and ‘Not H’ for ‘Not Hospitalized’).. . . 62
5.4 Patient profiles correctly identified as being hospitalized (true positives) af-ter injecting domain knowledge (the comparison of these two profiles was made on the baseline and the +t + s + c2 + w a + wi approaches with the logistic regression algorithm).. . . 63
LIST OF TABLES
5.5 Ft p, f pfor the different vector sets considered on the balanced dataset DSB. 63
5.6 Confusion matrix of +sm (on the left) and the union of concepts under +sm conditions (on the right) approaches under the logistic regression algorithm (‘H’ stands for Hospitalized and ‘Not H’ for ‘Not Hospitalized’). . . 65
5.7 t-value/p-value pairs on F1 and on AUC for different vector sets considered on the balanced dataset DSB. . . 66
6.1 Coefficients learned on the expression ‘Diabète de type 2’ after training lo-gistic regression on the prediction of hospitalization, the ‘#history#’ means that the source of this expression comes from the personal history of the patient. . . 80
6.2 Coefficients learned on the expression ‘Absence de tabagisme’ after train-ing logistic regression on the prediction of hospitalization, the ‘#history#’ means that the source of this expression comes from the personal history of the patient.. . . 80
A.1 The main groups of the ATC classification. . . II
A.2 The main groups of the ICPC-2 classification. . . II
A.3 Medical tests values considered and discretized according to reference ranges. Examples are given between square bracket. . . III
Chapter 1
Introduction
In 2017, the budget of the consumption of medical care and goods in France represented 199.3 billion euro or 8.7% of GDP with 92.8 billion for hospital care with an increase of 32% compared to 2016.1
Each year in France, the hospitalization rate of inhabitants is as high as 19.1 % (12.7 million patients for more than 3300 health facilities) and a full hospitalization in the pub-lic sector lasts on average 6.4 days in medicine, surgery and obstetrics, 36.4 days in follow-up care and rehabilitation, 44.5 days in home hospitalization and 57.0 days in psychiatry.2 This represents a major societal impact and a concern about the patient’s well-being both mental and physical.
General practitioners (GPs) are responsible for the care of 90% of population’s health problems. However, the multitude of information and the constant increase of patients encountered complicate their tasks. For this reason, it is valuable to provide tools that of-fer them a summary and some feedback about the patients’ file, including all the essential points to order out the therapeutic actions to be chosen as a priority.
In addition, the lack of dedicated recommendations for the treatment of polypatho-logical patients3complicates the management of these patients with the risk of applying recommendations for isolated diseasesBOYDet al.[2005];TINETTIet al.[2004].
Moreover, 1 general practitioner out of 5 sees more than 50 patients per day which is twice the number recommended under European safety guidance and the current av-erage is more than 40 patients per day,4 which confirms for the general practitioner the
1https://www.insee.fr/fr/statistiques/3676713?sommaire=3696937 2https://www.atih.sante.fr/analyse-de-l-activite-hospitaliere-2017
3https://www.has-sante.fr/portail/upload/docs/application/pdf/2015-04/note_
methodologique_polypathologie_de_la_personne_agee.pdf
CHAPTER 1. INTRODUCTION
interest of being able to target the elements to be taken care of as a priority since the du-ration of consultations is necessarily shortened.
Computerization of general practitioners has been intensive over the last twenty yearsDEROSISet SEGHIERI[2015]. The use of Electronic Medical Records (EMRs) and e-prescribing are priorities in different European action plans on e-health and are reflected in the policies of several statesSTROETMANNet al.[2011]. EMR development constitutes a formidable source of information and large data collection networks in primary care exist in our European neighbors, notably in the United Kingdom and the Netherlands (Clin-ical Practice Research Datalink CPRD Ex GPRD,5 Q research,6Netherlands Information Network in General Practice7). These development efforts have enabled the creation of voluminous databases that support many types of research that resulted in advances cov-ered in multiple publications. Furthermore, secondary use of electronic medical records offer many perspectives including an improved quality of careDELUSIGNANetVANWEEL
[2005] or to enable public health surveillanceBIRKHEADet al.[2015];HERSH[2007]. The authors ofHILLESTADet al.[2005] explain that the adoption of EMR systems can
signifi-cantly reduce the cost in the healthcare domain, moreover, EMR systems can be used as a support for disease management and refer more easily higher-risk patients to a specialist. Prevention and early detection can significantly benefit from the use of EMR data.
Electronic medical records contain essential information about the different symp-tomatic episodes a patient goes through. They possess the potential to improve patient well-being and constitute, therefore, a potentially valuable source to artificial intelligence approaches.
This CIFRE Thesis started in the context of a partnership between the team WIM-MICS8(INRIA/CNRS) and the company SynchroNext.9
The initial project was a use case with the Allianz company on routing questions from customer service. Since most of this service is overloaded with customer emails and are therefore an excellent opportunity for artificial intelligence approaches to automate the processing of these requests. This first experience has shown us the need for expert feed-back and care in annotating the data.
With this in mind, we applied our theories to a new case in the medical field and 5https://www.cprd.com/home/
6http://www.qresearch.org/
7http://www.ulb.ac.be/esp/emd/nl_debakker.htm 8https://team.inria.fr/wimmics/
CHAPTER 1. INTRODUCTION
started the project HealthPredict.10 This project became the core of this thesis where we aim at preventing the hospitalization of patients or at least at improving their health’s condition whether physical or mental by prioritizing the different risk factors responsible for the hospitalization. The results of this research are intended to provide decision sup-port tools for general practitioners to assist them in their daily practice. For that purpose, we trained a supervised machine learning to identify hospitalized patients from the oth-ers and to learn the risk factors involved in that decision. One of the purposes is to order the risk factors to be treated as a priority since it is complex to identify the best treatment plan and what is possible for some patients, as well as to take into account polypathology and adherence to treatment. And indeed, dealing with all the pathologies of a patient at the same time means dealing with drug interactions.
Our study focuses on general practice while most scientific papers rely on hospital data. However, it is more common for patients to go to visit their general practitioners rather than to the hospital. This situation is principally due to the lack of feedback on general practitioners’ practices because of the non-existence of federated services using international standards for data collection from independent physicians.
Nowadays, it is fairly common to hear about great advances in the detection of a re-ally specific pathology by applying machine learning technologies on images or recorded signal from electrical activity of the body. Our study, however, aims to propose a way to build a preventive decision aid tool based on Electronic Medical Record as a non-invasive procedure without specific prerequisites. The ideal would, of course, be the follow-up of all the medical trajectories of a patient (family physician, specialist physician, hospital...), but as a first step we study here the predictability of that decision to move a patient from general practitioners to hospitals.
Thus, we will focus on predicting the hospitalization of patients based on their med-ical records as well as those of other patients who have been used to train supervised classification algorithms.
This dissertation is composed of the following chapters:
• The second chapter introduces the PRIMEGE database and relevant works on resenting textual and time-series data. Then, we propose two different vector rep-resentations with the sequential and non sequential modelling of EMRs.
CHAPTER 1. INTRODUCTION
• The third chapter presents our study dataset, the supervised classification algo-rithms that we will feed with the vector representations from the first chapter and their evaluation in order to predict patient hospitalization.
• The fourth chapter studies relevant work on domain knowledge enrichment and entity linking, then explores the extraction of knowledge from general knowledge sources and domain specific ontologies and how we integrate them to vector repre-sentation of EMRs.
• The fifth chapter evaluates enrichment of vector representations of EMRs with do-main knowledge.
• The sixth chapter shows the use case planned for our application and its interface with its evolution, then it displays the specificities applied on the predictive algo-rithm to use it in our application.
• The last chapter will review our contributions and highlight the perspectives of our work.
Chapter 2
Basic representation of raw data from
electronic medical records
This chapter is dedicated to the foundations of knowledge representation and the char-acteristics of the electronic medical records (EMRs) relevant to the following chapters. We will first introduce the database of general practitioners consultations from which our dataset is derived in Section2.1. Subsequently, we will present relevant works on vector-based representation of data on top of which we built our contributions in Section2.2. Finally, we will propose in Section2.4and discuss2.5two vector representations of elec-tronic medical records.
2.1 Characteristics of PRIMEGE: a database of general
practitioner consultations
The national French Health Data System (SNDS) integrates data from several information systems1(see Figure2.1):
• the national health insurance database, SNIIRAM2(Système National d’Information Inter-Régimes de l’Assurance Maladie),
• the national hospital discharge database, PMSI3(Programme de Médicalisation des Systèmes d’Information),
1Documentation referencing the data collected in the SNDS:https://www.snds.gouv.fr/download/
SNDS_Nomenclature_sous_produits.pdf.
2https://www.ameli.fr/l-assurance-maladie/statistiques-et-publications/sniiram/
finalites-du-sniiram.php
CHAPTER 2. BASIC REPRESENTATION OF RAW DATA FROM ELECTRONIC MEDICAL RECORDS
Figure 2.1 – Diagram illustrating the methods of collecting, processing and distributing health data with the SNDS. At the top right, there is data from the PMSI. At the bottom right, we find data from CépiDC. At the left, there is data from the SNIIRAM. Source:https://bit.ly/36R1FhY.
• the database on the medical causes of death, BCMD4 (Base de données sur les Causes Médicales de Décès), managed by CépiDC,5
• the database from CNSA6(Caisse Nationale de Solidarité pour l’Autonomie) which integrates data related to disability from MDPH7 (Maisons Départementales des Personnes Handicapées),
• data from OCAM (Organisme d’Assurance Maladie Complémentaire), OCAM in-cludes complementary health insurance organizations like mutual insurance com-panies, pension funds and insurance companies.
Thus the SNDS essentially contains data related to hospital databases as well as the medicines dispensed, but it only gives a limited picture of general practice. The PRIMEGE database is the result of a preliminary study conducted to identify the data provided by
4https://epidemiologie-france.aviesan.fr/en/epidemiologie-france/fiches/
base-de-donnees-sur-les-causes-medicales-de-deces-en-france
5https://www.cepidc.inserm.fr/ 6https://www.cnsa.fr/
CHAPTER 2. BASIC REPRESENTATION OF RAW DATA FROM ELECTRONIC MEDICAL RECORDS
an EMR system in order to build a health-related data warehouse going beyond drug prescriptions. A list of data to collect was established from the recommendations of the ANAES (Agence Nationale d’Accréditation et d’Evaluation en Santé)BIRKHEADet al. [2015], concerning medical records in general medicine in addition to a study led by the departments of General Medicine at the University of Nice Sophia-Antipolis and Lyon 1.8 These data may concern episodes of care, but also include data valuable to evaluate and improve the practices such as the ICPC-2 code (International Classification of Primary Care) enabling standardization of the reasons for consultation and diagnoses. Data al-lowing patient identification (such as name, surname, address, etc.) were excluded.
Therefore, PRIMEGE differs from SNDS in that it contains, in addition to the pre-scribed drugs and the reasons for prescriptions, a great deal of additional information about patients. As shown in Table2.3and Table2.4, we can find in PRIMEGE, the text de-scriptions written by general practitioners together with international classification codes of prescribed drugs, pathologies and reasons for consultations, as well as the numerical values of the different medical examination results obtained by a patient. PRIMEGE, also captures the history of the patient and his family. It has the merit of being exhaustive in its design, and the use of international codes provides an evident advantage in terms of risk monitoring and, in our case, for the application of artificial intelligence processes.
PRIMEGE contains the drugs prescribed to patients by their general practitioners. However, these drugs may not have been withdrawn by the patient, just as he may has withdrawn others from his pharmacist. In this sense, the SNDS and PRIMEGE are com-plementary.
This PRIMEGE dataset is also representative of the population met by general practi-tioners since no selection is made, unlike clinical studies with control and experimental groups, which are restricted to a narrow segment of the population. However, this allega-tion should be put into perspective in the sense that this database contains a significant sample of the population met by physicians in the Provence-Alpes-Côte d’Azur region where there is an overall ageing of the population.9,10
The PRIMEGE databaseLACROIX-HUGUES et al. [2017] contains more than 600,000 consultations carried out by 17 general practitioners across the Alpes-Maritimes
depart-8https://www.atih.sante.fr/analyse-de-l-activite-hospitaliere-2017
9https://connaissance-territoire.maregionsud.fr/fileadmin/user_upload/Annuaire/
Etude/vieux2017.pdf
CHAPTER 2. BASIC REPRESENTATION OF RAW DATA FROM ELECTRONIC MEDICAL RECORDS
ment in France. Table2.1describes the data collected in this database, Table2.2displays it statistics and TableA.1its relational diagram.
Table 2.1 – Data collected in the PRIMEGE database.
Category Data collected
GPs Sex, birth year, city, postcode Patients Sex, birth year, city, postcode
Socio-professional category, occupation Number of children, family status Long term condition -LTC- (Y/N) Personal history Family history Risk factors Allergies Consultations Date Reasons of consultation
Symptoms related by the patient and medical observation Further investigations
Diagnoses
Drugs prescribed (dose, number of boxes, reasons of the prescription) Paramedical prescriptions (biology/imaging)
Medical procedures
Table 2.2 – Data volume contained in the PRIMEGE database.
Element Amount
Patients 68,415
Consultations 601,464 Past medical history 212,797 Biometric data 384,087 Reasons of consultation 345,626
Diagnoses 125,864
Prescribed drugs 1,089,470
Symptoms 33,273
Health care procedures 15,001 Additional examination 1,281,300 Paramedical prescription 25,910
Observations/notes 73,336
One of the observations that can be made on PRIMEGE is that the amount of infor-mation provided by physicians varies considerably from one physician to another, as well as from one patient to another, since physicians can fill out their consultation forms as they wish. Even so, they are encouraged to fill it in as accurately as possible, and offering them applications related to their data would be an additional motivation for that
pur-CHAPTER 2. BASIC REPRESENTATION OF RAW DATA FROM ELECTRONIC MEDICAL RECORDS
Table 2.3 – Example of consultation found in PRIMEGE. The translation and corrections of the texts are for ‘Reason of consultation’: "tetanus vaccination", for ‘History’: "Appendicitis" and for ‘Ob-servation’: "In [First Grade], good general condition, clear pul[monary] auscul[tation], reg[ular] [heart sounds] without breathing, eardrums OK".
Birth date ... Gender LTC Problem date Number of visits Reason ICPC2 History Medical procedure Observation 2005 ... H N S17-2012 10 vaccin A44 Appendicite VACCIN EN CP
anti-tétanique REVAXIS - Bon état général -; SER 0,5ML+2 auscult pulm libre; AIG 1 bdc rég sans souffle - tympans
ok-Table 2.4 – Example of consultation found in PRIMEGE. The translation and corrections of the texts are for ‘Reason of consultation’: "Results of specialized tests and examinations, depression", for ‘History’: "Type IIb Dislipidemia, non-toxic multinodular Goitre, Hypertension, Arthrosis of the knee, hemoc[c]ult" and for ‘Active problem’: "Non-toxic multinodular Goitre, Type IIb Dislipi-demia, Hypertension, Arthrosis of the knee".
Birth date ... Gender LTC Problem date Number of visits Reason ICPC2 History Active problem 1947 ... F N S30-2015 38 Résultats S60, Dyslipidémie type IIb, Goitre multinodulaire non
d’analyses et P76 Goitre multinodulaire non toxique, Dyslipidémie type IIb, d’examens spécialisés, toxique, Hypertension Hypertension artérielle,
Dépression artérielle, Gonarthrose, Gonarthrose hemocult
pose. Another point that can be noted is the apparent confusion between symptoms and diagnoses in the data provided by physicians.
One of the questions that arises when faced with the problem of predicting a medi-cal event (e.g., prediction of hospitalization or prediction of a pathology) from a database such as PRIMEGE is how to represent medical records to apply machine learning algo-rithms. This question arises particularly with the number of text fields involved in a con-sultation, and with on one side permanent data and on the other side time-stamped data about the patient. Text modelling on such tasks is crucial since 79.3% of the phenotypes present in medical records can be identified within free textsESCUDIÉ et al.[2017]. Of
course, a medical record does not exclusively contain textual information, and it is also essential to address this specific point.
2.2 Relevant state of the art vector representations of
tex-tual data
Before going further into the representation we have chosen for EMR, we present a brief overview of state of the art of vector representations relevant to textual data.
The bag-of-words modelHARRIS[1954] consists in representing a text as a list of
to-kens. Thus, words of a sentence are employed as features of a semantic distributional model (see Figure2.2). Such model is also adopted outside of natural language
process-CHAPTER 2. BASIC REPRESENTATION OF RAW DATA FROM ELECTRONIC MEDICAL RECORDS
ing with image processing but this method is called, in this case, a bag-of-features. Either the occurrence or frequency based metrics are used in this model.
Figure 2.2 – Example of generated vector representation by BOW from textual documents. Source: FONCUBIERTARODRIGUEZ[2014].
Brown clusteringBROWNet al.[1992] consists in generating clusters of words based on word classes through hierarchical clustering based on the context, the representation in the form of a tree (see Figure2.3) provided by this method can then be used to perform different tasks in the scope of natural language processing.
Word embedding consists in capturing the relationships between words by generating a textual representation through an encoder (see Figure2.4). An encoder is a deep learn-ing algorithm that encodes input data and thereby performs dimensionality reduction by compressing the data. There are several notable models enabling to produce word em-beddings, among which Word2VecMIKOLOVet al.[2015], GlovePENNINGTONet al.[2014] and more recently Fastext BOJANOWSKI et al.[2016] (and the latest innovation brought to this project with MOE, Misspelling Oblivious word Embeddings PIKTUSet al.[2019]) There exists other variations of this model such as Doc2VecLEet MIKOLOV[2014], which preserve the principle of dimensionality reduction with an encoder, but applied to docu-ments.
CHAPTER 2. BASIC REPRESENTATION OF RAW DATA FROM ELECTRONIC MEDICAL RECORDS
Figure 2.3 – Example of tree generated by Brown clustering for 7 words from the JNLPBA corpus. Source:TANGet al.[2014].
just like word embeddings, input data is compressed to generate a representation with the BERT modelDEVLINet al.[2018] that relies on a transformer. A transformer uses encoder-decoder attention layers to generate encodings that better capture the semantic relations of sequences’ embeddings. This model learns to predict the words present in a sentence by using a mechanism called masked input tokens, some words are randomly not consid-ered in the inputs of this algorithm, which improves the robustness of this algorithm.
To better address the specificities of biomedical source texts, BioBERTLEEet al.[2020]
uses a pretrained BERT and retrains it on a biomedical corpora, so that it outperforms BERT and state of the art models on several biomedical natural language processing tasks such as named entity recognition, relation extraction and question answering.
MultiFiT EISENSCHLOS et al.[2019] which is based on ULMFiT HOWARD et RUDER
[2018] outperforms other state of the art models for multilingual resources including MultiBERT,11 a multilingual model for BERT, and requires lesser data for training. Mul-tiFit uses for this purpose a quasi-recurrent neural networks, which combines the advan-tages of convolutional neural networks and recurrent neural networks. It uses as input subwords instead of unigrams (cf. Multiple Tile Encoding compression), and the labels of its instances are floating numbers. Assigning a floating number as a label is called label smoothing and this prevents a machine learning algorithm from becoming
CHAPTER 2. BASIC REPRESENTATION OF RAW DATA FROM ELECTRONIC MEDICAL RECORDS
Figure 2.4 – Embedding vector learned through a shallow neural network. Source:AGIBETOVet al. [2018].
confident.
Actually, one of the negative aspects of more advanced models is that the data com-pression inherent in such models causes loss of information and therefore of some inter-pretability, although they are able to better capture the semantic relationships between terms. Conversely, the BOW representation is easily interpretable but does not capture the semantic relationships between words and generates huge models. The representa-tions generated with a BOW are in the form of a sparse matrix, a matrix filled essentially with zeros, which makes it possible to accelerate the calculations performed in compar-ison to dense matrices. Each textual representation has pros and cons depending on the targeted use case.
Most of the time, preprocessing is required before feeding a textual representation, such as, at least, the steps of lemmatization or stemmatization that consist in dealing with inflected forms of words in order to obtain either lemma, the canonical form of a word, or stem, the main part of a word delivered by an algorithm. This process allows in a textual representation to reduce the textual variability that can be identified within a corpus. This can also be considered as data compression, although it is carried out
CHAPTER 2. BASIC REPRESENTATION OF RAW DATA FROM ELECTRONIC MEDICAL RECORDS
on a smaller scale and it is less opaque than using a deep learning algorithm or the PCA (Principal Component Analysis) methodPEARSON[1901]. Other prepossessing steps can be considered such as spell-checking, removal of special characters or handling of named entities.
Without preprocessing, noise would be introduced with the generation of a textual representation. In particular without stemming or lemmatization, inflected forms of the same word will be present in a textual representation instead of being represented only once. The result is a distinction between inflected forms, whereas they have only one meaning.
It is crucial when using a domain-specific corpus to generate its own representation, since many terms may be omitted in a general representation or an ambiguous notion may be applied to a term when it admits a very precise definition in a given sector. We opted among existing textual representations for a model using a bag-of-words represen-tation (BOW)HARRIS[1954] for different reasons: (i) the main information from textual documents is extracted without requiring a large corpus; (ii) the attributes are not trans-formed, which makes it possible to identify which terms contribute to a prediction, even if this implies to manipulate very large vector spaces; (iii) the integration of heterogeneous data is facilitated since it is sufficient to concatenate other attributes to this model with-out removing the meaning of the terms formerly represented in this way. As a result, the relatively simplistic BOW model allows us to confirm our theories as well as to analyze what a classifier has indeed learned.
2.3 Relevant work on the representation of time-series
data
Time-series data are a list of values or events that occur over time. To represent these values, it is therefore necessary to model the time factor, which implies discretizing time into time windows. EMRs contain patient data that can cover several years and thus are suitable for a representation that takes into account time-series data.
Original early detection systems based on EMRs applied the aggregation of data from time windows and ignored the relations between events.
The improvements brought by different sequential approaches have been studied by SINGHet al.[2015] on the task of predicting deterioration of kidney function. They show
CHAPTER 2. BASIC REPRESENTATION OF RAW DATA FROM ELECTRONIC MEDICAL RECORDS
that a Stacked Temporal approach outperforms a Non-Temporal one but that this model is subject to overfitting. They also propose a competitive approach with a Multitask-Temporal model, though it implies to consider time-windows extracted from a same pa-tient as independent. Another limitation of the approaches they propose is that textual information such as diagnoses, procedures and medications are represented as a binary variable. Thus, a variable is set to 1 if the textual information involved is encountered in any of the time-windows considered.
LIU et al.[2018b] propose to use event embeddings, considering time as a factor to handle lab tests, routine vital signals, diagnoses and drug administrations on the tasks of predicting death and abnormal lab tests. They applied a new algorithm based on the modification of a LSTM called Heterogeneous Event LSTM (HE-LSTM) that performs bet-ter than other LSTM approaches to these embeddings. However, textual information con-tained in their study is limited to the types of events.
HENRIKSSONet al.[2015] propose an extension to distributional semantics models to deal with heterogeneous data contained in EMRs on the task of detecting adverse drug events with the Word2Vec algorithm MIKOLOV et al.[2015]. They evaluated the perfor-mances of the representation with the random forest algorithm BREIMAN [2001] for
ad-verse drug event detection and show that combining structured and unstructured data modeled in semantic space significantly improved predictive performances. However, the proposed representation loses in interpretability if we seek to provide the reasons be-hind the classifier’s choices. Moreover, the issue of considering permanent information relative to the patient is not addressed.
Despite the constraints outlined bySINGHet al.[2015], we opted for an Stacked Tem-poral approach since it appears to be the most usual way to represent EMRs with a se-quential representation. In addition, it does not require any modification of sese-quential machine learning algorithms. The Multitask-Temporal approach that they described is a special representation that works with non sequential machine learning algorithms. We excluded the other representations, although they take into account heterogeneous data, because they are not easily interpretable without drastic modification.
2.4 Vector representation of electronic medical records
In this section we propose two vector representations of EMRs, one non sequential and the other sequential. We first present the text preprocessing we perform for bothrepre-CHAPTER 2. BASIC REPRESENTATION OF RAW DATA FROM ELECTRONIC MEDICAL RECORDS
sentations.
2.4.1 Preprocessing of texts in electronic medical records
We preprocessed the textual data in EMRs with a regular expressions tokenizer built with the NLTK library12LOPERet BIRD[2002] and with the TreeTagger13lemmatizerMÀRQUEZ
et RODRÍGUEZ [1998] (we observed better results with this tool than with the existing French stemmers in NLTK). The number of occurrences of tokens was used as values of attributes in the different upcoming vector representations.
All text fields in the EMRs (see Table2.1) are transformed into vectors. Just like in the structure of the PRIMEGE database, some textual data must be distinguishable from each other when switching to the vector representation of EMRs, e.g., a patient’s personal history and his or her family history. To achieve this, we have introduced provenance prefixes during the creation of the bag-of-words to trace the contribution of the different fields.
We will provide more details on the text fields used, and which were prefixed in the creation of our vectors in Chapter3.
2.4.2 Non sequential modelling of electronic medical records
Our base non sequential representation of EMR is as follows. Let Vi = {wi1, w2i, ..., wni} be the bag-of-words obtained from the textual data in the EMR of the it hpatient.
When considering the task of predicting hospitalization, we aggregated all the consul-tations occurring before a hospitalization. For patients who have not been hospitalized, all their consultations are aggregated. We are in the presence of two classes, thus the labels yi associated with Vi used for this representation are either ‘hospitalized’ or ‘not
hospitalized’.
This requires specific processing to take into account time-series values in non se-quential representation. For instance, medical test for cholesterol levels may have been done on several consultations, and to consider it, it is necessary to discretize the time fac-tor in one way or another. So, we can use the last known biomedical analysis or use a measure like the maximum, the mean, etc. of all the analysis related to cholesterol levels. This discretization allows to integrate this biomarker in a non sequential representation.
12http://www.nltk.org/
CHAPTER 2. BASIC REPRESENTATION OF RAW DATA FROM ELECTRONIC MEDICAL RECORDS
The principal characteristic that differentiates this representation from the sequential representation is that the information on consultations and permanent information are mixed up and not repeated.
2.4.3 Sequential modelling of electronic medical records
For a sequential modelling of EMRs, we chose to represent the different consultations of a patient as a sequence (t1, ..., tn). This n-tuple contains all his consultations in
chronologi-cal order, with t1his first consultation and tn, his last consultation present in the database.
Each consultation ticontains both persistent patient data and data specific to the it h
con-sultation.
Similarly to the non sequential representation of EMRs, for patients who have not been hospitalized, all their consultations are integrated in the sequential representation of EMRs whereas for patients who have been hospitalized only their consultations occur-ring before hospitalization are integrated.
Contrary to the vast majority of state of the art works that drop medical analysis to focus on textual information LIN et al.[2012] JIN et al.[2018], we propose an approach
to include them with a way to handle permanent data such as the patient’s history. Thus every ti = (xi, yi) where xi contains two broad types of information about the patient.
On one hand, it contains consultation notes on the reasons for the consultation, diag-noses, prescribed drugs, observations and the numerical data resulting from the medical tests. On the other hand, it contains textual information conveyed throughout the pa-tient’s life including, for instance, familial history, personal history, personal information, past problems, the environmental factors as well as allergies (see Figure 2.5). It means that textual information carried throughout the patient’s life is repeated across all xi of
ti. We also consider at the same level as permanent information the current health
prob-lems (like osteoporosis) and the past health probprob-lems (like warts) since they do not vary considerably over the years.
EMRs can contain multiple elements that occur at the same time (e.g., multiple rea-sons of consultation for one consultation) and different types of content for the same consultation. Conventional time-series data are not composed of heterogeneous data and use a succession of individual elements, e.g., succession of tokens in a text or suc-cession of states traversed by an automaton. In EMRs, multiple reasons for consultations may occur during the same consultation, i.e., a patient may have fever and vomiting at the
CHAPTER 2. BASIC REPRESENTATION OF RAW DATA FROM ELECTRONIC MEDICAL RECORDS
Figure 2.5 – Diagram illustrating the sequential representation of an electronic medical record.
same time, both conditions occur at the same time. The nature of these data prompted us to use the modelling described above.
In order to learn a prediction model, yi contains the label to predict, in our case
‘hos-pitalized’ or ‘not hos‘hos-pitalized’. In the experiments of Chapter3, we attribute the same label to all the ti of a patient indicating whether or not he was hospitalized.
2.5 Discussion
A major disadvantage of the chosen vector representation of the EMRs for sequential ma-chine algorithm is that it is of considerable size. This is particularly true with regard to n-grams, which represent windows of words sequence. A textual representation that uses dense matrices also does not ensure better performance, in terms of disk space and time, since even if it is thinner, the fact that the matrices used are not sparse requires more resources in order to be able to compute. This is probably one of the reasons why most research focuses on international codes such as UMLS, rather than using the text in med-ical records, texts become a way to extract UMLS codes.
Despite this aspect, the representations that we will use to feed machine learning al-gorithms allow us to track the origin of an attribute from an EMR, since the attributes are not transformed with such model. Moreover, they will provide an effective feedback on what a machine learning algorithm learns from the inputted data.
CHAPTER 2. BASIC REPRESENTATION OF RAW DATA FROM ELECTRONIC MEDICAL RECORDS
2.6 Conclusion
In this chapter, we presented and compared our proposed sequential and non-sequential vector representations of EMRs.
In order to model the EMRs sequentially, we used a consultation as a time unit. In future work, we could investigate different time windows in order to better capture the notion of temporality present in EMRs.
Another point that is related to the modelling is the value to be assigned to the at-tributes. Indeed, we use in this work the number of occurrences to model attributes, however it is a questionable choice since the amount and the degree of completion of consultations varies from one patient to another. Future work on this matter could in-volve the normalization of attributes between patients.
The choice of another textual representation that takes into account the semantic re-lationships between words may also be discussed in the future, but this point should be considered with caution, as physicians must obtain the most accurate interpretation pos-sible to assist them in their profession.
In the following chapter we evaluate the proposed representations by utilizing them with state of the art machine learning algorithms to predict patient’s hospitalization.
Chapter 3
Predicting hospitalization on a basic
representation of electronic medical
records
In this chapter we consider the task of predicting patient hospitalization from electronic medical records. We review state-of-the-art supervised machine learning algorithms rel-evant for this task and we report the results of our first experiments aiming to predict patient hospitalization by applying these algorithms to the basic vector representations of electronic medical records introduced in Chapter2.
We first present in Section3.1how we prepare our dataset to perform hospitalization predictions, then we introduce in Section3.2the relevant state of the art machine learning algorithms, whether sequential or non sequential. In Section3.3we describe our experi-mental protocol and present our results, and discuss them in Section3.4. Finally, we will conclude and discuss our perspectives for future work in Section3.5.
3.1 Prediction of hospitalisation from electronic medical
records
The prediction of hospitalization can be formulated as a classification problem, which aims to separate hospitalized and non hospitalized patients.
To learn a prediction model for hospitalization from Electronic medical records (EMRs), we need to consider a training set that discriminates EMRs of hospitalized
pa-CHAPTER 3. PREDICTING HOSPITALIZATION ON A BASIC REPRESENTATION OF ELECTRONIC MEDICAL RECORDS
tients and EMRs of non hospitalized patients. Patients who bear an explicit label indicat-ing a hospitalization in their records, within the fields related to the reasons for consul-tation and diagnoses, are the positive cases. The other patients are candidate negative cases; they were validated by a physician.
Generally, the EMRs of hospitalized patients contain an indication notifying the return of a patient from the hospital.
Consequently, in order to automatically identify the event of hospitalization (or return from hospitalization) from patient’s EMRs, we used the following regular expression over reasons for consultation and diagnoses:
1 (( h o s p i t a l [ A - z `A - ¨y ] + ) | ( h [ ^o o ] p i t a l )|( h o s p i )|( crh ))
Where ‘crh’ is the French abbreviation for hospital report.
This regular expression allowed us to consider for hospitalized patients, only consulta-tions that occurred before their hospitalization or before the decision to hospitalize them. Figure3.1displays the consultations thus considered for our vector representations.
Figure 3.1 – Diagram representing the consultations considered before (events from t0to tn−1) the detection of a hospitalization (event tn).
To construct Vi for our non sequential representation, as well as for xi for our
sequen-tial representation, we consider the following EMR fields: • sex
• birth year
• long term condition • risk factors
CHAPTER 3. PREDICTING HOSPITALIZATION ON A BASIC REPRESENTATION OF ELECTRONIC MEDICAL RECORDS
• reasons of consultation with their associated codes • medical observations
• diagnosis with their associated codes • care procedures
• the drugs prescribed with their associated codes • current health problems
• reasons of the prescription
In addition to the previous fields we added a number of fields for which we prefix the terms and concepts in order to capture the fact they apply to different aspects e.g. feature of a patient vs feature of the family of the patient. These prefixed fields are:
• patient’s history (prefix: ‘#history#’) • family history (prefix: ‘#family#’)
• past problems (prefix: ‘#past_problem#’) • symptoms (prefix: ‘#symptom#’)
• diagnosis of the patient with their associated codes (prefix: ‘#diagnosis#’)
The inclusion of a prefix to these fields allows us to distinguish them from other textual data related to the patient’s own record in the vector representation of EMRs.
To learn a prediction model, we extracted a balanced training set, DSB, from the
PRIMEGE database presented in Chapter2. Classification algorithms are sensitive to un-balanced datasets, and in such a case, they will mostly assign to new instances the ma-jority class label. Different methods exist to overcome this problem such as penalizing the cost function used, increasing or decreasing one of the two classes studied in a binary classification task. We use a balanced dataset in order to avoid going through this process. This dataset is composed of 714 hospitalized patients and 732 patients who were not hospitalized over a 4-year period. These patients who were not hospitalized, were ran-domly selected from the PRIMEGE database. Random selection of not hospitalized pa-tients was used to avoid human selection bias and thus, we obtained a representative sample of the population met by the general practitioner.
CHAPTER 3. PREDICTING HOSPITALIZATION ON A BASIC REPRESENTATION OF ELECTRONIC MEDICAL RECORDS
Finally our prediction task can be defined as: Let R be a representation of an EMR from the PRIMEGE Database P. Let L be the set of classes to predict L = {Hospi t al i zed , Not Hospi t al i zed }. We try to learn the mapping M: M(R) = L. Where M is a classification algorithm that predicts a class L for a given EMR R.
In the next section we review state of the art supervised non-sequential and sequential classification algorithms that can be used to predict the hospitalization of patients.
3.2 Relevant state of the art machine learning algorithms
As we were able to develop a labeled dataset for our task of predicting patient hospital-ization, we will rely on supervised machine learning algorithms to separate patients who require hospitalization from those who do not. Supervised learning consists in inferring a function from labeled training data to be able to classify new instances with the same labels learned from training examples.In addition to the aspects related to machine learning, human factors must be taken into consideration. Interpretability is a crucial aspect for a physician since it is not enough to predict that a patient will be hospitalized, he must be provided with the factors involved in this prediction. In order to comply with this condition, we selected state of the art machine learning algorithms accordingly.
In addition, the limited size of our dataset excluded from the scope of our study neural networks algorithms since they require large amounts of data, unless pre-trained repre-sentations are used. However, adapting them to a specific domain and a completely dif-ferent task can be complex or hardly feasible. The interpretability of such models is also questionable, although progress has been achieved in this direction with self-attention mechanisms and linear models on local approximationsRIBEIROet al.[2016].
3.2.1 Non sequential machine learning algorithms
For non sequential classification algorithms, we focus on three different machine learn-ing algorithms which are frequently used in the literature. They will serve to evaluate the impact of sequential machine learning algorithm and modelling on the prediction of pa-tients’ hospitalization based on their EMRs.
Among the algorithms that give feedback on what they have learned from a classi-fication problem, there are the logistic regression (LR) MCCULLAGH et NELDER [1989],
CHAPTER 3. PREDICTING HOSPITALIZATION ON A BASIC REPRESENTATION OF ELECTRONIC MEDICAL RECORDS
random forests (RF)BREIMAN[2001], and support vector machine (SVM)CHANGet LIN
[2011] with a linear kernel. SVMs are often used as a basis for comparison in natural lan-guage processing tasks. Moreover, logistic regression and random forest algorithms are widely used in order to predict risk factors in EMRsGOLDSTEINet al.[2017].
The principle behind the random forests algorithm is to learn in parallel, different de-cision trees trained with different subsets of features, which allow to avoid the limitations encountered with bagging trees that use all features. Another step of the random forest algorithm involves to aggregate by an ensemble learning method the learned decision trees. This implies that random forests do not use the same set of features at each new training phase if the number of features is large enough, which means that it is difficult to reproduce the same forest from one learning phase to another.
With a linear kernel, a support vector machine strives to determine the optimal hy-perplane, margin, for the simplest case between two classes to differentiate them. This notion of optimal is perceived differently between logistic regression and support vector machine, since logistic regression mostly considers all points in the search for the hyper-plane while support vector machine algorithm focuses mainly on points close to decision boundary. Of course, given the way these two algorithms operate, this implies the ability to linearly separate classes. More complex cases can be solved with a polynomial kernel for support vector machine, but this is at the expense of interpretability.
Initially, the logistic regression algorithm is used to perform binary classification, but some extensions allow it to be used with more classes. This algorithms assumes that there is a linear relationship between dependent and independent variables.
The logistic regression algorithm is defined as follows:
Ln( P
1 − P) = β0+ β1X1+ ... + βnXn (3.1) Where P is the probability to hospitalize a patient, Xn the variables to model, i.e., the
attributes used in our BOW, andβn the coefficients used by the regression. The
coeffi-cientsβn, of each variables Xnare delivered after the training of the algorithm.
We highlight the logistic regression algorithm as it is the one that has obtained the best performance in predicting patient hospitalization, especially with the injection of knowledge (see Chapters4and5).
CHAPTER 3. PREDICTING HOSPITALIZATION ON A BASIC REPRESENTATION OF ELECTRONIC MEDICAL RECORDS
3.2.2 Sequential machine learning algorithms
We will present in this section several Markovian models and what guided our choice towards one of them in particular. Markovian models share with the algorithms in the previous section the particularity of being interpretable since it is possible to obtain the weights of the state and transition characteristics.
Hidden Markov models (HMMs) use observations, labels about a classification prlem, and allow to assume the sequence of states involved in order to generate such ob-servations. Contrary to Markov chains, for hidden Markov models, the states involved to generate the observations are unknown.
Maximum entropy models (MEMMs) are discriminative models and thus consider a conditional probability distribution rather than a joint distribution. In a similar way to HMMs, the state of the current position in these models depends only on the state of the previous position. But they differ from HMMs in that they offer richer representations, where features of interest for natural language processing applications (like prefixes or suffixes) can be introduced.
CRFsSUTTONet al.[2012], like MEMMs, are discriminative models. Contrary to hid-den Markov models they do not require the assumption that the observations are inde-pendent especially because in many real-word cases we cannot assume that variables are not related to each other.
Among the existing sequential machine learning algorithms, we chose CRFs because HMMs are generative models, and MEMMs, which are discriminative models, have label bias issues: they proceed to a normalization at each state of the sequence whereas CRFs normalize the whole sequence.
Given s a sequence of consultations, i , the position of a consultation in a sequence of consultations and li, the current consultation, a linear-chain CRFs computes a
probabil-ity: P(l |s) = exp[Pm j =1 Pn i =1fj(s, i , li, li −1)] P l0exp[Pm j =1 Pn i =1fj(s, i , li0, li −10 )] (3.2) Where fj(s, i , li, li −1) is a feature function that estimates the likelihood that the current
consultation li belongs to a hospitalized patient given his previous consultation li −1.
CRFs can be compared to the logistic regression algorithm, as logistic regression is a log-linear model dedicated to classification and CRFs is a log-linear model dedicated to
CHAPTER 3. PREDICTING HOSPITALIZATION ON A BASIC REPRESENTATION OF ELECTRONIC MEDICAL RECORDS
sequential labels.
To assess the performance of the conditional random fields algorithm (CRFs) we relied on the sklearn-crfsuite library,1a CRFsuite wrapper.
3.3 Experimental study
3.3.1 Experimental setting
We evaluated our representations following the K-Fold method, a cross-validation strat-egy which allows us to test a classification algorithm across all the considered data. We chose K = 10, which allows us to separate the data in DSBinto 10 partitions with
approxi-mately 70 patients for each of the classes “hospitalized” and “not hospitalized”. It should be noted that the BOW from one fold to another may differ since the data used during training vary from one fold to another, and therefore a term may not be present in an-other training partition.
The different experiments were conducted on a Precision Tower 5810, 3.7GHz, 64GB RAM with a virtual environment under Python 3.5.4.
3.3.2 Search space for hyperparameters of machine learning
algo-rithms
We optimized the hyperparameters of the machine learning algorithms used in this study with nested-cross validationCAWLEYet TALBOT[2010] (see Figure3.2) in order to avoid bias, and the exploration was done with random searchBERGSTRAet BENGIO[2012].
The inner loop was executed with a L fixed at 2 over 7 iterations, which corresponds to 14 fits by machine learning algorithms. Optimizing with nested-cross validation allows to optimize machine learning models by generalizing the search of best hyperparameters on the training set instead of doing it on the test set. Different sets of hyperparameters are thus tested to select the one with the best performance on the inner loop.
Other techniques exist to explore the research space of the hyperparameters like grid search but this method is rather expensive in computation time and power efficiency. Op-timization with bayesian searchesSNOEKet al.[2012] is in the spotlight with the optimiza-tion of neural networks and very often proves to obtain more convincing results than grid