HAL Id: hal-00319754
https://hal.archives-ouvertes.fr/hal-00319754v2
Submitted on 11 Apr 2014HAL is a multi-disciplinary open access archive for the deposit and dissemination of sci-entific research documents, whether they are pub-lished or not. The documents may come from teaching and research institutions in France or abroad, or from public or private research centers.
L’archive ouverte pluridisciplinaire HAL, est destinée au dépôt et à la diffusion de documents scientifiques de niveau recherche, publiés ou non, émanant des établissements d’enseignement et de recherche français ou étrangers, des laboratoires publics ou privés.
Outcomes from the french national project drive :
Experimental data for the evaluation of hydrogen risks
onboard vehicles, the validation of numerical tools and
the edition of guidelines
Olivier Gentilhomme, Isabelle Tkatschenko, Guillaume Joncquet, Fabien
Anselmet
To cite this version:
Olivier Gentilhomme, Isabelle Tkatschenko, Guillaume Joncquet, Fabien Anselmet. Outcomes from the french national project drive : Experimental data for the evaluation of hydrogen risks onboard vehicles, the validation of numerical tools and the edition of guidelines. International Conference and Trade Fair on Hydrogen and Fuel Cell Technologies, Oct 2008, Hambourg, Germany. pp.100-119. �hal-00319754v2�
OUTCOMES FROM THE FRENCH NATIONAL
PROJECT
DRIVE
EXPERIMENTAL DATA FOR THE EVALUATION OF
HYDROGEN R I S K S ONBOARD VEHICLES, THE
VALIDATION OF NUMERICAL TOOLS AND THE EDITION OF
GUIDELINES
Gentilhomme Oliviera, Tkatschenko Isabelle13, Joncquet Guillaume0 and Anselmet Fabiend
a
INERIS - Parc Technologique ALATA - BP2 - 60550 VERNEUIL-EN-HALATTE (France). Email: olivier.gentilhomme@ineris.fr
b
CEA - CEA Saclay - DANS/DM2S/SFME bât. 454 - Point Courrier 47 - 91191 GIF-SUR-YVETTE (France). Email: isabelle.tkatschenko@cea.fr
c
PSA PEUGEOT CITROËN - 212 bd Pelletier - 78307 CARRIERES-SOUS-POISSY (France). Email: guillaume.joncquet@mpsa.com
d
IRPHE - 49 rue Frédéric Joliot Curie - BP 146- 13384 MARSEILLE (France). Email: anselmet@irphe. univ-mrs.fr
ABSTRACT
The ever-increasing use of hydrogen in the transport sector requires very high safety standards. However, due to the lack of information regarding the safety level of hydrogen systems, risk assessments tend to be over cautious in determining the consequences of accidental releases and could impose restrictive technical regulations. This drove the National Institute of Industrial Environment and Risks (INERIS) along with the French Atomic Energy Commission (CEA), the French automotive manufacturer PSA PEUGEOT CITROËN and the Research Institute on Unstable Phenomena (IRPHE) to submit with success a project called DRIVE to the National Research Agency. This project aims at providing quantitative experimental data for automotive applications and covers all aspects of the accidental chain: hydrogen releases, formation of an explosive atmosphere (ATEX1), ignition of the ATEX, flame propagation and its consequences. The work programme and first results are presented in this article.
l. INTRODUCTION
Hydrogen has been used in many industrial and commercial applications with quite an exemplary safety record. Should it become more extensively used in the transport industry, it is thought that the existing safety procedures and technologies will provide only limited guidance for hydrogen-powered vehicles. That is because hydrogen will be used within a decentralised infrastructure in relatively small amount (several kg per user) by a large population without special training in the safety of combustible gases (Breitung et al., 2007).
1
To ensure that this new technology is as safe as the conventional internal combustion engine, it is therefore important to identify as early as possible all unacceptable risks associated with the use of hydrogen onboard vehicle and to be efficient in controlling them. However, only a small number of these vehicles are in operation today and that limits quite significantly the data available on safety aspects. Because of this, risk assessments tend to be over cautious in determining the consequences of accidents and could impose restrictive regulations on hydrogen vehicle manufacturer.
2. BRIEF DESCRIPTION OF THE PROJECT
This motivated the National Institute of Industrial Environment and Risks (INERIS) along with the Atomic Energy Commission (CEA), the automotive manufacturer PSA PEUGEOT CITROËN and the Research Institute on Unstable Phenomena (IRPHE) to submit with success a project called DRIVE to the French National Research Agency.
The project was already described by Perrette et al. (2006, 2007) so it is not in the intention of this paper to go into too much detail regarding the structure and content of DRIVE. The interested reader is deeply advised to refer to these two publications to obtain more
information. This paper will rather focus on the latest outcomes, which have been quite
numerous over the past year.
Before doing so, let us briefly recall that the project dates back from the first semester of 2006 and will end at the end of year 2008. Its main goal is to provide experimental and numerical results to better assess hazards when hydrogen is handled onboard vehicles.
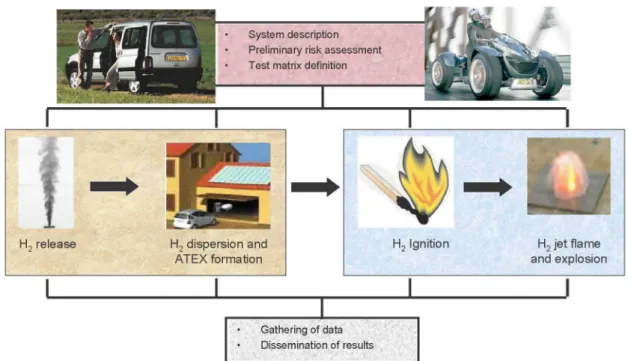
The work programme was divided into 4 modules (see Figure 1): • the Vehicle Safety module,
• the Hydrogen Release and Dispersion module, • the Hydrogen Ignition and Combustion module,
• and finally the Result Compilation and Dissemination module
The first module looked at the system of interest namely the fuel cell vehicle. Within this module, a risk assessment was performed so as to identity the hazardous events likely to be encountered during the life of the vehicle (running, stand-by, maintenance...). It is worth noting that the listed events were related to the use of hydrogen and the handling of pressurised gas but not to the voltage or other non-specific hazard. The outputs from this risk analysis helped us to define a test matrix that would be used for all the subsequent experimental and numerical tasks of DRIVE.
The main part of the project i.e. the quantification of the risks is dealt within the second and third modules. All possible aspects of the chain reaction leading to an hydrogen accident were indeed covered : first the release (see section 3), then the hydrogen dispersion in free or confined environment (see 4) which could lead to the formation of an EXplosive ATmosphere (or ATEX), the capability of a vehicle component, if present in the surroundings, to ignite this flammable mixture (see 5) and finally the consequences (see 6): the jet fire (spontaneous ignition) or the explosion (delayed ignition).
Finally, the fourth module is mainly interested in the dissemination of the results. Three main documents will be issued at the end of the project : (1) a detailed description of the investigated hazardous phenomena and the methodology to quantify their effects, (2) a list of potential failures and consequences onboard vehicle and the best design strategies to guarantee the safety of the vehicle and (3) the best practice recommendations for the use of CFD tools as a reliable means of predicting hazards.
System description Preliminary risk assessment Test matrix definition
H2 release H2 dispersion and
ATEX formation
I
H2 Ignition H2 jet flame
and explosion
Gathering of data Dissemination of results
Figure 1 : Structure of the DRIVE project
3. RELEASE QUANTIFICATION
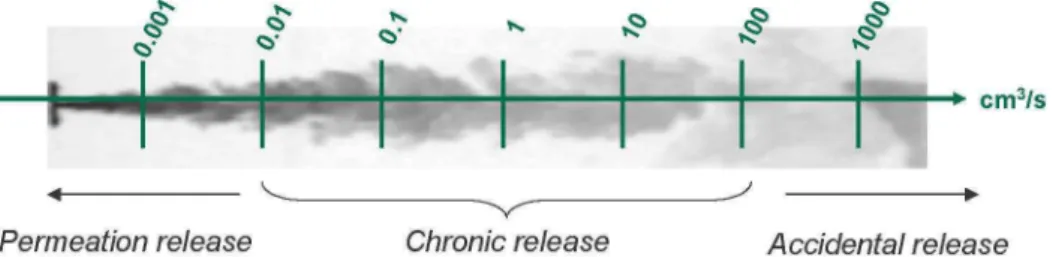
One of the preliminary requirements to ensure safety is to be able to control all releases that may come out from the different components of the hydrogen-powered vehicles. This will be possible only if we are capable of quantifying them. One can distinguish three types of release (see Figure 2) ;
• the permeation-type release : since permeation is inherent to hydrogen properties, this type of release will affect all components... even the brand new ones. The associated flow rates are usually so low (on the order of 10"6 to 10"2 cm3/s) that careful design and passive safety measures should be sufficient to prevent them from forming an ATEX. Furthermore, there exist analytical tools to quantify them (see Schefer, 2006).
• the accidental-type release : this release may arise from a car accident or a component rupture. Quite obviously, these situations will be seldom encountered onboard vehicles but means should be provided to limit the outflow that could be well above 10 - 100 cm3/s. Simple orifice models could be used to estimate this type of release while not forgetting that hydrogen does not behave like a perfect gas for pressures higher than 100 bar.
• The chronic-type release : it is quite difficult to predict the sealing behaviour of components as the vehicle will be ageing or will overcome various operations of maintenance throughout its life. In that case, it is thought that this so-called chronic release may progressively diverge from the one driven by permeation and become more and more of the same level of magnitude as the accidental release. This is definitely an area that can not be tackled by theoretical models and experiments were needed to quantify it.
* i
Permeation release
cm3/s
Chronic release Accidental release
Figure 2 : Proposed classification for the release
3.1 Test facility
To fill this gap of knowledge, one task of the project was aimed at measuring the release from key components of the hydrogen-powered vehicle after these latter were submitted to the various situations listed in Table 1.
Tested situations
Normal, hand and over-tightening of the connection
Repeated dismantling/re-assembly of the connection
Component heated during 100 hours at 80 °C
Mark in the fitting
Due to ...
Maintenance Maintenance
Ageing Maintenance or ageing
Table 1 : Situations undergone by the component before being tested
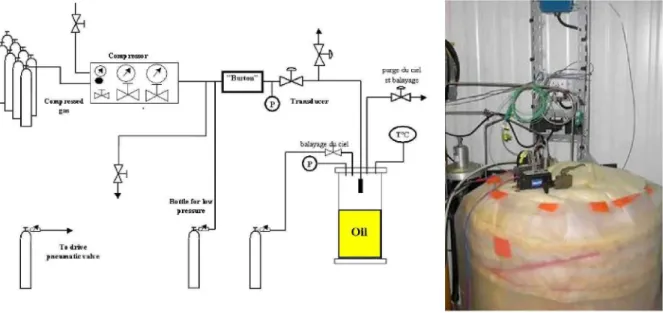
The facility used during the measurements is represented in Figure 3. These components were then placed within a 40-L chamber, which was entirely sealed and thermally insulated. Depending on their location in the vehicle, they were fed with hydrogen at varying pressure : from few bars for those located close to the conversion system (e.g. phase separator, one-way valve, hydrogen pump...) and up to hundreds of bars for those installed near the storage area (e.g. Staubli connection). In terms of instrumentation, there were a differential pressure transducer with a range of+/- 150 Pa and three thermocouples of the K-type. All measurements were performed in the top part of the chamber. In case of a hydrogen release, the volume of hydrogen VH2 (in m3) trapped into the chamber was determined by the following relation :
Where Pi and Ti correspond to the pressure (in Pa) and temperature (in K) measured in the chamber of volume V (in m3) during the release. Po and To are the atmospheric conditions and
AP the pressure difference between Pi and Po (given by the transducer).
Figure 3 : Test facility for release quantification
This equation highlights ;
1. why part of the chamber was filled with oil. By reducing the volume of air around the tested component, a given hydrogen leak Vm would result in a higher pressure rise AP in the chamber, hence improving the accuracy of the measurements. Oil was chosen for its low saturation pressure, which makes it very unlikely to vaporise at ambient temperature. Under this condition, any rise of pressure within the chamber was caused only by a hydrogen release and not by oil vaporisation.
2. the importance of controlling the temperature difference (Ti-T0) during the
measurements. Any drift of this parameter could be misinterpreted as a hydrogen release. Several means were achieved to prevent this situation from occurring ;
• the feeding line was plunged into the oil before being connected to the component, hence ensuring that hydrogen would be in thermal equilibrium with the chamber ; • the chamber was thermally insulated with a 10-cm thick mineral wall coating ; • tests were also conducted during the time of the day where the external
temperature was the most steady to avoid any steep variation of To.
All these efforts made it possible to measure release flow rates from the hydrogen components as low as 3xlO"4 cmVs.
3.2 Experimental results
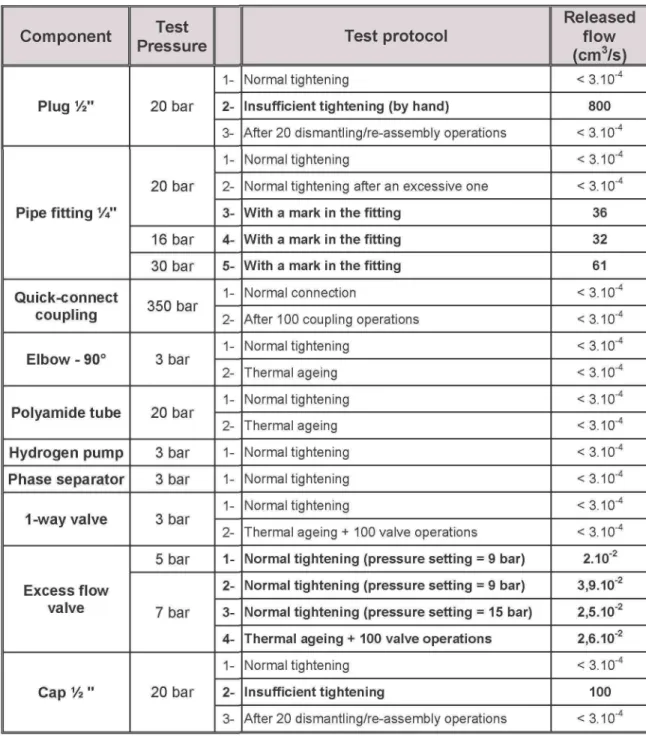
The results are listed in Table 2. A particular attention should be given to the maintenance because, as can be seen, most of the measured releases occurred from insufficient tightness.
As an example, tightening a plug V2 just by hand could lead to a release flow rate of 800 cmVs when this component will be operating at 20 bars. This corresponds to a maximum mass flow rate of about 0,01 kg/s under NTP conditions. It is also interesting to note that ageing had no or very little effect on the sealing behaviour of the components.
Component Plug 1/2" Pipe fitting V" Quick-connect coupling Elbow - 90° Polyamide tube Hydrogen pump Phase separator 1 -way valve Excess flow valve Cap % " Test Pressure 20 bar 20 bar 16 bar 30 bar 350 bar 3 bar 20 bar 3 bar 3 bar 3 bar 5 bar 7 bar 20 bar 1- 2- 3- 1- 2- 3- 4- 5- 1- 2- 1- 2- 1- 2- 1- 2- 1- 2- 3- 4- 1- 2- 3-Test protocol Normal tightening
Insufficient tightening (by hand)
After 20 dismantling/re-assembly operations Normal tightening
Normal tightening after an excessive one
With a mark in the fitting With a mark in the fitting With a mark in the fitting
Normal connection
After 100 coupling operations Normal tightening Thermal ageing Normal tightening Thermal ageing Normal tightening Normal tightening Normal tightening
Thermal ageing +100 valve operations
Normal tightening (pressure setting = 9 bar) Normal tightening (pressure setting = 9 bar) Normal tightening (pressure setting = 15 bar) Thermal ageing + 100 valve operations
Normal tightening
Insufficient tightening
After 20 dismantling/re-assembly operations
Released flow (cm3/s) <3.10"4 800 < 3.10"4 <3.10"4 < 3.10"4 36 32 61 <3.10"4 < 3.10"4 <3.10"4 <3.10"4 <3.10"4 < 3.10"4 < 3.10"4 < 3.10"4 < 3.10"4 < 3.10"4 2.10"2 3.9.10"2 2.5.10"2 2.6.10"2 < 3.10"4 100 < 3.10"4
4. HYDROGEN DISPERSION AND ATEX FORMATION
4.1 Gas dispersion in a confined environment
An hydrogen leakage occurring on a vehicle parked in a confined space is certainly one of these situations where it is important to fully understand all the mechanisms leading to the build-up of a potential ATEX. Another task was devoted to investigate the dispersion of hydrogen issuing from a non-catastrophic leak in a typical fuel cell car parked in a private garage.
4.1.1 Description of the garage
The experimental facility is pictured in Figure 4a. It was based on a rectangular box fully representative of a single-vehicle private garage. This garage had internal dimensions of 5.76 x 2.96 x 2.42 m3 and was fitted with a commercial tilting door at the front and a technical access door at the back. All the walls were made up of STYRODUR® panels joined together by means of an aluminium seal tape. This structure prevented any leakage from the garage (at least during the test duration) but could not withstand high overpressures. Consequently, there was a 200-mm diameter orifice in the lower part of the garage to ensure that this latter would be kept at atmospheric pressure throughout the release.
(a) picture taken from outside (b) Close-up view of the instrumentation installed in the garage
Figure 4 : Garage facility
There was no ventilation during the tests and, for safety reasons, hydrogen was replaced by helium. The use of helium to simulate the behaviour of hydrogen has already been the subject of numerous research studies (see for instance Swain, 1999) and proved well adapted for this kind of purpose. The release flow rates could be varied in the range of 0 - 700 NL/min by means of two flow controllers purchased from BROOKS Instrument and the garage was instrumented with a total of 10 K-type thermocouples and 64 calibrated mini-katharometers equally-distributed within the volume (see Figure 4b).
4.1.2 Commissioning tests of the garage
Preliminary tests were conducted to control the air-tightness of the garage. First of all, the mass balance was checked by comparing the concentration deduced from the injected mass of helium (and assuming a homogeneous distribution within the garage) with the concentration measured experimentally at the end of diffusion. The results turned out to be very close : (3.05 ± 0.08) % from the flow calculation and (3.04 ± 0.05) % from the concentration measurement. Then, the decay of two concentrations was monitored over a long time - up to 5 hours - and the leakage from the garage was found in both cases to be negligible: about 0.01 ACH2. The reproducibility of the results was also checked by performing twice the same test with a 1-month interval and was judged to be satisfactory. If necessary, this reassured us about the performance of our experimental facility.
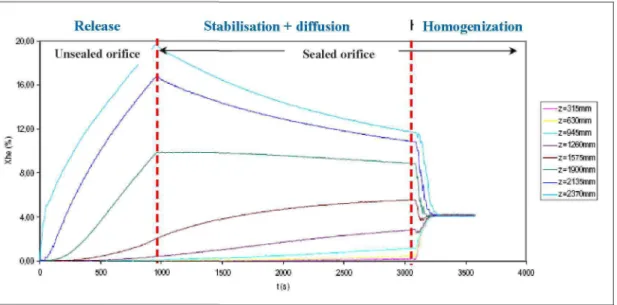
Each run consisted of the following steps (see Figure 5) :
1. helium was first released either as a jet or as a diffusive source under the conditions specified in the test matrix (flow rate, direction, location, duration) and with the orifice unsealed to avoid any over-pressurisation of the garage,
2. the orifice was sealed at the end of the release to investigate gas dispersion within the garage (= stabilisation + diffusion).
3. a final check of the mass balance was made by comparing the concentration measured at the end of diffusion (homogenisation sped up by means of four ventilation fans installed in the garage) with the value calculated from the injection parameters. * 1 0 0 - | 16.00 • 12.00 - e.oo- 4.00- noo-Release Unsealed orifice / / / / / / /
I / /
Stabilisation + diffusion *--., Sealed orifice^2!IIIIIII—-——^T"~r.
r Homogenization >1
- z = 3 1 3 n m z=630mm z=94mm -z=1260mm - z = i 5 r s n m -z=1900mm -z=213snm -z=237Onm 1000 1500 t ( s )Figure 5 : Typical evolution of gas concentration with time
4.1.3 Experiment results in a free volume
The first experiments were carried out with no vehicle in the garage. As an example, the following observations were made when helium was dispersed from an 20-mm diameter
2
orifice and at a height of 2 m. It should be pointed out that these geometrical features were not chosen arbitrarily but rather corresponded to the dimensions of a vehicle chimney3.
• Due to its high buoyancy and diffusivity, the gas ascended very quickly towards the ceiling of the garage and formed stratified layers whose concentration became higher with the height ;
• When present, the ATEX was only observed in the upper half of the garage ;
• The released flow rate (from 96 to 300 NL/min) seemed to have only a small effect on the volume and averaged concentration of the ATEX ;
• The volume of gas injected (from 1533 to 4088 NL, with a constant flow rate of 300 NL/min) had a more pronounced effect. Although the overall profile of gas concentration remained unchanged, it was found that a higher volume of injected gas not only increased the volume of the ATEX but also its averaged and maximal concentrations ;
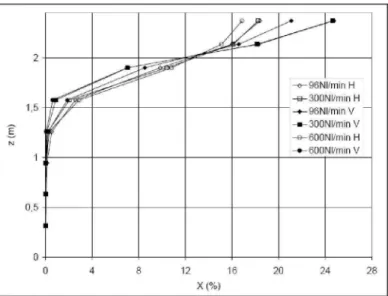
• The influence of the release direction was also investigated. Figure 6 shows the averaged profile of gas concentration measured in the garage for 3 different flow rates (from 96 to 300 NL/min) and 2 directions ("H" stands for horizontal and "V" for vertical). The vertical release tended to generate a smaller ATEX - but with a higher maximal concentration - than the horizontal one. Yet, the averaged concentration in the ATEX remained about the same.
2 • 1 i i 0,5 i n
-if/
I
,'min H -a-300NI/min H -»-96NI/minV -»-300NI/min V -^600NI/minV 0 4 12 16 20 24 28Figure 6 : Influence of the release direction on the ATEX features
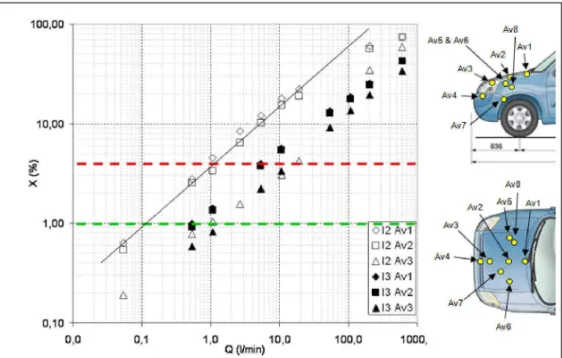
4.1.4 Experimental results with the vehicle parked in the garage
The second set of experiments has just been finished and the data are now being post-processed. It consisted in investigating the same scenarios as before but this time, with the fuel cell vehicle parked in the garage. Different locations were considered for the hydrogen
;
release : in the engine compartment, under the car and in the storage area. As an example, Figure 7 shows some of the results obtained. It should be pointed out that more data regarding this specific task with a full analysis of the results will be issued over the next coming months. ioa,aa 10,00 1.00 0.10 —: A i !
m
A : ; : i f : : : —i O/ -i ii 3 É 1 i A / i 1 É ' * ; i— a ». o D A • i: i: i: i: D A • A — — " v T Av2 Av3 Av1 • 13 Av2 Al3Av3 Aï 8 Aï 4 0.0 0.1 1 0 10.0 Q (l/min) 100,0 1000,Figure 7 : Effect of the release flow rate at two locations in the engine compartment
4.2 Gas dispersion in a free environment
Another task of the project was aimed at identifying and quantifying experimentally the main parameters that influence the dispersion of a high-pressure leakage within the vehicle or in its surroundings. This was achieved by investigating experimentally the so-called underexpanded axisymmetric jets with and without obstacle being present and up to a maximum release pressure of 150 bars. Once again, for all these tests, hydrogen was replaced by a non-reactive gas (air or helium). The first part of the task was interested in looking at the compressibility effects taking place in the near field region of the free jet using the BOS method.
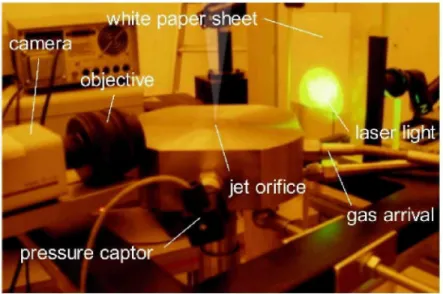
4.2.1 Experimental set-up
The experimental facility is pictured in Figure 8. The BOS method was used to detect the cell shocks induced by the jet in the near-field region (i.e. for X/De < 5 where X is the downstream
distance from the orifice and De the orifice diameter).
The facility was composed of a CCD camera, purchased from Kodak (ES 1.0, 9 \xm pixel size, 1008 x 1018 px) and fitted with a 50-mm lens coupled to additional rings and a background plane with randomly-distributed dots. This latter was simply a white paper sheet backlighted by a YAG laser spot (A = 532 nm, 10 ns pulse, 10 Hz). In this manner, each dot of this paper was captured by 2-3 pixels on the CCD ship and this was judged satisfactory for the measurements. Due to the presence of the jet, the point on the background from which the light is coming will appear on the camera as displaced and this displacement is directly related to the density gradients of the jet.
The first step of the protocol was to take a picture of the field without any flow (i.e. without displacement of the light) as a reference for the following measurements. Then, the jet was released from a tank whose internal pressure was monitored by means of a Keller sensor (1 kHz, 0 - 400 bars) through three different sizes of orifice : 1, 2 and 3 mm. The recording of picture and the light pulse of the Yag laser were triggered together and, for each measurement, a sequence of 200 images was taken. The mean displacement field was determined by cross-correlating the reference image with the 200 images containing the flow using an algorithm of Particle Image Velocimetry (PIV).
white p£
camera
T objective
pressure captor
|
iper sheet
-' jet orifice
vlasef light
-gas arrival
Figure 8: Test facility for the underexpanded jet investigation
4.2.2 Results
Figure 9 reports the magnitude of the light displacement for several tank pressures. Note that blue colours indicate no or weak displacements and red colours indicate important displacement of the background dots or, in other words, strong density gradients. In this study, all characteristic lengths were determined with an uncertainty of +/- 4 pixels on the correlated image.
For air jets, displacements are more pronounced in the compression zones as the tank pressure increases. This indicates that density gradients become stronger as the tank pressure increases. In helium jets, displacements due to compressibility effects are much harder to visualise because the density gradients due to helium molar mass are stronger than those generated by pure compressibility effects. Using such data, it is possible to get a good quantitative picture of an underexpanded jet.
Results (not shown here, but reported in Dubois et al., 2008) concerning the main features of the shock cells such as the Mach disk diameter and position or the lengths of the first and second shock cells were found to be in good agreement with the existing literature when the release pressure was low. Much higher pressures (i.e. up to 150 bars) are currently being investigated, and specific treatment of the raw data is also under development in order to quantitatively infer the density field from displacement vector fields such as those reported herein. Jets impacting obstacles of various shapes and sizes will also be investigated in the near future.
Figure 9 : Magnitude displacements (in pixels) reveal the evolution of the shock cells for the air (a), and the evolution of the shape of the helium jet (b), in function of the tank
pressure
5. HYDROGEN IGNITION BY VEHICLE COMPONENTS
In industry, the following strategy is used to minimise the risks from a fire or an explosion : • avoid the formation of an ATEX (both in time and space)
• avoid sources of ignition
• use suppression, containment or mitigation of the explosion
From the outcome of the release quantification, one has to consider that the formation of an ATEX might be possible under the bonnet, under the chassis or near the storage area... at least with the technology envisioned although admittedly in very specific situations. This implies that the likelihood of having a component in these areas acting as an ignition source has to be looked at.
ANY SOURCE OF IGNITION ?
Figure 10 : Zoning of the vehicle
Another task of the project was therefore intended to assess the ignition potential of some electrical and mechanical components of the vehicle. All components, likely to operate within an ATEX, were first listed and those, whose behaviour as an active source was highly suspected or hardly predictable, were then selected. The list eventually included :
Component
Ventilation fan Hydrogen sensor Pressure sensor Solenoid valve Water pump Air pump Electric motor RelaysQuantity
1 1 2 1 1 1 2 2Table 3 : Selected components for the ignition tests
The experimental set-up is illustrated in Figure 11. The components were placed inside an explosion chamber to undergo the ignition test. They were functioning during 10 minutes while being exposed to two different hydrogen-air mixtures : 10 and 28%. Concerning the choice of these values, it is worth mentioning that :
• in both cases, the mixture is well within the flammability range of hydrogen (4-75 % in vol.)
• 28 % is a severe but very unlikely concentration of exposition. This corresponds to the stoechiometric ratio of hydrogen and it is well known that, under this condition, the MIE4 is the lowest... about 20 \xL
• 10 % is a less severe exposition but more probable in case of a foreseeable fault. The MIE is approximately 2.5 times higher than the stoechiometric value.
At the present time, the results are still being analysed.
i — Air mass flow rate H2 mass flow rate — i À Reference Test chamber with Qe||
tested component inside \ /—-N \ _ A \ : ^ — - " : :
Thermocouple Thermocouple TTiermo - Oxvqen located within the placed on the couple in sensor
test chamber component the cell
Figure 11 : Experimental set-up for the ignition tests
' Minimum Ignition Energy i.e. the minimum energy required to ignite the flammable atmosphere
6. HYDROGEN FIRE AND EXPLOSION
As indicated before, the ignition of a hydrogen release could result in two hazardous phenomena:
• If the release finds very rapidly an ignition source then the resulting jet fire will burn until the supply is controlled or exhausted and could result in radiation and fire damage. This situation could be met onboard a vehicle following the activation of a temperature triggered pressure relief device5 (PRD).
• In the result of delayed ignition, a flammable cloud may first form which could in turn lead to an explosion with undesirable consequences. Indeed, in case of hydrogen being released into the engine compartment, an ATEX could be allowed to form and drift in this confined area before finding a source of ignition.
In both cases, it is important to quantify the thermal and/or mechanical effects that may result from such phenomena.
6.1 Jet fire experiments
This first part of the task was aimed at investigating the consequences of a high-pressure hydrogen jet flame by measuring its length and radiated flux. The figure below gives a schematic picture of the facility.
Electio-pneumatic valve
Fire-pro of wall
Type-III vessel Pipe : 10mm ID 2 Ê . Î L volume x 10m length
1 J m
7 7 7 7 7 7 7
v////////////
Figure 12 : Schematic picture of the jet fire facility
It consisted in releasing hydrogen from a type-III vessel and in igniting the jet using a gas burner. Though the vessel was normally capable of withstanding pressures as high as 1600 bars, the discharge pressure was purposefully limited to 900 bars and all the tests were conducted in a gallery to confine any effect that may arise from a potential bursting. This 26.5-L vessel was connected to the nozzle orifice via a 10-m pipe with a constant diameter of
5
The PRD is a safety device that opens and releases the gas to the ambient environment in order to limit a potentially dangerous internal pressure increase in the event of a fire.
10 mm in order to minimise the pressure loss that might be generated due to the flowing of hydrogen. Blowdown was activated using a remotely operated valve located just upstream of the nozzle. The jet issued through different orifice diameters varying from 1 to 10 mm and 1.5 m above the ground. It is also worth pointing out that the vessel was protected from any thermal effect induced by the flame by means of a fireproof wall. The released mass flow was determined by two ways : (1) by measuring continuously the weight of the vessel throughout the blowdown (and consequently the mass of hydrogen leaving the storage) and (2) by measuring the pressure drop across the orifice. It is then possible to determine the outflow using a simple orifice model and a suitable state equation to account for the behaviour of hydrogen at high pressure.
In front of the orifice, there were 10 thermocouples of the C-type to determine the burning efficiency. They had a thickness of about 2 mm and were able to measure a maximum temperature of 2600 °C. Heat flux was also measured by means of 5 flux meters regularly-spaced and positioned at an angle of 45° relative to the jet centreline. Visible light and infrared images were also recorded to determine the flame length. The cameras were positioned in a small alcove within the gallery and approximately 5-m from the jet centreline. During the preliminary tests, this distance turned out not to be sufficient to cover the whole length of the flame and fish-eyes were consequently fitted to the lenses to broaden the view. Typical snapshots of the jet fire when hydrogen was released from a vessel initially pressurised at 100 bars can be found in Figure 13. They were taken from the visible light camera with a sampling rate of 50 pictures per second during the complete blowdown of the vessel, which lasted about 10 s. All pictures were post-processed using Matlab so as to determine the visible flame length. As illustrated on the right-hand side of Figure 13, it was then possible to plot the variation of this flame length with the release mass flow (calculated from the pressure drop across the orifice and assuming that hydrogen behaves like a perfect gas) for different orifice diameters.
75 bars 50 bars 30 bars 15 bars o 7 6 l s
-f
1 4 re 3 2 1 0 -n • ° A A ^ A A g " Ar
r
A A * 4mm • 7mm A 10mm 20 40 60 80 100 flowrate (g/s) 120 140Figure 13 : Flame length vs. released mass flow (vessel initially pressurised at 100 bars)
At the time of writing this paper, this subtask is still underway and data at a much higher release pressure will be made available soon.
6.2 Explosion experiments
The second subtask has not started yet. It will be aimed at gaining further insights into the effect of varying parameters (such as the location and the direction of the release, the ignition delay or the presence of obstacles) on the flame propagation within a flammable mixture of air and hydrogen.
The rig used for these experiments is pictured in Figure 14. It is fully representative of an engine compartment since it features a leaning wall at the top, small openings at the front and no wall underneath. Tests will be based on the matrix defined during the risk assessment.
Figure 14 : Rig used for the explosion tests
8. CONCLUSIONS
This paper was intended to give an overview of the latest outcomes from the French project DRIVE whose motivation is the safe use of hydrogen in fuel cell vehicles. This project started in the beginning of 2006 and will finish at the end of this year. The main objective is to gather experimental data on the whole chain leading to an hydrogen accident i.e. release —» gas dispersion and formation of ATEX —» ignition —» jet fire / explosion :
• the release quantification is now completed and allowed us to collect some valuable data regarding the flow rate that might be released from different components as the vehicle will be ageing ;
• the task dealing with gas dispersion (and ATEX formation) is now partly finished. The release scenarios were all tested within the garage, both with and without the vehicle inside, and the data are now being post-processed. The investigation of the under-expanded free jet is still underway ;
• the ignition potential of several components of the vehicle has been assessed and the results are now analysed ;
• the experimental programme investigating the consequences of an ignition is still underway. The first part dealing with jet fires is nearly finished whereas the second part looking at the effects of an explosion within the engine compartment will begin soon.
ACKNOWLEDGEMENTS
Authors would like to thank the French National Research Agency ANR and particularly its hydrogen programme PAN-H that supports financially this project.
REFERENCES
Breitung W., Mechanistic Safety Analysis of Hydrogen Based Energy Systems, 2nd Summer School on Hydrogen Safety, 2007.
Dubois J., Amielh M., Anselmet F. and Gentilhomme O., Comparative investigation of axisymmetric underexpanded air and helium jets by BOS, 13th International Symposium on Flow Visualization (ISFV), Nice 2008.
Perrette L., Paillere H. and Joncquet G., "Presentation of the French national project DRIVE : Experimental Data for the Evaluation of hydrogen Risks onboard vehicles, the validation of numerical tools and the Edition of guidelines", World Hydrogen Energy Conference (WHEC), Lyon 2006.
Perrette L., Paillere H. and Joncquet G., "Presentation of the French national project DRIVE : Experimental Data for the Evaluation of hydrogen Risks onboard vehicles, the validation of numerical tools and the Edition of guidelines", Society of Automotive Engineer (SAE), Detroit 2007.
ScheferR.W., Houf W.G., SanMarchi C , Chernicoff W.P. andEnglomL., "Characterisation of leaks from compressed hydrogen dispensing systems and related components",
International Journal of Hydrogen Energy, Vol. 31, Issue 9, pp. 1247-1260, 2006.
Swain R.M., Grilliot E.S. and Swain M.N., "Experimental Verification of a Hydrogen Risk Assessment Method", American Chemical Society, 1999.