HAL Id: halshs-01245496
https://halshs.archives-ouvertes.fr/halshs-01245496
Preprint submitted on 17 Dec 2015HAL is a multi-disciplinary open access archive for the deposit and dissemination of sci-entific research documents, whether they are pub-lished or not. The documents may come from teaching and research institutions in France or
L’archive ouverte pluridisciplinaire HAL, est destinée au dépôt et à la diffusion de documents scientifiques de niveau recherche, publiés ou non, émanant des établissements d’enseignement et de recherche français ou étrangers, des laboratoires
Mining Royalties and Incentives for Security Operations:
Evidence from India’s Red Corridor
Oliver Vanden Eynde
To cite this version:
Oliver Vanden Eynde. Mining Royalties and Incentives for Security Operations: Evidence from India’s Red Corridor. 2015. �halshs-01245496�
WORKING PAPER N° 2015 – 42
Mining Royalties and Incentives for Security Operations:
Evidence from India’s Red Corridor
Oliver Vanden Eynde
JEL Codes:
Keywords: Conflict, taxation, natural resources
P
ARIS-
JOURDANS
CIENCESE
CONOMIQUES48, BD JOURDAN – E.N.S. – 75014 PARIS
TÉL. : 33(0) 1 43 13 63 00 – FAX : 33 (0) 1 43 13 63 10
Mining Royalties and Incentives for Security Operations:
Evidence from India’s Red Corridor
Oliver Vanden Eynde* 15 December 2015
Abstract
Can tax regimes shape the incentives of governments to engage in or support counter-insurgency operations? India’s Maoist belt contains a large share of the country’s most valuable mineral deposits. Indian mining royalties benefit the States, but they are set by the central government. States are largely responsible for counter-insurgency op-erations within their territory. Therefore, the royalty regime could shape the incentive of states to support counter-insurgency efforts ien mining areas. This paper exploits the introduction of a 10% ad valorem tax on iron ore that was responsible for a 10-fold increase in royalty collections by the affected State governments. In a panel of district-level violence outcomes between 2007 and 2011, I find that the royalty hike was followed by a significant intensification of State violence in those districts that contain deposits of iron ore. There is no such impact for the deposits of other key minerals that were not subject to the royalty hike: bauxite and coal. These results are consistent with states taking the fiscal value of districts into account when they decide on the intensity of security operations.
Introduction
At the heart of any state is its ability to generate revenue from taxes. Fiscal policy could have important implications for the cost of fighting insurgencies and the prize of ”winning”
*
Paris School of Economics. Email: [email protected]. Part of this project was carried out while the author was a visiting researcher at Princeton university (supported by AFOSR grant #FA9550-09-1-0314). ONR grant #N00014-14-1-0843 supported part of the data collection. I would like to thank Ethan Kapstein, Eoin McGuirk, Jacob Shapiro, Cyrus Samii, and Chris Woodruff for helpful comments on earlier drafts. This paper also benefited from discussions with seminar participants at the Princeton Workshop on Conflict in India, the ESOC Annual Meeting, PACDEV, EUDN, NYU Abu Dhabi, the NBER Summer Institute, and NEUDC.
violent contest. However, the public finance of civil conflict has received very little attention so far. Theories of civil conflict typically assume a weakly institutionalized environment, in which rebels and states fight over abstract prizes. The reality of conflict is often one in which complex institutions and policies constrain the behavior of the state and the prize of the contest. These constraints are particularly relevant in decentralized countries, where successful counterinsurgency requires co-ordination between and support from different levels of government. In such an environment, I study the impact of a tax regime that dramatically increased the value of controlling territory for sub-national government.
My paper exploits the introduction of a 10% ad valorem tax on iron ore in India. This royalty regime was set by the Central government, but its benefits accrued entirely to the states. Earlier, states received only 27 Rs (around $0.5) per tonne of iron ore mined within their boundaries. In an attempt to compensate states for complementary investments in iron production and to curb illegal mining, the state introduced a 10% ad valorem tax in August 2009. The introduction of the new royalty regime was followed by a 10-fold increase in the royalty collections of the affected states. The new iron ore royalties contributed up to 5% of the state budgets (at a value of up to 1% of the state GDP). Among the prime beneficiaries of the royalty increase were three states in India’s so-called ”Red Corridor”, the broad region in the central East of the country that is severely affected by a long-standing conflict between Maoist insurgents and the Indian state. As state governments are fully responsible for managing counter-insurgency efforts within their territory, the royalty hike could have affected their incentives to allocate efforts in iron-rich districts.
My findings suggest that the number of incidents in which government forces killed Maoists and/or their supporters doubled in iron districts after the introduction of the 10% royalty. This effect holds for districts with economically valuable iron ore deposits, as well as those with existing iron ore production. Strikingly, there is no such an effect for districts that hold deposits and/or existing mines of bauxite and coal - two key minerals that did not experience a comparable royalty hike. Given the economic importance of coal and bauxite for the affected states, this result constitutes a powerful placebo test. The results of this paper are consistent with the idea that an increase in tax revenues in conflict zones could incentivize lower-tier governments to increase counter-insurgency efforts. The budgetary impact of the iron ore royalties cannot explain these findings in itself. The main findings are based on within-state variation, but all royalty revenues are centralized at the state-level. Hence, there exists no obligation for state governments to target iron districts in response to a revenue windfall. Moreover, I find that the response to the royalty change is stronger for violence directed at Maoist rebels than for the violence directed by Maoists against the
state or civilians. This finding is consistent with the first order effect of changing fiscal incentives operating through the states’ strategy.
The intensification of violence in iron ore districts is consistent with fiscal revenues entering into the marginal returns to police effort. However, heterogeneity in the main effect points towards an additional mechanism. The increase in fatal security force attacks appears to be stronger in districts with a larger share of private mining activity and more illegal mining activity. This result suggests that the mechanism underlying the main results could be more subtle than an increased return to police efforts in iron districts. Observers of the Maoist conflict have suggested a nexus between private firms, state government officials, and Maoist rebels, who share the rents of illegal mining activity.1 In such an environment, a fiscal shock that boosts the revenue of legal mining activity could offer incentives for state officials to break these collusive arrangements. Under this hypothesis, the responsiveness of police violence to the royalty change should be higher in districts with more private mining activity, as I observe in the data.
It is important to acknowledge that this paper cannot determine whether incentiviz-ing lower-level authorities is desirable from a welfare perspective. In particular, increased counter-insurgency efforts could lead to human rights abuses. Moreover, any government action that facilitates mining activity (legal or illegal) could generate negative externalities in the form of population displacement and environmental damage. In India’s Maoist con-flict, these concerns are real. Regardless of the sign of the net benefits from Goverment actions, the findings of this paper are important to understand the strategic behavior of state actors. As many developing countries are decentralizing political power, understanding how fiscal decentralization shapes conflict resolution and counter-insurgency strategies has clear relevance beyond India.
A large literature has explored how either the presence of natural resources or commod-ity price shocks affect conflict.2 Collier and Hoeffler (2004) argue that the presence of oil wealth increases the probability of conflict, which is suggestive of a "resource curse". In a more recent contribution Lei and Michaels (2013) find that discoveries of large oil fields increase the likelihood of conflict onset. Brückner and Ciccone (2009) find that commodity price slumps increase the onset of civil war in Sub-Saharan Africa, whereas Berman, Cout-tenier, Rohner and Thoenig (2015) find that price shocks boost violence in the same region using grid-cell level data. In a recent paper, Bazzi and Blattman (2014) find no relationship between commodity prices and the onset of conflict in a cross-country panel, but they do
1Section 1 describes the background in more detail.
observe that rising prices tend to shorten wars. The theoretical work by Dal Bó and Dal Bó (2011) argues that the sign of the relationship between commodity price shocks and conflict depends on third factors. In an empirical test of this hypothesis, Dube and Var-gas (2013) show how increased coffee prices reduce violence, whereas increased oil prices boost violence. They argue that the relative capital intensity of oil versus coffee explains why the so-called opportunity versus rapacity effects dominate respectively. In general, the literature largely abstracts from the way in which resource rents benefit the parties engaged in conflict. In a related contribution, Sanchez de la Sierra (2015) links mineral booms for different types of minerals to differential patterns in the provision of public goods and tax-ation by rebels in the DRC. Rather than focusing on how rebel groups contribute to state formation, my paper studies the behavior of state actors in a country with relatively well established institutions. In this context, I highlight how these institutions, and in particular the fiscal regimes that characterize them, can shape the incentives of state actors to engage in conflict.3 The context of India’s Naxalite conflict is particularly interesting because it allows me for a direct test of the impact of the royalty regime, using a diff-in-diff approach. This paper also contributes to the small literature on fiscal capacity and decentralization in conflict zones. In a contribution that is close to my paper, Berman, Felter, Kapstein and Troland (2015) argue that potential tax revenues motivate governments to capture territory. They find that increased private investment in the Philippines boosts both government and rebel violence.4 In the context of Mexico’s drugs war, Dell (2016) finds that small vic-tories at the municipal level by the party in power at the national level leads to increased police efforts and a relocation of violence. Her work confirms that the interaction between different levels of government can shape the actions of security forces that are engaged in conflict. Bazzi and Gudgeon (2015) find that political decentralization can reduce conflict if polarization is sufficiently limited.5 My paper adds to this literature by showing that tax regimes in decentralized countries could offer incentives for security operations that are under the control of local governments. The interaction between central and state-level
3
Dube and Vargas (2013) suggest that the decentralization of oil revenues could have made the relationship between oil prices and conflict stronger in the Colombian context. Their hypothesis is that it is easier for rebels to extort rents if revenues are managed by municipalities. However, the authors do not analyze the impact of this fiscal regime explicitly. Given the size of Indian states, the decentralization of revenues is unlikely to have boosted violence through this channel in India’s Naxalite insurgency.
4
My paper also studies how tax revenues provide incentives for security operations, but than focusing on the effect of changes in the tax base, my paper explores exogenous variation in the rate at which state actors can tax certain sectors.
5
Fetzer and Marden (2015) offer another example of how regulation can affect conflict outcomes in an instututionalized environment. They find that the establishment of environmental protection zones reduces land conflict in Brazil.
governments in India’s Naxalite conflict can be interpreted as a principal-agent relationship, similar for example to interaction between a government and its tax inspectors.6 However, the role of fiscal incentives in security operations has remained understudied. The existing literature on conflict and fiscal capacity has a focus that is very different from mine. In the spirit of Tilly’s work (Charles Tilly, 1990), Besley and Persson (2010) argue that external war threats played a crucial role in the development of state capacity.7 My paper explores a reverse relationship: the development of fiscal institutions could actually strengthen the incentives of actors within the political system to bring weakly governed spaces under its control. My results are consistent with a broader idea that the states may choose not to in-vest in government capacity in areas with limited economic value. Finally, this paper adds to a growing body of work on India’s Naxalite insurgency. This conflict poses a massive developmental challenge in addition to the obvious security concerns. A recent study has put the economic cost of the conflict at 12% of the GDP of affected States (Nilakanton and Singhal, 2010). These economic costs are particularly grave as the affected regions are among India’s poorest and are characterised by a large share of scheduled tribes, as high-lighted by a recent Planning Commission report (Planning Commission, 2008). The same report identifies the underdevelopment of Naxalite areas as a key driver of the conflict. In this context, understanding the ingredients of successful government intervention is par-ticularly important. Vanden Eynde (2015) finds that Maoist violence responds to rainfall shocks, but that the sign of this relationship depends on the type of the mineral resources as well as the target of rebel violence.8 In a recent contribution, Azam and Bhatia (2013) argue that states strategically initiate conflict in mining zones in order to lure central police forces into the conflict and use their support to clear mining areas from the local population.9 My
6
In Pakistan, Khan, Khwaja and Olken (2014) confirm that performance pay for inspectors increases tax collection, albeit at the cost of higher corruption. The principal agent-relationship between the Central Indian Government and the Naxalite-affected states can also be interpreted through the lense of the indirect control framework introduced by Padro i Miquel and Yared (2012).
7
Shapiro, Steele and Vargas (2014) study endogenous taxation in the context of Colombia’s civil war. These authors find that local tax institutions tend reflect the preferences of the parties engaged in violence.
8
Gawende, Kapur and Satyanath (2012) also find that rainfall shocks affect the intensity of Naxalite vio-lence, and that the general direction of this relationship is negative. They argue that this impact works through the greenness of vegetation. Fetzer (2014) shows that the sensitivity of the conflict to rainfall reduced after the introduction of MNREGA. Focusing on the immediate aftermath of the introduction of MNREGA, Khanna and Zimmermann (2014) find instead that MNREGA increases violence.
9In contrast to these authors, I do not study the different role played by central versus local forces in the
conflict. As the states are formally responsible for all counter-insurgency efforts on their territory, my paper focuses on any type of Government violence. My paper also differs in focus from the work of Azam and Bhatia (2013), because I remain agnostic about the net benefits of increased government activism in iron districts. In their theory, the state’s sole objective is to attack the population, while the Maoists’ sole objective is to protect the population. The data required to assess of the net benefits of police operations are not available.
work complements the findings of these authors, because it shows that specific fiscal poli-cies can alter the anti-insurgency efforts of political units within a federal state. Finally, a recent contribution by Pasquale (2014) finds that ethnic quotas in village level authorities reduce Maoist violence. While focusing on a different level of government than my paper, this author confirms the importance of political institutions in India’s Maoist conflict.
This paper is organized as follows. First, I describe India’s mining royalty regime. Second, I provide some background on the Maoist conflict. Third, I introduce the dataset, then the empirical strategy. In the fifth section I present the main results, and finally I offer some additional interpretation and a conclusion.
1
Mining royalties in India
India ranks among the world’s top producers of Iron ore, bauxite, and coal (Ministry of Mines, 2012). In India’s federal structure, the management of mineral resources is a shared responsibility between the central Government of India and the state governments, as pre-scribed by the Mines and Minerals Development and Regulation [MMDR] Act 1957. The central Government sets the royalty rates on mineral output as well as any "dead rent" (charged if output is too low). The Union Ministry of Environment and Forest is also re-sponsible for issuing environmental clearances. While the State Governments are the legal owners of all major mineral resources (with the exception of uranium), their ability to profit from mining activity is severely restricted by the fact that they cannot set royalty rates or dead rents. They do have the legal power to grant licenses, but the licenses in themselves cannot be sold.10 Hence, royalties and dead rents are the main sources of direct revenue from mining activity that accrue to the State Governments.
The MMDR 1957 allows the Centre to change royalty rates every three years. Oc-casional changes have created a complex system of royalty formulas that differ for each mineral. The 2009 round of royalty revisions is of particular interest for this paper. As part of the 12 August 2009 revision, most major minerals (with the exception of coal) saw a lim-ited increase in royalty rates. However, Iron ore royalties used to be levied per metric tonne, at a rate of 27 Rs in 2009. Instead, the Centre introduced a 10% ad valorem tax, that led to an immediate increase of per unit royalty rates by a factor of 5. In combination with gradual price increases from early 2010 onwards, the royalty collections on iron ore increased by a
10Reconnaissance Permits, Prospect Licenses, and Mining Leases are attributed on a "first come, first serve"
basis (http://mines.nic.in/faq.html, accessed December 2013). The application fee is negligible and set by the Centre, under the Mineral Concession Rules, 1960. However, states can still try to benefit from licenses by favoring companies that carry out complementary investments in their states.
Table 1: State-wise Royalty Collection of Iron Ore in India (Million $) % of GDP % of Budget States 2008-09 2009-10 2010-11 2010-11 2010-11 Andhra Pradesh 3.3 5.9 2.1 Chhattisgarh 11.9 70.0 201.1 1.1 6.1 Goa 5.3 55.6 187.0 Gujarat - 0.0 -Jharkhand 6.9 30.1 74.0 0.5 4.2 Karnataka 20.8 62.4 111.3 Madhya Pradesh 0.1 0.4 1.6 Maharashtra 0.1 0.3 3.9 Odisha 29.1 130.4 361.1 1.1 5.6 Rajasthan 0.0 0.1 0.1
Source: Royalty figures from the Ministry of Mines. GDP data from the Ministry of statistics and Program Implementation. State Budget (2010-2011) for Jharkhand, Chhattisgarh, and Orissa from the Ministry of Finance.
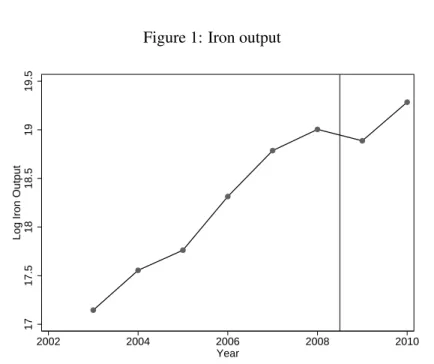
Figure 1: Iron output
17 17.5 18 18.5 19 19.5
Log Iron Output
2002 2004 2006 2008 2010
Year
factor of more than 10 in the affected states (Table 1). The royalty collections on iron ore in 2010-2011 accounted for more than 1% of the state GDP. Figure 1 shows that iron output did not increase in 2009 (and even experienced a bit of a slump before recovering in 2010). Bauxite was one of the minerals that experienced a small change in royalty rates in 2009. Bauxite had been subject to a royalty of 1% of the international aluminum price (at the London Metal Exchange), and saw this rate increased to 1.5%.
The empirical analysis of my paper will exploit the introduction of the new royalty regime on 12 August 2009. While the implementation date of the new law is certain, it is clear that I cannot exclude anticipation. The earliest rumors of a royalty hike can be traced back to September 2007, when a study group at the Ministry of Mines formulated a rec-ommendation to switch to such a regime. This report was a mere internal recrec-ommendation and the intention of the Government was still unclear at that point in time. The risk of inflation is cited as one of the reasons why the Government asked the Ministry of mines to delay the implementation of the proposal in June 2008 (The Economic Times, 2008). The Government’s plans to change its royalty policies became took clearer shape in February 2009, when new and substantially higher royalties were introduced for uranium. Uranium is the only mineral that is completely controlled by the central government, but the press release for uranium royalties noted that negotiations over new royalty rates on other ma-jor minerals had started. However, this process was almost certainly delayed by the 2009 general elections, which took place between April and May 2009. The 10% ad valorem royalty rate was officially proposed by the Ministry of Mines towards the end June 2009 (The Economic Times June 2009), and sent to the cabinet for final approval. The cabinet approved the royalty regime on 12 August 2009, and the implementation was effective on the same date. While it is possible that State Governments became increasingly certain of the imminent overhaul of the existing system, the exact timing of the approval was hard to predict given the timing of the general elections, the interaction between the ministry of mines and the entire cabinet, and the merely advisory role of State Governments.
The argument in favor of a royalty hike (in combination with a shift to an ad valorem system) focused on the need for ”fair compensation” of state Governments, in the light of recent windfall revenues for miners who had benefited from the strong demand for iron ore in China. The example of other iron rich countries that rely on ad valorem taxes (e.g. Aus-tralia and Brazil) could also have played a role (Ministry of Mines, 2007). The final press release also invokes an efficiency argument: ad valorem taxes limit the need for ad hoc changes in royalty rates (Ministry of Mines, 2009). Interestingly, Government and press reports on the changing royalty regime do not focus on the Naxalite conflict. The law did
not exclusively affect conflict zones either, as iron-rich districts in Goa and Karnataka have not been severely affected by Maoist violence. In fact, these two states were at the centre of highly visible mining scams - which are important for the context of this paper. In Kar-nataka, high-ranking members of State Government were found to have managed illegal mining businesses and became the subject of a Central Bureau of Investigation (CBI) in-quiry in December 2009. The deep-rooted nature of illegal iron ore mining led the Supreme Court to establish a ban on iron ore exports in Karnataka and Goa. The prevalence of illegal mining is consistent with the weak incentives offered to State Governments to encourage le-gal mining activity. Illele-gal mining clearly enables the evasion of mining royalties, although the very low historical royalty rates served to mitigate this advantage. However, most ille-gal mining activity entailed a violation of environmental regulations, for instance by mining outside of the area for which a company had received environmental clearance (so-called ”excess mining”), or by continued operation after the expiration of the lease. It is striking that the willingness of State Governments to act against illegal mining increased only after the introduction of a royalty regime that guaranteed substantial revenues from legal mining activity. Therefore, the discovery of mining scams could be the result of the introduction of higher royalties, which provided incentives to politicians to speak out against corruption. Actions to bring mining activity under control of the State could explain why mining output did not increase further after the introduction of the new royalty regime (as shown in figure 1).
2
India’s Maoist Conflict
India’s Maoist (or Naxalite) conflict can be traced back to a peasant uprising that origi-nated from the West-Bengali village of Naxalbari in the late 1960s. The sympathisers of the uprising founded the All India Coordination Committee of Communist Revolutionaries, which promoted the “Allegiance to the armed struggle and non-participation in elections”. Between 1970 and 2000, different Naxalite groups challenged each other as much as the Indian states. However, 2004 saw a major break when the two main Naxalite outlets joined forces in the newly founded Communist Party of India (Maoist), or CPI(Maoist) (Kujur, 2009). The present-day CPI (Maoist) has retained a commitment to armed struggle with a view to overthrow the Indian state, while opposing any kind of participation in democratic elections. The 2004 merger was followed by a marked intensification of the conflict. In 2006, the Naxalite movement was famously described by the Indian Prime Minister Man-mohan Singh as “the single biggest internal security challenge ever faced by our country”
(Economist Feb 2010). Over the 2005-2010 period, the conflict has claimed more than 5,000 lives. The continuing popularity and strength of the Naxalite movement is perceived to stem from chronic underdevelopment in the affected communities (Borooah, 2008).
Many observers have pointed out the close link between the Maoist movement and the mining industry. Naxalite rebels are thought to benefit from mining revenues through extortion and the facilitation of illegal mining activity. On 20 May 2010, the Maharashtra State Home Minister R. R. Patil openly accused the mining industry of funding Left Wing Extremists (LWEs).11
Miners are reported to pay protection money to the Maoists as well as bribes to the police in order to conduct illegal mining businesses (of India, 2013). The simultaneous involvement of government officials and Maoists raises the possibility that Maoist activity is tolerated in order to shield illegal mines from unwanted attention. Such a Maoist-State nexus was explicitly put forward by Orissa’s BJP leader in 2010 (Govt, Maoist leaders paved the way for mining, 2010).12 Even if there was no explicit tolerance of Maoist activ-ities, it is clear that State Governments may not fully internalize the economic disruption caused by the threat of Maoist violence.13 There are numerous reports of the Centre ac-cusing States of being "lax" in their approach towards Maoism. For example, the outgoing chief of the Central Reserve Police Force, a centrally funded force that provides assistance to the State Police, has recently accused "some states" of "wanting Maoists to Continue" (Times of India, 28 Nov 2014). In this context, it is particularly interesting to test whether a large shock in the value of legal mining activity incentivises State Governments to start operations against insurgents who could facilitate illegal mining activity.
3
Data
This paper relies on violence data from the South Asia Terrorism Portal (SATP) between 2007 and 2011.14 The SATP draws from newspaper reports in the local and national En-glish speaking press to construct daily incident summaries. These summaries provide the district in which the incident took place, as well as the number of deaths on each side of the
11SATP 2010. See also Srivastava (2009) and India’s Naxalite insurgency: Not a dinner party (2010) for
similar claims.
12For example: "MLA seeks ’support’ of Maoists to run mine", Hundistan Times, 24 November 2013. 13
A large number of newspaper articles and policy briefs report of such disruption, e.g. Telegraph (2009) and Kujur (2009).
14See also Vanden Eynde (2015) for further discussion of this data source. The sample period starts in 2007,
because the most recent information on mining activity used in the analysis was published in 2006 and because the most recent royalty change (for coal only) was introduced in the first half of 2007.
conflict (civilians, Maoists and security forces). In these reports, all civilian casualties are inflicted by the Maoists. Security Forces regularly inflict casualties among the civilian pop-ulation (e.g., Human Rights Watch, 2012). However, for political reasons, the SATP data do not systematically report such incidents. As it is hard to formally identify “Maoists”, this category will undoubtedly include a certain number of civilian victims inflicted by the Security Forces. Based on this information, I construct variables for the number of casu-alties, for three categories (civilian, security forces and Maoists) at the district-year level. The conflict outcome data are collected at the district level for each quarter between 2007 and 2011.15 The analysis will be restricted to five states that are confronted with significant Naxalite activity as well as within-state variation in mining activity during the period under study: Andhra Pradesh, Chhattisgharh, Jharkhand, Orissa and West Bengal16. Given that the number of casualties in a given attack varies considerably, I will present the main results for a less noisy outcome measure: the number of fatal attacks inflicted by the security forces or Maoists.
I focus on three minerals which are linked to Maoist activity: iron, bauxite and coal. Data on the location and volume of mineral deposits is obtained from the Geological Survey of India (Geological Survey of India (2006) for Iron ore,Geological Survey of India (1994) for bauxite, Coal Reserves of India (2004) for coal. Estimates of the resource reserves are provided for sizable deposits.17 Data on mining leases from the Indian Bureau of mines is used to identify districts with "active" mining zones for iron ore and bauxite. Only leases granted before 2007 are taken into account, in order to mitigate concerns about the endo-geneity of mining activity to the observed violence. The lease data is also used to develop a rough measure characteristics of the mining industry. They allow a distinction between privately and publicly owned mines. I will also construct a rough measure of illegal mining activity at the district level, relying on a combination of satellite imagery and lease data. For those leases with visible mining activity on satellite images dated before 2010, I can measure the observed size of the mine.This sample includes 41 observed iron ore mines (out of 103 leases), of which 18 mines (in 8 districts) exceeded their legal limits before 2010. According to this measure, about one third of all iron ore districts had illegal operations. As
15
The data are drawn from three SATP records which partially overlap: “Fatalities and Incidents of Landmine Explosion by Maoists: 2007-2011”; State Incident Timelines (2007-2011); Major Incidents. The reliance on these different data sources further limits the risk of failing to identify incidents that involve casualties.
16Bihar has no mineral deposits of economic significance. Karnataka and Maharashtra both have important
mineral deposits, but the number of Naxalite affected districts is too small to explore within-state variation between mining and non-mining districts
17
The deposits measure in this paper is based on deposits exceeding 1M tonnes. The results are robust to different measures of the size of mining deposits.
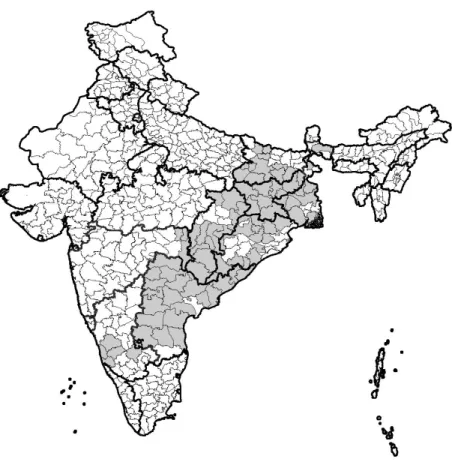
Figure 2: Distribution of Maoist Violence
Note: Districts affected by Maoist violence in gray (at least one death in 2005-2010, SATP). The thick black lines correspond to State borders, the thin black lines to district borders.
additional controls, I collect 2001 census data at the district level on population, the size of the tribal population, the size of the scheduled caste population and literacy. Furthermore, I collect forest cover and area data from the Ministry of Environment and Forest.18
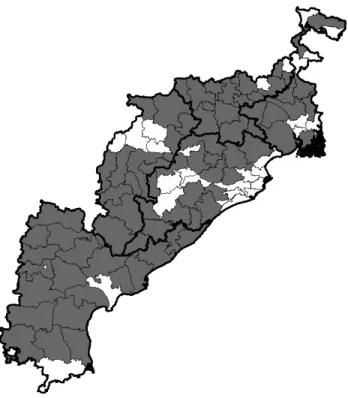
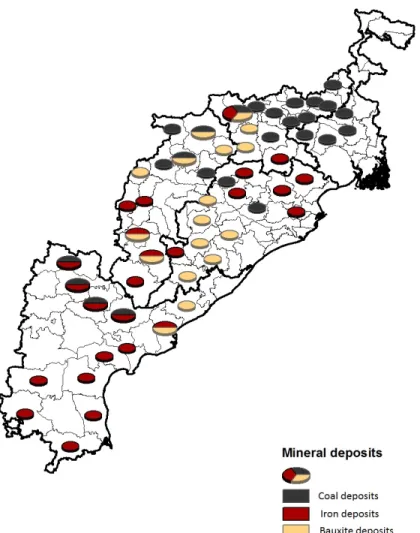
Figure 2 shows the Naxalite affected States and districts in India, figure 3 focuses on the States that are part of the sample in this paper, and figure 4 shows the distribution of mining deposits. Table 2 provides summary statistics for key variables.
18
Ministry of Environment and Forest, Govt. of India., "District-Wise Forest Cover", accessed through www.indiastat.com.
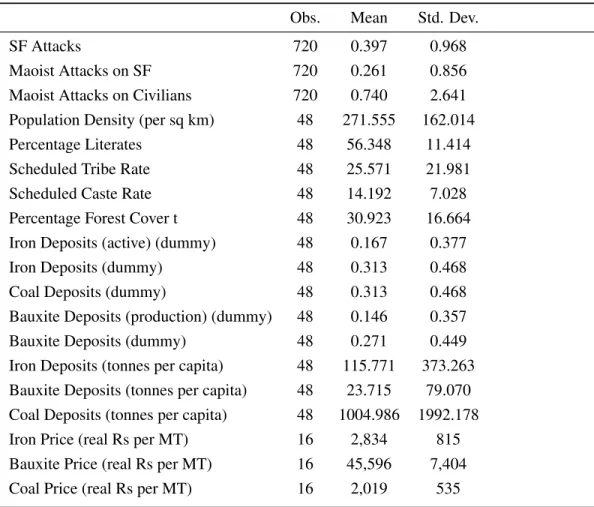
Table 2: Summary Statistics
Obs. Mean Std. Dev.
SF Attacks 720 0.397 0.968
Maoist Attacks on SF 720 0.261 0.856
Maoist Attacks on Civilians 720 0.740 2.641
Population Density (per sq km) 48 271.555 162.014
Percentage Literates 48 56.348 11.414
Scheduled Tribe Rate 48 25.571 21.981
Scheduled Caste Rate 48 14.192 7.028
Percentage Forest Cover t 48 30.923 16.664
Iron Deposits (active) (dummy) 48 0.167 0.377
Iron Deposits (dummy) 48 0.313 0.468
Coal Deposits (dummy) 48 0.313 0.468
Bauxite Deposits (production) (dummy) 48 0.146 0.357
Bauxite Deposits (dummy) 48 0.271 0.449
Iron Deposits (tonnes per capita) 48 115.771 373.263 Bauxite Deposits (tonnes per capita) 48 23.715 79.070 Coal Deposits (tonnes per capita) 48 1004.986 1992.178
Iron Price (real Rs per MT) 16 2,834 815
Bauxite Price (real Rs per MT) 16 45,596 7,404
Coal Price (real Rs per MT) 16 2,019 535
Time-invariant district level observations for the main sample of 48 districts affected by Maoist re-lated violence, time-varying and district-quarter level violence data is collected for a 4 year window around the policy change (2007q4 - 2011q3).
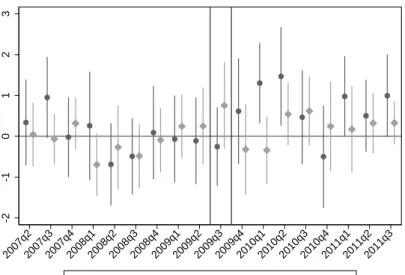
-2 -1 0 1 2 3 2007q22007q32007q42008q12008q22008q32008q42009q12009q22009q32009q42010q12010q22010q32010q42011q12011q22011q3
Figure 5: Fatal attacks on Maoists by Iron deposits (continuous)
4
Empirical strategy
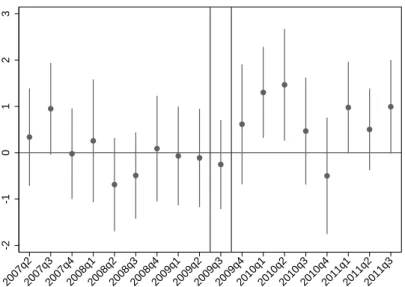
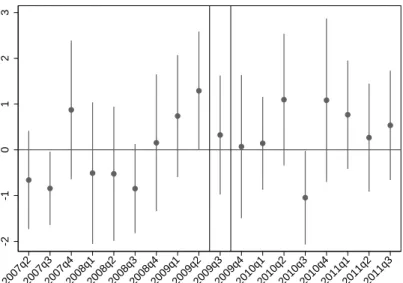
This paper studies the impact of the introduction of a 10% ad valorem tax on iron ore in the course of the third quarter of 2009. The paper uses a difference-in-difference approach, comparing districts with and without iron ore deposits, before and after the introduction of the new tax rate. Figure 5 provides a graphical depiction of the identification strategy. The figure plots the interactions of the (logarithmic) volume of iron ore deposits and dummies for each quarter, in a regression of the logarithm of the number of attacks on state-quarter dummies. The graph indicates that iron deposit districts experienced a sharp intensification of conflict after the third quarter of 2009. There is clearly no similar effect for districts with coal deposits(figure 7). Bauxite districts appear to experience a mild intensification of violence in early 2009, but before the third quarter and of a much smaller magnitude than the intensification seen for iron ore (figure 6).
In the main econometric specification, I account for the fact that the number of fatal at-tacks is a count variable by relying on a Fixed Effects Poisson Quasi-Maximum Likelihood model with cluster-robust standard errors at the district level.19
19
See Wooldrige (2002) for an introduction to this model. The results go through in OLS (with a log-transformed dependent variable, see table 10) as well as in a Negative Binomial specification.
-2 -1 0 1 2 3 2007q22007q32007q42008q12008q22008q32008q42009q12009q22009q32009q42010q12010q22010q32010q42011q12011q22011q3
Figure 6: Fatal attacks on Maoists by Bauxite deposits
-2 -1 0 1 2 2007q22007q32007q42008q12008q22008q32009q12009q22009q32009q42010q12010q22010q32010q42011q12011q22011q32008q4
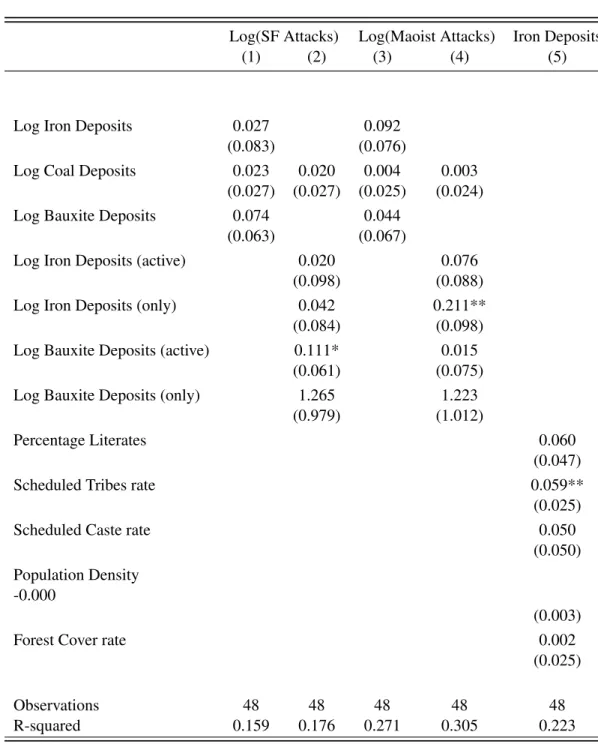
Table 3: Cross Section
Log(SF Attacks) Log(Maoist Attacks) Iron Deposits
(1) (2) (3) (4) (5)
Log Iron Deposits 0.027 0.092
(0.083) (0.076)
Log Coal Deposits 0.023 0.020 0.004 0.003
(0.027) (0.027) (0.025) (0.024)
Log Bauxite Deposits 0.074 0.044
(0.063) (0.067)
Log Iron Deposits (active) 0.020 0.076
(0.098) (0.088)
Log Iron Deposits (only) 0.042 0.211**
(0.084) (0.098)
Log Bauxite Deposits (active) 0.111* 0.015
(0.061) (0.075)
Log Bauxite Deposits (only) 1.265 1.223
(0.979) (1.012)
Percentage Literates 0.060
(0.047)
Scheduled Tribes rate 0.059**
(0.025)
Scheduled Caste rate 0.050
(0.050) Population Density
-0.000
(0.003)
Forest Cover rate 0.002
(0.025)
Observations 48 48 48 48 48
R-squared 0.159 0.176 0.271 0.305 0.223
Note: Logarithm of total attacks per capita between 2007q4 and 2009q3 (pre-treatment), for all districts experiencing at least one Police-Maoist clash. "Active" indicates deposits with existing mining leases, "only" refers to untapped deposits. Population variables are from the 2001 Census. State effects are included in all regressions. Robust standard errors in parentheses. * p<0.1; ** p<0.05; *** p<0.01.
-2 -1 0 1 2 3 2007q22007q32007q42008q12008q22008q32008q42009q12009q22009q32009q42010q12010q22010q32010q42011q12011q22011q3
Police attacks on Maoists Maoist attacks on Police
Figure 8: Fatal attacks on Maoists and Police
E(Attacki,s,t|X) = αiExp[βIroni,s∗ P ostt+ νs∗ P ostt] (1)
The dependent variable is the number of fatal attacks inflicted by the security forces or the Maoists, for a given district i, in state s, and in quarter t. The indicator variable P ostt switches on when the 10% royalty is in vigor, i.e. from the fourth quarter of 2009 onwards.20 The coefficient β represents the elasticity of the number of attacks in district i and year t with respect to the treatment, which naturally makes districts with higher levels of violence more responsive to the tax change. The fixed effects explain all the variation in districts that do not see any casualties, and these districts do not contribute towards the estimation of β. The main results will use a four-year period around the full introduction of the policy in the fourth quarter of 2009, i.e. from the fourth quarter of 2007 until the third quarter of 2011. I present results for different time windows in the appendix (table 11).
The state-specific post-treatment effects νs∗ P ostt can account for state-level policy variables that affect the number of attacks. As both economic policy and counterinsurgency strategies are set at the state level and these policies vary widely between states (as dis-cussed in section 3), νs∗ P osttcontrols flexibly for a wide range of potentially relevant but
20
In the main results, the quarter during which the new policy is introduced (the third quarter of 2009) is omitted, but the results are robust to keeping the introduction period and letting "Post" take value 1 in the third quarter versus the fourth quarter of 2009, or to including a continuous time treatment.
unobserved determinants of violence. Importantly, the state-post-treatment effects absorb the impact of the royalty regime on the state budget, given that royalty collections are not tied to expenditures in the districts where they originate. This approach is essential to iden-tify the impact of changed incentives for intervention (as opposed to a budgetary windfall) at the district level.
As the main results are based on a difference-in-difference approach, the crucial identi-fication assumption is that iron districts would have followed the same trend in the absence of the royalty change. To support this assumption, the paper will perform a number of placebo tests. Given that iron ore was the only mineral that saw a dramatic increase in roy-alty revenues, I can estimate the effect of bauxite and coal deposits in an analogous fashion to the effects for iron ore districts in equation 1. If β captures the causal effect of the regime change for iron ore, there should be no comparable impact for these minerals.21 Table 3 shows the relationship between mineral measures at the district level and violence before 2009q3. Most of these mineral deposit measures are not correlated with violence outcomes, although the signs are always positive, which adds support for using other types of minerals as placebos. A second type of placebo test exploits the timing of the royalty change, by shifting the treatment variable forward by 1 year. I will also test whether the results are ro-bust to including interactions of P osttwith baseline characteristics that correlate with the presence of mines (in particular the share of the tribal population, on which the coefficient is significant in table 3). Finally, while all types of violence respond to common factors, the first order effect of the new royalty regime should be on state operations, and the state attacks on Maoists are expected to respond more strongly to the changing royalty regime than Maoist attacks. I will test this hypothesis by comparing results for different violence outcomes.
In those specifications that include a time-varying price control variable, international mineral prices are used to mitigate endogeneity concerns. India’s iron ore production is only 8.8% of the total world production (US Geological Survey, 2010), which puts India in the ”price taker” category following the rule of Bazzi and Blattman (2014). Moreover, the states affected by the conflict account for an even smaller percentage of the world production.
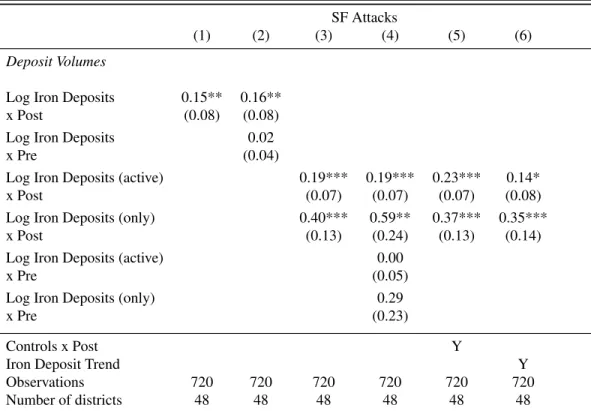
Table 4: Main Results
SF Attacks
(1) (2) (3) (4) (5) (6)
Deposit Volumes
Log Iron Deposits 0.15** 0.16**
x Post (0.08) (0.08)
Log Iron Deposits 0.02
x Pre (0.04)
Log Iron Deposits (active) 0.19*** 0.19*** 0.23*** 0.14*
x Post (0.07) (0.07) (0.07) (0.08)
Log Iron Deposits (only) 0.40*** 0.59** 0.37*** 0.35***
x Post (0.13) (0.24) (0.13) (0.14)
Log Iron Deposits (active) 0.00
x Pre (0.05)
Log Iron Deposits (only) 0.29
x Pre (0.23)
Controls x Post Y
Iron Deposit Trend Y
Observations 720 720 720 720 720 720
Number of districts 48 48 48 48 48 48
Note: Quarterly data at the district level. Fixed effect Poisson results. District fixed effects and state-post effects are included in all regressions. "Post" captures the introduction of the Royalty hike, in 2009q3. "Pre" shifts the treatment 1 year forward. "prod" refers to production districts, "only" to districts without recorded active mining. Controls interactions include the literacy, ST, and SC shares. Standard errors are clustered at the district level. * p<0.1; ** p<0.05; *** p<0.01.
Table 5: Comparison to other minerals
SF Attacks
(1) (2) (3) (4) (5) (6)
Log Iron Deposits x Post 0.17* 0.15* 0.18**
(0.09) (0.08) (0.09)
Log Coal Deposits x Post -0.04 -0.03 (0.05) (0.05) Log Bauxite Deposits x Post 0.08
(0.08)
Log Iron Deposits (active) 0.22** 0.19*** 0.25***
x Post (0.10) (0.07) (0.07)
Log Iron Deposits (only) 0.43*** 0.40*** 0.51***
x Post (0.15) (0.13) (0.12)
Log Bauxite Deposits (active) 0.05
x Post (0.08)
Log Bauxite Deposits (only) 0.18
x Post (0.17)
Mineral dummy x Post Y Y Y
Iron Deposit Trend Y
Observations 720 720 720 720 720 720
Number of districts 48 48 48 48 48 48
Note: Quarterly data at the district level. Fixed effect Poisson results. District fixed effects and state-post effects are included in all regressions. "Post" captures the introduction of the Royalty hike, in 2009q3. Standard errors are clustered at the district level. * p<0.1; ** p<0.05; *** p<0.01.
5
Results
Table 4 presents the main findings. Districts with iron ore deposits have a significantly higher number of fatal attacks by security forces after the introduction of the 10% royalty. The effect is higher for districts that also produce iron ore (rather than just containing de-posits), although this difference is not significant. A placebo timing dummy (column 2) indicates that there is no significant difference between iron ore and other districts in the year before the introduction of the royalty. The main results are also robust to including a post-treatment effect for covariates (column 5) that are correlated with the presence of iron ore deposits (column 5 of table 3). The magnitude of the effect is substantial. Districts with the mean level of iron ore deposits (conditional on positive deposits) experience a 65
Table 5 repeats the main results for a continuous deposit measure, but includes the placebo effects for coal and bauxite deposits (in column 1) and separately for deposit and production zones (in column 2). These placebo coefficients do not gain significance.22 To test directly for the distinctive pattern of iron ore relative to other minerals, columns (3)-(5) include an interaction of a mineral dummy (for deposits of any of the three minerals) with the post indicator. This specification uses variation within mineral-rich districts to identify the effect of the royalty hike, and it controls for any patterns in the post-treatment period that are common between the three resources. The significant coefficient on iron ore deposits confirms that iron districts behaved significantly differently from other mineral districts after the royalty hike.
Table 6 includes price controls for iron ore districts in the regressions (columns 1 and 2). The main results remain unaltered in these specifications, in spite of the strong price changes that iron ore experienced during the sample period (shown in figure 9). Given that the three minerals experienced very similar price changes, earlier specifications that included a mineral-post dummy should already have picked up the effect of prices on vio-lence that is common to all minerals. Column 3 allows for the effect of the price level to be different after the introduction of the ad valorem tax. In principle, the ad valorem tax could make the value of controlling iron-rich districts contingent on current price levels, in particular in production districts. The positive sign on the triple interaction of deposits, prices, and the Post indicator are consistent with this hypothesis, although the small number of iron districts and relatively short panel implies that this test has limited power.
21
Alternatively, mineral-quarter effects can be added to the main specifications, which implies that β is identified from the differences between iron-rich versus other mineral-rich districts.
22The positive but insignificant effect for bauxite is consistent with the introduction of a relatively mild
Table 6: Main Results with Price Controls
SF Attacks
(1) (2) (3) (4) (5) (6)
Log Iron Deposits x Post 0.16** 0.15** (0.07) (0.07) Log Iron Deposits x Price -0.02 -0.01
(0.07) (0.07)
Log Iron Deposits (active) 0.19*** 0.19*** 0.17* 0.17**
x Post (0.07) (0.07) (0.09) (0.09)
Log Iron Deposits (only) 0.44*** 0.44*** 0.37 0.37
x Post (0.14) (0.13) (0.24) (0.24)
Log Iron Deposits (active) 0.00 0.00 -0.01 -0.01
x Price (0.08) (0.08) (0.06) (0.06)
Log Iron Deposits (only) -0.24* -0.29 -0.29
(0.14) (0.23) (0.23)
Log Iron Deposits (active) 0.04 0.04
x Price x Post (0.16) (0.16)
Mineral dummy x Post Y Y Y
Observations 720 720 720 720 720 720
Number of districts 48 48 48 48 48 48
Notes: Quarterly data at the district level. Fixed effect Poisson results. District fixed effects and state-post effects are included in all regressions. "Post" captures the introduction of the Royalty hike, in 2009q3. Standard errors are clustered at the district level. * p<0.1; ** p<0.05; *** p<0.01.
Table 7: Types of violence
SF Attacks Maoist Attacks Maoist Attacks
on Maoists on SF on Civilians
(1) (2) (3) (4) (5) (6)
Log Iron Deposits (active) 0.18*** 0.19** 0.14** -0.03 -0.00 -0.07
x Post (0.07) (0.09) (0.06) (0.09) (0.03) (0.06)
Log Iron Deposits (only) 0.40*** 0.41*** -0.05 -0.34 0.01 -0.11
x Post (0.13) (0.15) (0.14) (0.22) (0.08) (0.11)
Log Iron Deposits (active) 0.18*** 0.19** 0.14** -0.03 -0.00 -0.07
x Post (0.07) (0.09) (0.06) (0.09) (0.03) (0.06)
Log Iron Deposits (only) 0.40*** 0.41*** -0.05 -0.34 0.01 -0.11
x Post (0.13) (0.15) (0.14) (0.22) (0.08) (0.11)
Log(Maoist Attacks on SF) t-1 0.04 0.04 (0.12) (0.11)
Log(SF Attacks on Maoists) t-1 0.08 0.17 0.24** 0.25**
(0.20) (0.16) (0.10) (0.10)
Iron Deposit Trend Y Y Y
Mineral x Post Y Y Y
Observations 720 720 525 525 780 780
Number of districts 48 48 35 35 52 52
Note: Quarterly data at the district level. Fixed effect Poisson results. District fixed effects and state-post effects are included in all regressions. "Post" captures the introduction of the Royalty hike, in 2009q3. Standard errors are clustered at the district level. * p<0.1; ** p<0.05; *** p<0.01.
Figure 9: Mineral Prices -.2 0 .2 .4 .6 .8 2007q3 2008q3 2009q3 2010q3 2011q3 Quarter
Log World Iron Price Log World Bauxite Price Log World Coal Price
Note: Standardized logarithmic world prices for Iron ore, Aluminium, and Coal.
Table 8: Net activity
Log(SF Attacks on Maoists) -Log(Maoist Attacks on SF)
(1) (2) (3) (4)
Log Iron Deposits (active) 0.015* 0.056*** 0.018* 0.054*
x Post (0.009) (0.018) (0.009) (0.029)
Log Iron Deposits (only) 0.083** 0.156*** 0.139** 0.190**
x Post (0.034) (0.042) (0.060) (0.073)
Iron Deposit Trend Y Y
Mineral x Post Y Y
Initiator sample SF Maoist SF Maoist
Observations 720 720 480 480
Number of districts 48 48 32 32
Note: Quarterly data at the district level, for all districts experiencing at least one Maoist fatality (odd columns) or one Police fatality (even columns). District fixed effects and state-post effects are included in all regressions. District fixed effects and state-post effects are included in all regressions. "Post" captures the introduction of the Royalty hike, in 2009q3. Standard errors are clustered at the district level. * p<0.1; ** p<0.05; *** p<0.01.
Table 7 repeats the key results for fatal Maoist attacks on security forces and on civil-ians. Iron districts see an intensification of Maoist violence directed against the police after the introduction of the 10% royalty regime, which could reflect the strategic responses of the Maoists. Of course, it is impossible to accurately identify the party who initiates vi-olence. Table 7 presents the main results for different violence outcomes, controlling for levels of violence by the adversary in the previous quarter. There is evidence of an intensi-fication of Maoist attacks on security forces, but this result is not robust to the inclusion of a trend for iron ore districts. Also, Maoist violence against civilians does not respond sig-nificantly to the changing tax regime. The coefficients on the lagged variables are positive, suggesting some responsiveness, but they do not alter the main results qualitatively. Table 8 tests whether the new royalty regime induced the state to be more active relative to the level of Maoist violence. It uses the difference in violence as its outcome. In this specification, "net" Police attacks increase significantly, which is consistent with the idea that the first order effect of the changing royalty regime operates through the incentives of the state.
Finally, table 9 investigates whether the type of mining activity affects the strength of the response to the royalty shock. The first two columns include an interaction of the difference-in-difference term with the share of iron mine leases that are held by private firms (measured at the district level).23 Private mining activity seems to strengthen the response. Similarly, the main effect is stronger in districts with illegal mining activity. I measure illegal mining activity by comparing the maximum cleared area of mines in their official leases with the size of mines from satellite imagery. The interaction of the treatment with an indicator of whether any mines operate beyond their legal limits in the district is highly significant. Unfortunately, due to the small number of districts with active mining zones, there is not enough variation to identify the effect of private and illegal activity separately.24 However, the stronger intensification of violence in districts with private and illegal mining activity is consistent with the suggested channel of changing incentives for states. In particular, the new royalty regime could disrupt the alleged collusion between officials, Maoists, and mining firms.25.
23Apart from private mines and mines operated by companies controlled by central government, a very small
number of mining leases (less than 5%) are owned by State-owned companies.
24Out of 8 districts with active iron ore production, six districts have at least some private firms operating,
and five out of these six districts experience excess mining activity according to my measure.
25
While not significant in most columns, table 12 shows that excess iron ore mining is associated with less violence before the royalty-hike period.
Table 9: Heterogeneity
SF Attacks on Maoists
(1) (2) (3) (4)
Log Iron Deposits (active) x Post 0.112* 0.173** 0.072 0.090 (0.064) (0.074) (0.069) (0.094) Log Iron Deposits (only) x Post 0.318** 0.442*** 0.278** 0.313* (0.127) (0.139) (0.132) (0.179) Log Iron Deposits (active) x Private 0.260 0.289**
x Post (0.131) (0.119)
Log Iron Deposits (active) x Excess 0.302*** 0.307***
x Post (0.106) (0.100)
Observations 720 720 720 720
Number of dist 48 48 48 48
Mineral dummy x Post Y Y
Iron Deposit Trend Y Y
Observations 720 720 720 720
Number of districts 48 48 48 48
Note: Quarterly data at the district level. Fixed effect Poisson results. District fixed effects and state-post effects are included in all regressions. "Post" captures the introduction of the Royalty hike, in 2009q3. Standard errors are clustered at the district level. "Private" is the share of leases held by private companies. "Excess" is an indicator for mines that are larger than their legal limits in the period 2006-2009. * p<0.1; ** p<0.05; *** p<0.01.
6
Interpretation
The results of this paper are consistent with a simple theory in which the optimal level of counter-insurgency efforts increases when higher tax rates boost the marginal return to these efforts. The introduction of a 10% ad valorem royalty has an immediate effect on the value of controlling iron-rich districts for state governments. The stronger effects in areas with illegal or private mining activity are consistent with the idea that the state officials could have tolerated Maoist activity because they benefited from illegal mining. In this interpretation, clearing iron ore districts from Maoist activity could boost the output of legally produced iron ore, both by increasing the cost of illegal mining activity and by reducing the disruption to legal mining business. The appendix introduces a simple framework that describes these channels. The broader context is one of increased curbs on illegal mining activity. During the late 2000s, a number of high profile mining scams came to light. It is unlikely that these discoveries constitute a confounding factor for my analysis, because coal and bauxite have also been affected by these scams. However, it is reasonable to assume that the willingness of state governments to speak out against illegal mining responds to altered incentives under the new royalty regimes. In this sense, a crack-down on illegal mining could be one of the mechanisms through which the new royalty regime has affected counter-insurgency activity (as described in the framework developed in the appendix). Unfortunately, my paper cannot measure the importance of this channel directly. The political salience of illegal mining could be important for the external validity though: the impact of the royalty change could have been strengthened by an environment in which illegal mining carried heavier political costs. However, it is not clear that the tax hike curbed the alleged collusive behaviour. In principle, the observed violence could still be part of a renegotiation process between Maoists, firms, and state actors, in response to a large shock to the outside options of one of these players.
A second important factor for the external validity of my study are the direct effects of mining royalties on the budget of the state. In principle, royalty revenues could relax a budget constraint for the police force. Indeed, figure 10 suggests that a number of Naxalite-affected states simultaneously saw a boost in royalty revenues and a sharp increase in the number of Police officers. However, this factor in itself cannot explain why iron-rich dis-tricts see more violence within the states that benefit from the royalty increases, as the collection of royalty revenue is centralized at the state level. Moreover, the centre covers a large proportion of the costs that are associated with counter-insurgency, through the provi-sion of Central Reserve Police Forces and the LWE funds. Finally, the impact of the royalty
Andhra Pradesh Bihar Chhattisgarh Jharkhand Karnataka Maharashtra Orissa West Bengal Goa Madhya Pradesh Rajasthan -.2 0 .2 .4 .6
Change in Police officers (2008-10)
0 10 20 30 40
Change in Iron Ore Royalties (2008-10)
Change in Police officers (2008-10) Change in Police officers (2008-10)
Figure 10: Royalty revenues and police size
change on state violence appears too fast (as seen in figure 5) to be explained by increased investment in counter-insurgency capacity. However, even if the revenue windfalls did not cause a re-allocation of police efforts, a growing state budget may have facilitated such a change. In other words, a budget-neutral change in the fiscal regime could have had a dif-ferent impact than the one proposed in this paper. This needs to be taken into account to assess the extent to which the findings of this paper can be translated to other contexts.
7
Conclusion
This paper is one of the first to explore the public finance of law and order provision in a (low intensity) civil conflict. In the federal political structure of India, I study the introduc-tion of a royalty regime for iron ore that dramatically increased the fiscal value of iron-rich districts for state governments. As the states are responsible for the provision of law and order in their territory, they play an essential role in the management of the Naxalite con-flict. The empirical analysis confirms that the introduction of this tax led to a temporary intensification of police violence directed against Maoists. These results are consistent with the optimal allocation of security operations according to the value of controlling territory. This paper contributes to an emerging research agenda that recognises the institutionalized nature of conflicts, and analyses the role of the specific policies that characterise these in-stitutions in shaping the behaviour of parties engaged in conflict.
References
Azam, Jean-Paul and Kartika Bhatia. 2013. “Provoking Insurgency in a Federal State: Theory and Application to India.” mimeo.
Bazzi, Samuel and Christopher Blattman. 2014. “Economic Shocks and Conflict: Evidence from Commodity Prices.” American Economic Journal: Macroeconomics 6(4):1–38. Bazzi, Samuel and Matthew Gudgeon. 2015. “Local Government Proliferation, Diversity,
and Conflict.” Mimeo .
Berman, Eli, Joseph Felter, Ethan Kapstein and Erin Troland. 2015. “Predation, Taxation, Investment, and Violence: Evidence from the Philippines.” NBER Working Paper 18375. Berman, Nicolas, Mathieu Couttenier, Dominic Rohner and Mathias Thoenig. 2015. “This
Mine is Mine! How minerals fuel conflict in Sub-Saharan Africa.” Mimeo.
Besley, Timothy J and Torsten Persson. 2010. “State Capacity, Conflict and Development.” Econometrica78(1):1769–1778.
Borooah, Vani K. 2008. “Deprivation, Violence, and Conflict: An Analysis of Naxalite Ac-tivity in the Districts of India.” International Journal of Conflict and Violence 2(2):317– 333.
Brückner, Markus and Antonio Ciccone. 2009. “International Commodity Prices, Growth and the Outbreak of Civil War in SubSaharan Africa.” The Economic Journal (August):1– 21. mimeo.
Charles Tilly. 1990. Coercion, Capital, and European States. Vol. 1990. Coal Reserves of India. 2004.
Collier, Paul and Anke Hoeffler. 2004. “Greed and grievance in civil war.” Oxford Economic Papers56(4):563–595.
Dal Bó, Ernesto and Pedro Dal Bó. 2011. “Workers, Warriors, and Criminals: Social Conflict in General Equilibrium.” Journal of the European Economic Association 9:646– 677.
Dell, Melissa. 2016. “Trafficking Networks and the Mexican Drug War.” American Eco-nomic Review, forthcoming.
Dube, Oeindrila and Juan F Vargas. 2013. “Commodity Price Shocks and Civil Conflict: Evidence from Colombia.” The Review of Economic Studies .
Fetzer, Thiemo René. 2014. “Can Workfare Programs Moderate Violence? Evidence from India.” mimeo.
Fetzer, Thiemo and Samuel Marden. 2015. “Take what you can: property rights, contesta-bility and conflict.” Mimeo .
Gawende, Kishore, Devesh Kapur and Shanker Satyanath. 2012. “Natural Resource Shocks and Conflict in India’s Red Belt.” mimeo.
Geological Survey of India. 1994. Detailed Information Report on Bauxite. Technical re-port.
Geological Survey of India. 2006. Detailed Information Dossier on Iron Ore. Technical report.
Govt, Maoist leaders paved the way for mining. 2010.
India’s Naxalite insurgency: Not a dinner party. 2010. The Economist .
Khan, Adban, Asim I. Khwaja and Benjamin A. Olken. 2014. “Tax Farming Redux: Ex-perimental Ecidence on Performance Pay for Tax Collectors.” mimeo.
Khanna, Gaurav and Laura Zimmermann. 2014. “Guns and butter: Fighting Maoist Vio-lence with the Promise of Development.” mimeo.
Kujur, Rajat Kumar. 2009. Naxal Conflict in 2008: An Assessment. Technical Report February.
Lei, Yu-Hsiang and Guy Michaels. 2013. “Do Giant Oilfield Discoveries Fuel Internal Armed Conflicts?” mimeo.
Ministry of Mines. 2012. Indian Minerals Yearbook 2011 (Part I). Vol. 2011.
Nilakanton, Rahul and Saurabh Singhal. 2010. “The Economic Costs of Naxalite Violence and the Economic Benefits of a Unique Robust Security Response.” mimeo.
of India, Times. 2013. “Maoists shield illegal coal mining in state for levy, cops’ role can’t be denied.”.
Padro i Miquel, Gerard and Pierre Yared. 2012. “The Political Economy of Indirect Con-trol.” The Quarterly Journal of Economics 127:947–1015.
Pasquale, Benjamin. 2014. “How Ethnic Quotas Shape Violence:Field Evidence from In-dia.” mimeo.
Planning Commission. 2008. Development Challenges in Extremist Affected Areas. Tech-nical report.
Ross, Michael L. 2004. “What Do We Know About Natural Resources and Civil War?” Journal of Peace Research41(3):337–356.
Sanchez de la Sierra, Raul. 2015. “Bandits or states? the fiscal determinants of preliminary state formation: Evidence from armed groups in eastern congo.”.
Shapiro, Jake, Abbey Steele and Juan Vargas. 2014. “Endogenous Taxation in Ongoing Internal Conflict: The Case of Colombia.” mimeo.
Srivastava, Devyani. 2009. Terrorism & Armed Violence in India. Technical Report May. Telegraph. 2009. “Maoist fear disrupts bauxite supply.”.
US Geological Survey. 2010. Iron Ore Statistics. In Historical Statistics for Minderal and Material Commodities in the United States.
Vanden Eynde, Oliver. 2015. “Targets of Violence: Evidence from India’s Naxalite Con-flict.” mimeo.
Appendix
7.1 Conceptual Framework
In this section, I develop a very simple framework to describe the optimisation problem of the state. The state government makes two decisions: (1) the intensity of security operations against Maoists, and (2) whether to allow illegal mining activity.26
States invest s in security operations against Maoist rebels. The state government allows a share 1 − L of the state’s production capacity (normalized to 1) to be mined illegally, with L∈{L, 1}. I assume that Maoist activity disrupts legal mining, so that only a fraction δ(s) of the maximum legal output L can actually be produced. δ(s) depends on the intensity of security operations, with δ0(s) > 0 and δ0(s) < 0. The cost of providing security is a linear function of s. The royalties are collected on the realized legal output δ(s)L, according to rate r. The state-level decision maker can appropriate a fraction α of these royalty revenues. Illegal mining generates bribes, the amount of which is determined by Nash bargaining between a mining firm and the state. Only a fraction θ of the potential illegal output can be mined. By assumption, θ does not depend on security measures, to capture the idea that illegal mining is less sensitive to disruption by rebels (and could even benefit from rebel activity - as suggested above).
The joint surplus of illegal mining activity for the state and mining firm is given by:
[θ − αrδ(s) − (1 − r)δ(s)](1 − L) (2)
The state and mining firm engage in Nash Bargaining (after s has been chosen), and the state’s bargaining power is set at γ. This yields the following pay-off for the state:
αrδ(s) + γ[θ − αrδ(s) − (1 − r)δ(s)](1 − L) − s (3)
The state chooses L and s in order to maximise this expression. There are two channels through which higher royalty rates affect security operations. First, there is a direct effect on the returns to security efforts. Increasing r unambiguously increases the returns to security operations, so s∗0(r) > 0. Second, there is an indirect effect through shifts from illegal to legal mining. As the choice for illegal mining is discrete in our framework, small changes in r do not have an effect on the occurrence of illegal mining. However, the effect of
26
Given that states can receive bribes from mining firms in return for facilitating illegal mining, problem (2) is similar to the tax inspection problem studied by Khan, Khwaja and Olken (2014). This section develops a variation on these authors’ conceptual framework.
large changes in r on L∗ is ambiguous. The bargaining surplus is rising in r for fixed s, but larger investments in security forces increase the returns to legal mining through δ(s). Hence, increases in r indirectly reduce the bargaining surplus through s. Under certain parameter conditions (e.g., when γ is low), the optimal investment in security operations can eliminate the bargaining surplus for illegal mining. At this point, the investments in security operations will increase discontinuously.
7.2 Additional results
Table 10: Main Results in OLS
Log(SF Attacks)
(1) (2) (3) (4) (5) (6)
Deposit Volumes
Log Iron Deposits 0.04*** 0.04***
x Post (0.01) (0.01)
Log Iron Deposits 0.01
x Pre (0.01)
Log Iron Deposits (active) 0.04*** 0.04*** 0.04*** 0.05***
x Post (0.01) (0.01) (0.01) (0.02)
Log Iron Deposits (only) 0.04*** 0.07** 0.04** 0.07***
x Post (0.02) (0.03) (0.02) (0.03)
Log Iron Deposits (active) 0.00
x Pre (0.01)
Log Iron Deposits (only) 0.05
xPre (0.04)
Controls x Post Yes
Iron Deposit Trend Yes
Observations 720 720 720 720 720 720
Number of districts 48 48 48 48 48 48
Note: Quarterly data at the district level. Fixed effect Poisson results. District fixed effects and state-post effects are included in all regressions. "Post" captures the introduction of the Royalty hike, in 2009q3. "Pre" shifts the treatment 1 year forward. "Active" refers to production districts, "only" to districts without recorded active mining. Controls interactions include the literacy, ST, and SC shares. Standard errors are clustered at the district level. * p<0.1; ** p<0.05; *** p<0.01.
Table 11: Sensitivity to time windows
Log(SF Attacks on Maoists)
(1) (2) (3) (4) (5) (6)
Log Iron Deposits 0.046*** 0.035*** 0.038*** 0.031*** 0.038*** 0.026** (active ) x Post (0.014) (0.013) (0.011) (0.011) (0.010) (0.011) Log Iron Deposits 0.263*** 0.112*** 0.182*** 0.274*** 0.167*** 0.136*** (only) x Post (0.048) (0.040) (0.047) (0.055) (0.041) (0.038)
Observations 336 432 528 624 720 816
Start 2008q4 2008q3 2008q2 2008q1 2007q4 2007q3
End 2010q3 2010q4 2011q1 2011q2 2011q3 2011q4
Number of dist 48 48 48 48 48 48
Note: Quarterly data at the district level for varying time windows around the treatment (. District fixed effects and state-post effects are included in all regressions. "Post" captures the introduction of the Royalty hike, in 2009q3. Standard errors are clustered at the district level. * p<0.1; ** p<0.05; *** p<0.01.
Table 12: Cross Section with Excess Iron Ore mining
Log(SF Attacks) Log(Maoist Attacks) Iron Deposits
(1) (2) (3) (4) (5)
Excess Iron Mining -0.459 -0.565 -0.860* -0.770 3.894***
(0.576) (0.834) (0.465) (0.698) (1.166)
Log Iron Deposits (only) 0.034 0.201*
(0.092) (0.114)
Log Iron Deposits (active) 0.078 0.156
(0.154) (0.134)
Log Coal Deposits 0.023 0.021 0.003 0.003
(0.029) (0.029) (0.025) (0.025)
Log Bauxite Deposits (only) -0.001 0.061
(0.098) (0.089)
Log Bauxite Output 0.113* 0.018
(0.061) (0.074)
Log Iron Deposits 0.068 0.168*
(0.107) (0.092)
Log Bauxite Deposits 0.069 0.035
(0.063) (0.065)
Percentage Literates 0.039
(0.031)
Scheduled Tribes rate 0.049***
(0.018)
Scheduled Caste rate 0.071
(0.049)
Population Density 0.001
(0.003)
Forest Cover rate 0.002
(0.022)
Observations 48 48 48 48 48
Note: Logarithm of total attacks per capita between 2007q4 and 2009q3 (pre-treatment), for all dis-tricts experiencing at least one Police-Maoist clash. Population variables are from the 2001 Census. State effects are included in all regressions. Robust standard errors in parentheses. * p<0.1; ** p<0.05; *** p<0.01.