HAL Id: inserm-01148001
https://www.hal.inserm.fr/inserm-01148001
Submitted on 4 May 2015
HAL is a multi-disciplinary open access archive for the deposit and dissemination of sci-entific research documents, whether they are pub-lished or not. The documents may come from teaching and research institutions in France or abroad, or from public or private research centers.
L’archive ouverte pluridisciplinaire HAL, est destinée au dépôt et à la diffusion de documents scientifiques de niveau recherche, publiés ou non, émanant des établissements d’enseignement et de recherche français ou étrangers, des laboratoires publics ou privés.
Change in fast walking speed preceding death: results
from a prospective longitudinal cohort study.
Séverine Sabia, Julien Dumurgier, Béatrice Tavernier, Jenny Head, Christophe
Tzourio, Alexis Elbaz
To cite this version:
Séverine Sabia, Julien Dumurgier, Béatrice Tavernier, Jenny Head, Christophe Tzourio, et al.. Change in fast walking speed preceding death: results from a prospective longitudinal cohort study.. Journals of Gerontology, Series A, Oxford University Press (OUP): Policy B - Oxford Open Option D, 2014, 69 (3), pp.354-62. �10.1093/gerona/glt114�. �inserm-01148001�
354
Change in Fast Walking Speed Preceding Death: Results
From a Prospective Longitudinal Cohort Study
Séverine Sabia,
1Julien Dumurgier,
2–4Béatrice Tavernier,
5Jenny Head,
1Christophe Tzourio,
6and Alexis Elbaz
2,31Department of Epidemiology and Public Health, University College London.
2Institut National de la Santé et de la Recherche Médicale U1018, Centre for Research in Epidemiology
and Population Health, UMRS 1018, F-94807, Villejuif, France.
3University Paris-11, Villejuif, France.
4Memory Clinical Center Paris Nord-IDF, Fernand Widal Hospital, Paris, France. 5Department of Geriatrics, CHU Dijon, Dijon, France.
6Institut National de la Santé et de la Recherche Médicale U708, University of Bordeaux-Segalen, France.
Address correspondence to Séverine Sabia, PhD, Department of Epidemiology and Public Health, University College London, 1–19 Torrington Place, London WC1E 6BT, UK. Email: s.sabia@ucl.ac.uk
Background. Walking speed (WS) predicts mortality. However, it is unclear if decline in WS increases prior to death.
We examined whether (a) WS declined faster in persons who died during the follow-up compared with those who remained alive and (b) adding change in WS to a model including age, sex, and baseline WS improved prediction of mortality.
Methods. Data are from 4,016 participants of the Dijon center of the Three-City study (France), aged 65–85 years.
Fast WS (FWS) was measured up to five times over a 12-year period. Mortality was ascertained until 2012.
Results. Linear mixed models using a backward time scale showed that FWS declined faster in 908 participants who
died during the follow-up (annual change = −0.031 m/s) than in those who survived (−0.021 m/s), corresponding to a dif-ference of −0.009 (95% confidence interval = −0.013 to −0.005) m/s. Compared with “normal” change in FWS (annual change ≥−0.04 m/s), “substantial” decline (<−0.08 m/s) was associated with a 1.4-fold greater risk of mortality (hazards ratio = 1.40, confidence interval = 1.02–1.92) and small decline (−0.08 to −0.04 m/s) with a 1.2-fold greater risk (hazards ratio = 1.18, confidence interval = 0.89–1.57). The net reclassification index when adding these categories of change in FWS to the model adjusted for age, sex, and baseline FWS was 19.0% (0.6, 36.8%).
Conclusion. Participants who died during the follow-up had a steeper decline in FWS than the others. Both baseline
FWS and FWS decline predict mortality.
Key Words: Physical function—Gait—Longevity.
Received September 11, 2012; Accepted May 29, 2013 Decision Editor: Stephen Kritchevsky, PhD
W
ALKING speed (WS) is a robust predictor of mortal-ity (1,2). A pooled analysis concluded that age, sex, and WS predicted mortality, as well as a more complete set of variables (age, sex, diseases, body mass index, systolic blood pressure, and hospitalization) (2). Most studies, with a few notable exceptions where change in WS over 1 or 2 years was analyzed (3–5), have examined whether a sin-gle WS measure predicts subsequent mortality. It remains unclear whether decline in WS is associated with risk of mortality.Investigation into the cognitive trajectories of older adults provides evidence of a rapid decline in cognitive function preceding death (6,7). Underlying conditions (dementia and stroke) may play a role in some persons, but the accumulation of brain pathology or other biologic changes may also be involved (7,8). The extent to which
terminal decline exists for physical functioning remains little explored (8,9). Using up to five measures of fast WS (FWS) over 12 years in individuals aged 65–85 years, we examined whether (a) FWS declined more rapidly in persons who died during follow-up compared with those who remained alive and (b) adding FWS decline to a model including age, sex, and baseline FWS improved prediction of mortality.
Methods Study Population
The 3C study is a prospective cohort study conducted in three French cities (Bordeaux, Dijon, and Montpellier) (10). Electoral rolls were used to invite community dwell-ers aged 65 years or more (recruitment rate = 37%). This
ChANGE IN WALKING SPEED BEfoRE DEAth 355
study is based on data collected in Dijon (n = 4931), where a specific study on physical functioning was conducted.
After baseline (wave 0, 1999–2001), participants were seen approximately every 2 years; 6 waves of data collection have taken place until 2012 in addition to the baseline assess-ment. At each wave (except wave 3 that consisted in a ques-tionnaire), participants up to 85 years of age were invited to the study center for a clinical examination, whereas older participants were seen at home; however, to maximize par-ticipation, all participants were offered the opportunity of being seen at home. The study protocol was approved by the Ethical Committee of the University Hospital of Kremlin-Bicêtre; all participants gave informed consent.
Measures
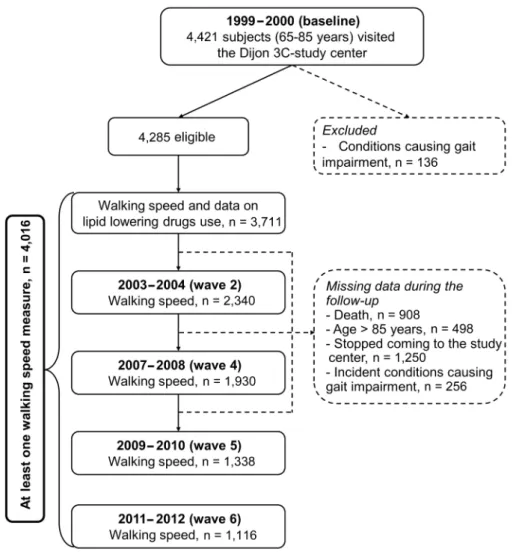
WS was measured at baseline and at 4 (2003–2004, wave 2), 8 (2007–2008, wave 4), 10 (2009–2010, wave 5), and 12 years (2011–2012, wave 6) later, among partici-pants up to 85 years of age who attended the study center
(Figure 1). WS was measured at the study center using two photoelectric cells connected to a chronometer placed in a corridor 6 m apart. Two tests were carried out; participants were first asked to walk at their “usual” speed and then at “fast” speed, ie, as fast as they could without running. For wave 6, a home measure was added using portable photoelectric cells (n = 202); WS was measured over a 6 m distance in 89% cased and between 3.5 and 5 m in 11% cases. WS was computed as 6 m divided by time taken to complete the test in seconds. In a test–retest study, the intraclass correlation coefficient (SE) was 0.84 (0.02) for usual and 0.92 (0.02) for FWS (11). Given similar results for both measures, the higher reliability of FWS, and a markedly larger decline over time of FWS compared with usual WS (12), all results are presented using the former measure.
Mortality was available until 2012. Participants were contacted at each wave, and relatives and personal physi-cians of those who could not be reached were contacted to obtain information on their vital status.
Information on other covariates (disability, falls, soci-odemographic, anthropometric, health behaviors, dis-eases, depressive symptoms, and cognition) is presented as
Supplementary Material. Statistical Methods
We excluded from the analyses participants with health conditions associated with marked gait impairment (recent hip fracture, parkinsonism, dementia, and disabling stroke; see Supplementary Table 1 for sensitivity analyses includ-ing these participants). Participants’ baseline characteristics are presented as a function of vital status at the end of fol-low-up and sex-specific tertiles of baseline FWS. Two sets of analyses were performed.
1. to compare change in fWS among deceased and non-deceased participants, change in FWS preceding death or end of the follow-up was estimated using linear mixed models with the intercept and slope as random effects and a backward time scale (7,13). In contrast to a positive scale starting at baseline, this approach does not assume that FWS trajectories continue after death. The starting time point (t = 0) was (a) date of wave 6 for participants with FWS data at wave 6, (b) date of death for participants whose FWS was assessed at the last wave before death, (c) the midpoint between the date at which FWS was last meas-ured and date of next wave for other participants. The time scale was defined backward from this starting point until the first FWS measure.
Vital status was included as a covariate in the linear mixed model to examine change in FWS as a function of vital status. First we modeled FWS as a function of vital status, age at t = 0, sex, time (in years), vital status × time, and age (at t = 0) × time (Model 1). The regression coef-ficient of the vital status × time interaction corresponds to the mean difference in annual change in FWS between deceased and nondeceased participants.
We then included additional covariates associated with FWS and vital status (Model 2). For time-invariant vari-ables (age, sex, height, education, smoking, and homocyst-eine), we included their main effect and interaction with time. Time-varying variables (body mass index, physical activity, coronary/peripheral artery disease, diabetes, mini-mental state examination score, lipid-lowering, antihyper-tensive, and psychotropic medications) were entered as main effects; in further analyses, we included their interac-tions with time.
We investigated whether delay between the last FWS measure and death or end of follow-up had an effect on the estimate of change in FWS by repeating the analyses in par-ticipants for whom a FWS measure was available in the last 2 or 4 years before death or end of follow-up.
FWS was not available for all participants at each wave. Reasons for missingness included death, age greater than 85 years, conditions associated with marked gait impairment,
home interviews, and loss to follow-up. To investigate the influence of missing data, we used multiple imputation (Supplementary Methods).
2. to assess whether adding change in fWS to a model including age, sex, and baseline fWS improved the prediction of mortality, we estimated annual change in FWS using ordinary least squares regression for participants with FWS measures at the first 2 waves (5,14). Standardized measures of baseline FWS and change in FWS were entered successively in an age- and sex-adjusted Cox proportional hazards model. In supplementary analyses, we entered FWS at wave 2 and checked whether adding change between baseline and wave 2 or baseline FWS improved prediction of mortality.
We repeated this analysis using categories of change in FWS based on two different definitions based on a distribu-tion-based method (15): (a) categories previously defined for usual WS (16) were “substantial” decline, less than −0.08 m/s; “small” decline, −0.08 to −0.04 m/s; and “nor-mal” change, more than or equal to −0.04 m/s; (b) catego-ries based on distribution of FWS in our population were “substantial” decline, less than −0.5 × SD of baseline FWS (<−0.14 m/s); “small” decline, −0.05 SD ≤ change <−0.02 SD (−0.14 to −0.06 m/s); and “normal” change, more than or equal to −0.02 SD (≥−0.06 m/s). Compared with a con-tinuous measure of change, an advantage of these cutoffs is that they may be more easy to implement in the clinical setting to identify persons with marked decline in whom preventive strategies may be useful.
To assess improvement in the model’s predictive value, we used an extension of the net reclassification improve-ment (NRI) for survival analysis that offers a simple way to assess improvement in risk reclassification in the context of comparing two models (17); 95% confidence intervals (CI) were computed using a bootstrap approach.
In order to examine whether change in FWS predicts both short- and long-term mortalities, we repeated these analyses by stratifying the follow-up period in two periods: the first 4 years following the last FWS measure and the years following this 4-year period.
Results
Sample Description
Among 4,285 participants eligible at baseline, 4,016 participants with at least 1 FWS measure during follow-up compose the study population (Figure 1). Participants without FWS measures (n = 269) were older and more disabled at baseline (p < .001). Of the 4,016 participants, 908 died during the follow-up, 498 reached their 86th birthday during the study period, 1,250 stopped coming to the study center or dropped out from the study, and 256 developed conditions that strongly affected gait. Of participants included in the
ChANGE IN WALKING SPEED BEfoRE DEAth 357
analysis, 664 (16.5%) contributed to five waves of data collection, 575 (14.3%) to four, 570 (14.2%) to three, 898 (22.4%) to two, and 1,309 (32.6%) to one. Participants with one FWS measure were older (75.7 vs 72.2 years, p < .0001) and walked slower (1.43 vs 1.58 m/s, p < .0001) at baseline. Table 1 presents baseline characteristics of study participants. Participants with slower baseline FWS were more likely to be older,
women, less educated, shorter, less physically active, have higher body mass index, greater number of pack-years of smoking, and more health problems.
Change in fWS in Deceased and Nondeceased Participants
Table 2 presents adjusted fixed effects for the model of annual change in FWS before death or end of follow-up
Table 2. Fixed Effects for Multilevel Models of Change in Fast Walking Speed Before Death or End of Follow-up
Fixed Effects
Model 1 Model 2*
Estimate (95% CI) p Estimate (95% CI) p
Intercept† 1.551 (1.537, 1.567) <.0001 1.581 (1.560, 1.603) <.0001
Sex (women vs men) −0.241 (−0.257, −0.226) <.0001 −0.192 (−0.215, −0.170) <.0001
Age (centered at 80 y), per 10-y increment) −0.152 (−0.174, −0.131) <.0001 −0.152 (−0.174, −0.131) <.0001
Vital status (dead vs alive) −0.090 (−0.113, −0.067) <.0001 −0.074 (−0.097, −0.051) <.0001
Time (annual change) −0.021 (−0.022, −0.020) <.0001 −0.020 (−0.022, −0.018) <.0001
Time × age −0.006 (−0.009, −0.002) .002 −0.006 (−0.010, −0.003) .0004
Time × vital status −0.009 (−0.013, −0.005) <.0001 −0.009 (−0.014, −0.005) <.0001
Notes: CI = confidence interval. *Adjusted for sex, age, vital status, education, height, smoking ≥20 pack-years, homocysteine, time, time × age, time × vital status, time × education, time × height, time × smoking ≥20 pack-years, time × homocysteine, time-dependent variables (body mass index, physical activity, coronary/ peripheral artery disease, antihypertensive drugs, diabetes, lipid-lowering drugs, mini-mental state examination score, psychotropic drugs).
†In model 1, the intercept corresponds to the average walking speed at the end of follow-up for men alive and aged 80 y. In model 2, the intercept corresponds to
the average walking speed at the end of follow-up for men alive and aged 80 y, with primary school level, body mass index = 25 kg/m2, height = 165 cm, physically
active, smoking <20 pack-years, no health conditions, mini-mental state examination = 30, homocysteine = 14 µmol/L.
Table 1. Baseline Characteristics of the Participants by Vital Status at the End of the Follow-up and Baseline Sex-Specific Tertiles of Fast Walking Speed (FWS)
Characteristics* Overall† (n = 4,016) Vital Status† P‡ Baseline FWS§ P¶ Alive (n = 3,108) Dead (n = 908) T1|| (n = 1,256) T2 (n = 1,258) T3 (n = 1,197) Age (M, SD) 73.4 (4.7) 72.7 (4.3) 75.7 (4.9) <.0001 75.3 (4.7) 73.2 (4.5) 71.7 (4.2) <.0001 Women 61.7 65.8 47.2 <.0001 60.8 65.5 58.6 <.0001
Primary school or less 34.7 34.6 34.8 .93 44.2 34.2 24.2 <.0001
BMI ≥30 kg/m2 13.5 12.9 15.4 .007 20.3 12.3 7.7 <.0001
Height, cm (M, SD) 161.7 (8.8) 161.4 (8.6) 163.0 (9.2) .79 160.48 (8.9) 161.26 (8.7) 163.53 (8.5) <.0001
Low physical activity 23.5 22.1 29.3 .002 30.3 20.7 19.5 <.0001
Grams of alcohol/wk (M, SD) 12.1 (13.7) 11.5 (13.3) 14.4 (15.6) .60 12.1 (14.3) 11.5 (13.2) 12.8 (13.6) .10
Smoking ≥20 pack-years 16.5 14.3 24.6 <.0001 17.4 16.0 16.2 .01
Coronary artery disease 10.2 8.4 16.3 <.0001 13.9 9.1 7.4 <.0001
Peripheral artery disease 3.2 2.1 6.9 <.0001 4.8 2.3 2.5 <.0001
Antihypertensive treatment 47.2 44.2 57.0 <.0001 57.1 45.2 39.0 <.0001 Diabetes mellitus 7.6 6.7 10.2 .003 9.9 6.7 6.1 <.0001 Homocysteine, µmol/L (M, SD) 14.9 (5.6) 14.5 (4.9) 16.3 (7.2) <.0001 15.8 (5.9) 14.56 (5.1) 14.3 (5.6) <.0001 Lipid-lowering drugs 33.6 34.3 30.5 .17 34.2 35.3 31.3 <.0001 MMSE score (M, SD) 27.5 (1.9) 27.5 (1.9) 27.2 (1.9) .02 27.0 (2.4) 27.6 (1.8) 27.8 (1.7) <.0001 Psychotropic drugs 25.5 24.0 28.5 .02 33.4 24.0 18.6 <.0001 Depressive symptoms# 13.1 12.4 14.1 .39 18.1 11.4 9.5 <.0001 NSAIDs 14.9 15.1 14.5 .72 19.5 14.4 10.6 <.0001 Disability** 5.0 3.6 9.0 <.0001 9.7 3.4 1.6 <.0001
Fall in the preceding year 16.9 16.2 19.9 .003 20.1 17.7 12.7 <.0001
Walking speed, m/s (M, SD) 1.5 (0.3) 1.6 (0.3) 1.5 (0.3) <.0001 1.2 (0.2) 1.5 (0.1) 1.9 (0.2) <.0001
Notes: ADL = activities of daily living; IADLs = instrumental activities of daily living; T = tertile; M = mean; SD = standard deviation; BMI = body mass index; MMSE = mini-mental state examination; NSAIDs = nonsteroidal anti-inflammatory drugs. *Percents unless otherwise stated.
†4016 participants with ≥1 FWS measure during follow-up.
‡Analysis of covariance (continuous variables) or Cochran-Mantel-Haenszel chi-square test (categorical variables) age adjusted and sex adjusted. §3711 participants with baseline FWS.
||Cutoffs: men: T1: ≤1.50 m/s; T2: 1.51–1.82 m/s; T3: >1.82 m/s; women: T1: ≤1.30 m/s; T2: 1.31–1.50 m/s; T3: >1.50 m/s. ¶Linear regression or analysis of covariance with continuous walking speed as the outcome, age- and sex adjusted. #Center for Epidemiological Studies-Depression score ≥17 for men or ≥23 for women.
(n = 4016). For nondeceased men aged 80 years at the end of follow-up, the average annual change in FWS was −0.021 m/s (95% CI: −0.022 to −0.020). Men who died during follow-up had a more pronounced decline (−0.031 m/s, CI: −0.035 to −0.026), corresponding to a difference of −0.009 m/s (CI: −0.013 to −0.005; Table 2, Model 1). This difference was not affected by age (p age × time × vital status = 0.16). Figure 2 shows the predicted mean FWS change for deceased and nondeceased men aged 80 years at the end of follow-up (Model 1); the difference in FWS between both groups increased as death or end of follow-up approached.
After adjustment for sociodemographic, anthropomet-ric, lifestyle, and health variables, the difference in FWS change between deceased and nondeceased participants was similar to the one estimated in Model 1 (−0.009 m/s, CI: −0.014 to −0.005; Table 2, Model 2). Including interac-tions between time-varying variables and time did not alter these findings (−0.008 m/s, CI: −0.013 to −0.004).
The difference in FWS change between deceased and nondeceased participants was also evident when restricting the analytic sample to those with data on FWS available in the last 2 years before death or end of follow-up (n = 1,573, 178 deaths: −0.009 m/s, CI: −0.015 to −0.002). This was also true for those with data in the last 4 years (n = 2,386, 390 deaths: −0.009 m/s, CI: −0.014 to −0.004).
Sensitivity analyses.—Compared with the −0.009 m/s difference in annual FWS change from main analy-ses, analyses including participants with health condi-tions associated with marked gait impairment showed a similar difference (−0.010 m/s, CI: −0.014 to −0.006;
Supplementary Table 1), as well as analyses based on multiple imputation (−0.008 m/s, CI: −0.013 to −0.003;
Supplementary Table 2).
Decline in fWS as a Predictor of Mortality
These analyses are based on 2,094 participants with FWS measures at the 2 first waves, among whom 308 (14.7%) died. The mean baseline FWS was 1.580 (SD = 0.299) m/s, and mean annual change in FWS was −0.023 (SD = 0.065) m/s.
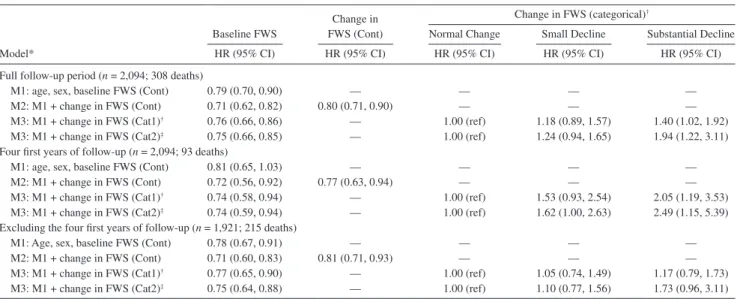
Table 3 shows hazards ratio (HR) for models adjusted succes-sively for baseline FWS and change in FWS. In an age- and sex-adjusted model, an increase of one SD in FWS at baseline was associated with a 21% lower mortality (HR = 0.79, CI: 0.70–0.90). When change in FWS was added, both baseline FWS (HR = 0.71, CI: 0.62–0.82) and change in FWS (HR = 0.80, CI: 0.71–0.90) independently predicted death. The NRI when adding change in FWS to the model including age, sex, and baseline FWS was 27.9% (CI: 9.3, 44.5%).
Analysis using categories of change in FWS defined by Kwon and colleagues (16) for usual WS showed that, compared with normal change (≥−0.04 m/s, n = 1,359, 184 deaths), substantial decline (<−0.08 m/s, n = 322, 58 deaths) was associated with a 1.4-fold greater risk of mortality (HR = 1.40, CI: 1.02–1.92) and small decline (−0.08 to −0.04 m/s, n = 413, 66 deaths) with a 1.2-fold greater risk (HR = 1.18, CI: 0.89–1.57; Table 3). The NRI when adding these cat-egories of change in FWS to the model adjusted for age, sex, and baseline FWS was 19.0% (0.6, 36.8%). Analyses using alternative categories of change defined based on the distribution of FWS in our population (small decline: −0.14 to −0.06 m/s, n = 403, 67 deaths; substantial decline: <−0.14 m/s, n = 97, 21 deaths; normal change: ≥−0.06, n = 1,594, 220 deaths) showed similar trends. The NRI when adding these categories of change in FWS to the model adjusted for age, sex, and baseline FWS was 16.3% (−2.6, 33.3%). There was no interaction (p > .67) between baseline FWS and categories of change in FWS, suggesting that the effect of change in FWS was evident at all levels of baseline FWS.
Analyses stratified by follow-up period showed that baseline FWS was associated both with short- and long-term mortalities, whereas the association with change in FWS was more pronounced in the first 4 years of follow-up, particularly when categories of change in FWS were used (Table 3).
Supplementary analysis (Supplementary Table 3) showed that in a model including age, sex and FWS at wave 2, base-line FWS or change in FWS between basebase-line and wave 2 were not associated with mortality and did not improve the predictive value of the model (all NRI not significantly dif-ferent from 0).
Discussion
Summary of the Results
In this large cohort study of community-dwelling elderly per-sons aged 65–85 years with up to five assessments of FWS over 12 years, participants who died during the study experienced a steeper decline in FWS before death compared with those who remained alive. We examined whether this difference had
Figure 2. Predicted trajectories of fast walking speed in deceased (solid line) and nondeceased (dashed line) men aged 80 years at the end of the follow-up and their 95% confidence intervals (dotted lines).
ChANGE IN WALKING SPEED BEfoRE DEAth 359
clinical implications and found that adding change in FWS to a survival model including age, sex, and baseline FWS improved the predictive performances of the model.
What this study Adds
There is robust evidence of an association between slower WS, when measured once, with subsequent mortality (1,2,18), but less is known about change in WS preceding death (1,2). Previous studies have examined the associa-tion between change in WS and risk of mortality (3–5,9) and showed that higher decline was associated with higher risk of mortality. Apart from one exception (9), these stud-ies were smaller than the present one, and change in WS was examined over a maximum of 2 years while participants were followed for mortality over at most 8 years (3–5). In the Health ABC study (n = 2,364) (9), WS was assessed three times over 2 years and the follow-up period for mortal-ity was of 10 years. Another study (n = 690) showed lower baseline scores and larger decline in a composite score of lower extremity function in 470 participants who died dur-ing a 12-year follow-up period (19). This study has several strengths: it is based on a large cohort of community-dwell-ing older adults; FWS was measured up to five times over 12 years; many potential confounders were assessed throughout follow-up. In addition to survival analyses similar to those previously carried out in other studies, we also used linear mixed models with a backward time scale to model change in FWS; this approach has been used to examine trajecto-ries of health indicators preceding adverse outcomes (7,13), including motor (8) and cognitive decline (7).
Baseline FWS and change in FWS had independent effects on the risk of death. Although there was both a short- and a long-term association between baseline FWS and death, our findings suggest that change in FWS had a more pro-nounced effect on the risk of death in the short term than in the long term. In addition, FWS at wave 2, which results from baseline FWS and decline in FWS between waves 1 and 2, appears to be a good predictor of upcoming death, and baseline FWS or change in FWS between baseline and wave 2 did not improve prediction of mortality compared with a model including FWS at wave 2 only. This result is compara-ble with findings from one study showing that 1-year change in FWS does not provide additional prognostic information for dependence in activities of daily living beyond that avail-able based on the last FWS measure (20). Our findings have three clinical implications: first, repeated assessments of FWS may help identify persons particularly at risk of adverse outcomes, even among those with normal baseline FWS; sec-ond, the advent of marked decline in FWS is suggestive of a higher risk of death in the relatively near future; third, if FWS is repeatedly measured, the last and more recent measure is sufficient to predict mortality. The identification of persons with marked motor decline should lead to assess their health status in order to identify possible causes and implement the corresponding therapeutic strategies.
As shown previously (12) and also found in the 3C Study, there is a greater decline and interindividual variability in fast than usual WS. This led us to use FWS for the analyses as it is expected that differences in decline across groups of people are more easily detectable by clinicians for this measure. There is no cutoff available for meaningful change
Table 3. Prediction of Mortality According to Baseline Fast Walking Speed (FWS) and Change in FWS
Model*
Baseline FWS
Change in FWS (Cont)
Change in FWS (categorical)†
Normal Change Small Decline Substantial Decline
HR (95% CI) HR (95% CI) HR (95% CI) HR (95% CI) HR (95% CI)
Full follow-up period (n = 2,094; 308 deaths)
M1: age, sex, baseline FWS (Cont) 0.79 (0.70, 0.90) — — — —
M2: M1 + change in FWS (Cont) 0.71 (0.62, 0.82) 0.80 (0.71, 0.90) — — —
M3: M1 + change in FWS (Cat1)† 0.76 (0.66, 0.86) — 1.00 (ref) 1.18 (0.89, 1.57) 1.40 (1.02, 1.92)
M3: M1 + change in FWS (Cat2)‡ 0.75 (0.66, 0.85) — 1.00 (ref) 1.24 (0.94, 1.65) 1.94 (1.22, 3.11)
Four first years of follow-up (n = 2,094; 93 deaths)
M1: age, sex, baseline FWS (Cont) 0.81 (0.65, 1.03) — — — —
M2: M1 + change in FWS (Cont) 0.72 (0.56, 0.92) 0.77 (0.63, 0.94) — — —
M3: M1 + change in FWS (Cat1)† 0.74 (0.58, 0.94) — 1.00 (ref) 1.53 (0.93, 2.54) 2.05 (1.19, 3.53)
M3: M1 + change in FWS (Cat2)‡ 0.74 (0.59, 0.94) — 1.00 (ref) 1.62 (1.00, 2.63) 2.49 (1.15, 5.39)
Excluding the four first years of follow-up (n = 1,921; 215 deaths)
M1: Age, sex, baseline FWS (Cont) 0.78 (0.67, 0.91) — — — —
M2: M1 + change in FWS (Cont) 0.71 (0.60, 0.83) 0.81 (0.71, 0.93) — — —
M3: M1 + change in FWS (Cat1)† 0.77 (0.65, 0.90) — 1.00 (ref) 1.05 (0.74, 1.49) 1.17 (0.79, 1.73)
M3: M1 + change in FWS (Cat2)‡ 0.75 (0.64, 0.88) — 1.00 (ref) 1.10 (0.77, 1.56) 1.73 (0.96, 3.11)
Notes: CI = confidence interval; Cont = continuous; Cat = categorical; M = model; HR = hazards ratio; ref = reference. *Continuous variables are standardized: the HR for baseline FWS corresponds to an increment of 0.299 m/s; the HR for FWS change corresponds to an increase in 1 y change FWS of 0.065 m/s.
†Categorical definition 1 (Cat1) of annual change in FWS: substantial decline: <−0.08 m/s; small decline: −0.08 to −0.04 m/s; normal: ≥−0.04 m/s. ‡Categorical definition 2 (Cat2) of annual change in FWS: substantial decline: <−0.14 m/s; small decline: −0.06 to −0.14 m/s; normal: ≥−0.06 m/s. §p value comparing the predictive values of M2/M3 with M1.
in FWS, so we used the cutoffs proposed by Kwon and col-leagues (16) for usual WS to identify clinically meaning-ful change and they appeared to be relevant with respect to mortality in our study. The alternative method that we used to define categories of change in FWS based on cut-points derived from a distribution-based method showed slightly stronger associations with mortality, although CIs were larger due to the small number of participants with substan-tial decline. Further research is thus needed to replicate these analyses and define cutoffs for meaningful change for FWS. Potential Mechanisms
Walking is a complex activity involving several (eg, mus-culoskeletal, pulmonary, neurological, and cardiovascular) systems (2). Mechanisms underlying the WS-mortality asso-ciation are likely to be multifactorial. First, cardiovascular health is a common determinant of WS and longevity. WS has been associated with several cardiovascular outcomes or risk factors, including cardiovascular death (18), stroke (21), diabetes (22), homocysteine (23), hypertension (11), arterial stiffness (24), coronary artery calcification (25), and intima-media thickness (26). In this study, after adjustment for car-diovascular risk factors and diseases, the association between WS decline and mortality remained robust. Nevertheless, WS decline could reflect underlying cardiovascular conditions not taken into account, and imperfect measurement of cardiovas-cular risk factors may have resulted in residual confounding. The number of events did not allow us to perform analyses by cause of death, which may be useful in future studies. Second, slow WS is a risk factor for dependency (27), which predicts mortality (28) and could represent an intermediate factor. Third, WS decline may be an early indicator of loss of muscle strength (12,29) or sarcopenia (30) and frailty (31), which predict mortality (31). Inflammation plays a role in frailty (32,33), and increased levels of inflammatory markers have been shown to be associated with slower WS (34,35) and higher risk of mortality (36,37). Thus, inflammatory pro-cesses could be involved in this association (38).
Investigation into cognitive trajectories of older adults provides evidence of a more market decline in cognitive function in the years before death, irrespective of premor-bid cognitive level (6,7). When this rapid decline in cog-nitive function is gradual in the years preceding death, it is referred to “terminal decline,” and when this decline is interrupted by precipitous acceleration of the decline, it is referred to “terminal drop” (39). The extent to which a sim-ilar phenomenon exists for physical functioning has been little explored (8). Because participants who died during the follow-up were more likely to reach their 86th birthday during the follow-up, FWS measures were more likely to be missing in the few years preceding death; therefore, we could not distinguish whether there was a gradual decline (terminal decline) or an abrupt change (terminal drop) before death usually assessed using a quadratic term for
change over time or change point models (39), but we were only able to study change in FWS as a linear function of time due to those missing FWS before death. Higher reso-lution data with shorter intervals between WS measures are needed to address this question.
In order to assess whether the greater FWS decline observed in the years preceding death was confounded by cognitive decline, analyses were adjusted for cognitive status (mini-mental state examination) modeled as a time-varying variable, and the association remained unchanged. Declines in cognitive function and FWS before death might represent two different aspects of the same process and suggest that different physiological functions exhibit faster decline in the years preceding death. The parallel-ism between declines in cognitive and physical functioning is important and further research is required to assess the extent to which this finding extends to other physical meas-ures (strength and balance).
Study Limitations
The main limitation of our analyses is related to partici-pants who dropped out during follow-up. One of the main reasons was that FWS was not measured in participants who were interviewed at home at all waves. Nevertheless, other measures (eg, disability, falls, and cognition) linked to functional health were assessed in these persons and used in analyses based on multiple imputation that yielded results that were in agreement with our main conclusion. In addition, FWS was not measured after 85 years, so we cannot test whether our findings on change in FWS can be extended to older ages. Finally, participants who accepted to participate to the study were community-dwelling, well-functioning older people. Although this is likely to lead to an underestimation of the incidence of events such as death, it has been shown that the relation between an exposure and mortality during follow-up is less likely to be biased (40).
Conclusion
This study shows that FWS decline is greater in individu-als aged 65–85 years who will die in the next few years than in those who remain alive and that FWS change pre-dicts mortality independently of baseline FWS. Therefore, repeated FWS measures may be clinically useful in elderly people and may help identify persons with marked motor decline in whom health assessments and preventive strate-gies may be useful. Future research should measure FWS on several occasions with shorter intervals between meas-ures, to detect when FWS trajectories of participants at higher risk of mortality deviate from those at lower risk.
Supplementary Material
Supplementary material can be found at: http://biomedgerontology. oxfordjournals.org/
ChANGE IN WALKING SPEED BEfoRE DEAth 361
Funding
Caisse Nationale Maladie des Travailleurs Salariés, Direction Générale de la Santé, Haute Autorité de la Santé, Institut National de Prévention et d’Education pour la Santé, Conseils Régionaux de Bourgogne, Fondation de France, Ministry of Research-Institut National de la Santé et de la Recherche Médicale Program, Cohortes et collections de don-nées biologiques, Mutuelle Générale de l’Education Nationale, Institut de la Longévité, Conseil Général de la Côte d’or, National Institute on Aging (R01AG034454 to S.S.; R01AG013196 to J.H.), French National Research Agency (C.T.), Fondation Plan Alzheimer (C.T.).
Acknowledgments
We thank the study participants and persons involved in data collec-tion and study coordinacollec-tion. We thank Archana Singh-Manoux for useful comments. We thank Michael J. Pencina (Boston University) for provid-ing a SAS macro in order to compute the NRI in the context of survival analysis.
References
1. Cooper R, Kuh D, Hardy R; Mortality Review Group; FALCon and HALCyon Study Teams. Objectively measured physical capabil-ity levels and mortalcapabil-ity: systematic review and meta-analysis. BMJ. 2010;341:c4467.
2. Studenski S, Perera S, Patel K, et al. Gait speed and survival in older adults. JAMA. 2011;305:50–58.
3. Hardy SE, Perera S, Roumani YF, Chandler JM, Studenski SA. Improvement in usual gait speed predicts better survival in older adults. J Am Geriatr Soc. 2007;55:1727–1734.
4. Perera S, Studenski S, Chandler JM, Guralnik JM. Magnitude and patterns of decline in health and function in 1 year affect subsequent 5-year survival. J Gerontol A Biol Sci Med Sci. 2005;60:894–900. 5. Buchman AS, Wilson RS, Boyle PA, Bienias JL, Bennett DA. Change
in motor function and risk of mortality in older persons. J Am Geriatr
Soc. 2007;55:11–19.
6. Thorvaldsson V, Hofer SM, Berg S, Skoog I, Sacuiu S, Johansson B. Onset of terminal decline in cognitive abilities in individuals without dementia. Neurology. 2008;71:882–887.
7. Wilson RS, Beckett LA, Bienias JL, Evans DA, Bennett DA. Terminal decline in cognitive function. Neurology. 2003;60:1782–1787. 8. Wilson RS, Segawa E, Buchman AS, Boyle PA, Hizel LP, Bennett DA.
Terminal Decline in Motor Function. Psychol Aging. 2012.
9. White DK, Neogi T, Nevitt MC, et al. Trajectories of gait speed predict mortality in well-functioning older adults: the Health, Aging and Body Composition study. J Gerontol A Biol Sci Med Sci. 2013;68:456–464. 10. 3C Study group. Vascular factors and risk of dementia: design of the
Three-City Study and baseline characteristics of the study population.
Neuroepidemiology. 2003;22:316–325.
11. Dumurgier J, Elbaz A, Dufouil C, Tavernier B, Tzourio C. Hypertension and lower walking speed in the elderly: the Three-City study. J hypertens. 2010;28:1506–1514.
12. Bohannon RW. Comfortable and maximum walking speed of adults aged 20-79 years: reference values and determinants. Age Ageing. 1997;26:15–19.
13. Gao S, Nguyen JT, Hendrie HC, et al. Accelerated weight loss and incident dementia in an elderly African-American cohort. J Am
Geriatr Soc. 2011;59:18–25.
14. Buchman AS, Boyle PA, Wilson RS, et al. Loneliness and the rate of motor decline in old age: the Rush Memory and Aging Project, a community-based cohort study. BMC Geriatr. 2010;10:77.
15. Yost KJ, Eton DT. Combining distribution- and anchor-based approaches to determine minimally important differences: the FACIT experience. Eval health Prof. 2005;28:172–191.
16. Kwon S, Perera S, Pahor M, et al. What is a meaningful change in physical performance? Findings from a clinical trial in older adults (the LIFE-P study). J Nutr health Aging. 2009;13:538–544.
17. Pencina MJ, D’Agostino RB Sr, Steyerberg EW. Extensions of net reclassification improvement calculations to measure usefulness of new biomarkers. Stat Med. 2011;30:11–21.
18. Dumurgier J, Elbaz A, Ducimetière P, Tavernier B, Alpérovitch A, Tzourio C. Slow walking speed and cardiovascular death in well func-tioning older adults: prospective cohort study. BMJ. 2009;339:b4460. 19. Botoseneanu A, Allore HG, Gahbauer EA, Gill TM. Long-term trajec-tories of lower extremity function in older adults: estimating gender differences while accounting for potential mortality bias. J Gerontol
A Biol Sci Med Sci. 2013;68:861–868.
20. Gill TM, Williams CS, Mendes de Leon CF, Tinetti ME. The role of change in physical performance in determining risk for dependence in activities of daily living among nondisabled community-living elderly persons. J Clin Epidemiol. 1997;50:765–772.
21. Langhorne P, Coupar F, Pollock A. Motor recovery after stroke: a sys-tematic review. Lancet Neurol. 2009;8:741–754.
22. Ko SU, Stenholm S, Chia CW, Simonsick EM, Ferrucci L. Gait pat-tern alterations in older adults associated with type 2 diabetes in the absence of peripheral neuropathy–results from the Baltimore Longitudinal Study of Aging. Gait Posture. 2011;34:548–552. 23. Soumaré A, Elbaz A, Zhu Y, et al. White matter lesions volume and
motor performances in the elderly. Ann Neurol. 2009;65:706–715. 24. Brunner EJ, Shipley MJ, Witte DR, et al. Arterial stiffness,
physi-cal function, and functional limitation: the Whitehall II Study.
hypertension. 2011;57:1003–1009.
25. Inzitari M, Naydeck BL, Newman AB. Coronary artery calcium and physical function in older adults: the Cardiovascular Health Study. J
Gerontol A Biol Sci Med Sci. 2008;63:1112–1118.
26. Elbaz A, Ripert M, Tavernier B, et al. Common carotid artery intima-media thickness, carotid plaques, and walking speed. Stroke. 2005;36:2198–2202.
27. Cooper R, Kuh D, Cooper C, et al.; FALCon and HALCyon Study Teams. Objective measures of physical capability and subsequent health: a systematic review. Age Ageing. 2011;40:14–23.
28. Thorpe RJ Jr, Weiss C, Xue QL, Fried L. Transitions among disa-bility levels or death in African American and white older women. J
Gerontol A Biol Sci Med Sci. 2009;64:670–674.
29. Ko SU, Stenholm S, Metter EJ, Ferrucci L. Age-associated gait patterns and the role of lower extremity strength - results from the Baltimore Longitudinal Study of Aging. Arch Gerontol Geriatr. 2012;55:474–479.
30. Cruz-Jentoft AJ, Landi F, Topinková E, Michel JP. Understanding sar-copenia as a geriatric syndrome. Curr opin Clin Nutr Metab Care. 2010;13:1–7.
31. Fried LP, Tangen CM, Walston J, et al.; Cardiovascular Health Study Collaborative Research Group. Frailty in older adults: evidence for a phenotype. J Gerontol A Biol Sci Med Sci. 2001;56:M146–M156. 32. Phan HM, Alpert JS, Fain M. Frailty, inflammation, and
cardio-vascular disease: evidence of a connection. Am J Geriatr Cardiol. 2008;17:101–107.
33. Leng SX, Xue QL, Tian J, Walston JD, Fried LP. Inflammation and frailty in older women. J Am Geriatr Soc. 2007;55:864–871. 34. Hamer M, Kivimaki M, Lahiri A, et al. Walking speed and subclinical
atherosclerosis in healthy older adults: the Whitehall II study. heart. 2010;96:380–384.
35. Hsu FC, Kritchevsky SB, Liu Y, et al.; Health ABC Study. Association between inflammatory components and physical function in the health, aging, and body composition study: a principal component analysis approach. J Gerontol A Biol Sci Med Sci. 2009;64:581–589. 36. Roubenoff R, Parise H, Payette HA, et al. Cytokines, insulin-like
growth factor 1, sarcopenia, and mortality in very old community-dwelling men and women: the Framingham Heart Study. Am J Med. 2003;115:429–435.
37. Cappola AR, Xue QL, Ferrucci L, Guralnik JM, Volpato S, Fried LP. Insulin-like growth factor I and interleukin-6 contribute synergistically
to disability and mortality in older women. J Clin Endocrinol Metab. 2003;88:2019–2025.
38. Elbaz A, Sabia S, Brunner E, et al. Association of walking speed in late midlife with mortality: results from the Whitehall II cohort study.
Age (Dordr). 2013;35:943–952.
39. MacDonald SW, Hultsch DF, Dixon RA. Aging and the shape of cognitive change before death: terminal decline or terminal drop?
J Gerontol B Psychol Sci Soc Sci. 2011;66:292–301.
40. Criqui MH. Response bias and risk ratios in epidemiologic studies.