HAL Id: inserm-00383149
https://www.hal.inserm.fr/inserm-00383149
Submitted on 12 May 2009HAL is a multi-disciplinary open access archive for the deposit and dissemination of sci-entific research documents, whether they are pub-lished or not. The documents may come from teaching and research institutions in France or abroad, or from public or private research centers.
L’archive ouverte pluridisciplinaire HAL, est destinée au dépôt et à la diffusion de documents scientifiques de niveau recherche, publiés ou non, émanant des établissements d’enseignement et de recherche français ou étrangers, des laboratoires publics ou privés.
Population pharmacokinetic analysis of lamivudine,
stavudine and zidovudine in controlled HIV-infected
patients on HAART.
Xavière Panhard, Mayeule Legrand, Anne-Marie Taburet, Bertrand Diquet,
Cécile Goujard, France Mentré, Cophar 1 Anrs 102 Study Group
To cite this version:
Xavière Panhard, Mayeule Legrand, Anne-Marie Taburet, Bertrand Diquet, Cécile Goujard, et al.. Population pharmacokinetic analysis of lamivudine, stavudine and zidovudine in controlled HIV-infected patients on HAART.. European Journal of Clinical Pharmacology, Springer Verlag, 2007, 63 (11), pp.1019-29. �10.1007/s00228-007-0337-x�. �inserm-00383149�
Population pharmacokinetic analysis of
lamivudine, stavudine and zidovudine in
controlled HIV-infected patients on HAART
Xavi`ere Panhard1,∗, Mayeule Legrand2, Anne-Marie Taburet3, Bertrand Diquet4, C´ecile Goujard5, France Mentr´e1 and the Cophar 1 - ANRS 102 study group
INSERM, U738, Paris, France; AP-HP, Hˆopital Bichat, UF de Biostatistiques, Paris, France; Universit´e Paris 7 Denis Diderot, UFR de M´edecine, Paris, France1
; AP-HP, Hˆopital La Piti´e-Salp´etri`ere, D´epartement de Pharmacologie Clinique, Paris, France2
; AP-HP, Hˆopital Bicˆetre, Service de Pharmacie Clinique, Le Kremlin-Bicˆetre, France3
; CHU ANGERS, Service de Pharmacologie Clinique et Toxicologie, Angers, France4
; AP-HP, Hˆopital Bicˆetre, Service de M´edecine Interne, Le Kremlin-Bicˆetre, France5
∗ Corresponding author. Mailing address : Xavi`ere Panhard, INSERM U738, 16 rue Henri Huchard, 75018
Paris, FRANCE tel: 33 1 57 27 75 34 fax: 33 1 57 27 75 21 E-mail: [email protected] Number of pages: 27. Number of figures: 3. Number of tables: 6.
Objective: This work aimed at building a population pharmacokinetic (PK) model for lamivudine (LMV), stavudine (STV) and zidovudine (ZDV), estimating their inter and intra-individual PK variability and investigating the influence of different covariates.
Methods: Population PK of LMV, STV and ZDV was separately evaluated from plasma concentrations obtained in 54, 39 and 27 HIV1-infected patients, respectively, enrolled in the COPHAR1-ANRS102 trial. The primary objective of this trial was to study the pharmacoki-netics of indinavir (IDV) and nelfinavir (NFV) in treated patients with a sustained virological response. Concentrations of nucleoside analogs (NA) were measured in plasma as a secondary objective. A one compartment model with first order elimination was used, with zero order absorption for LMV and first order absorption for STV and ZDV.
Results: Mean parameters (inter-patient variability in CV%) of LMV, STV and ZDV were: oral volume of distribution (V /F ) 145L (52%), 24 L (81%) and 248 L (80%), oral clearance (Cl/F) 32 L/h, 16 L/h (74%) and 124 L/h (51%), respectively. For LMV, absorption duration (Ta) was 1.46 h (64%). For STV and ZDV, ka was 0.46 h−1 and 2.9 h−1, respectively. We found a systematic effect of combination with NFV vs IDV. We found that intra-patient variability was greater than inter-patient variability (except for STV) and greater than 55% for the three drugs.
Conclusion: This trial enabled the estimation of the population PK parameters of three NA in patients with a sustained virological response, and the median curves could be used as ref-erences for concentration-controlled strategies. We observed, as for the protease inhibitors, a great variability of PK parameters.
INTRODUCTION
Therapeutic drug monitoring (TDM) of protease inhibitors and non-nucleoside reverse tran-scriptase inhibitors has been largely investigated, and its importance has been demonstrated in special populations (pregnant women, hepatic failure, etc ...). Pharmacokinetic (PK) studies performed in patients having an optimal response to HAART, are the gold standard to define reference curves for TDM.
For nucleoside analogs (NA), TDM is generally not recommanded because the concentra-tion/effect relationship has not been clearly defined and because NA in plasma need to be phophorylated before becoming active in the cell. On the other hand, the potential interest of concentration-controlled regimens of NA has already been shown [1–4]. However, very few data are available on the PK of NA in patients succesfully treated with HAART. Such data are important to correlate plasma and intracellular concentrations and to establish a range of effective and non toxic plasma concentrations of all components of HAART.
The COPHAR1-ANRS102 trial was a prospective, open-label, multicenter trial which pri-mary objective was to study the PK of indinavir (IDV) and nelfinavir (NFV) in patients on sustained virological success. Reference therapeutic windows for the TDM of IDV and NFV were defined according to the concentration data measured in this trial [5]. The population ap-proach was also used to describe the PK of IDV and NFV, to estimate inter- and intra-patient variabilities of the PK parameters, and to test the effect of covariates. An increase of IDV and NFV clearance was found in patients receiving zidovudine (ZDV) as part of their treat-ment [6, 7]. In COPHAR1-ANRS102, patients received either lamivudine (LMV), stavudine (STV) or zidovudine (ZDV) as part of their treatment, in addition to one protease inhibitor. As a secondary objective, NA concentrations were measured in the same plasma samples col-lected to study the PK of NFV and IDV. The aim of the present study was to build a population PK model for LMV, STV and ZDV, to estimate their inter- and intra-individual PK variability and to investigate the influence of different covariates on the PK parameters of these three drugs.
MATERIAL AND METHODS
Study design and patients
The COPHAR1-ANRS102 trial was a prospective, multicentre, open-label trial which included HIV-infected adults currently treated with an antiretroviral combination of at least two drugs, containing either IDV or NFV. Enrolment started in February 2001 and the last subject com-pleted the study in October 2002. To be eligible, patients had to be treated with a stable
regimen for at least 4 months with a sustained virological response defined by a plasma HIV RNA level below 200 copies/mL for at least 4 months. The main exclusion criteria were the following: concomitant use of drugs interacting with IDV or NFV, renal failure (defined by a serum creatinine greater than 180 µmol/L), liver dysfunction (defined by a serum aminotrans-ferase level greater than twice the upper limit of normal, a prothrombin test below 50% or a diagnosed liver cirrhosis), pregnancy, ongoing acute opportunistic infection or cancer.
All patients received the standard dose of 300 mg per day for LMV. The STV dose was prescribed according to subject’s weight: 60 mg per day for subjects whose weight was less than 60 kg, and 80 mg per day for those whose weight was greater than 60 kg. The recommended standard daily dose for ZDV was 600mg.
The Ethical Review Committee of the Bicˆetre Hospital, Paris, France reviewed and approved the study protocol. All participants provided written informed consent. At the screening visit (V0), inclusion criteria were checked. At visit 1 (V1), one month after inclusion, patients underwent a 6-hour blood sampling for concentration assay. At visit 2 (V2), four months after inclusion, two additional blood samples were collected. The trial ended 8 months after inclusion (V3), when clinical, immunological and virological data were collected. Only patients with a sustained virological response, i.e. 4 months before inclusion plus 8 months after inclusion, were analysed.
Adherence was evaluated using a validated auto-questionnaire and applying the algorithm proposed by Carrieri et al. [8]. Patients were classified as highly adherent if they reported taking 100% of their prescribed regimen in the last four days, moderately adherent if they reported missing no more than 20% of their treatment, and non-adherent if they reported taking less than 80% of their treatment.
PK samples and concentration measurement
PK sampling was designed according to the dosing regimen of the PIs. The interval between the last dose on the previous day and the morning dose was planned for 12 hours (+/-2 hours) for bid dosing and for 8 hours (+/- 2 hours) for tid dosing. At V1, plasma samples were collected before dosing (trough sample) and at 0.5 hour, 1, 3 and 6 hours after drug intake. At V2, a
sample was collected 8 hours (+/-2 hours) or 12 hours (+/-2 hours) for tid and bid dosing, respectively, after the last drug intake, and a second sample 1 hour after observed drug intake in patients treated with IDV alone, or 3 hours after observed drug intake in patients receiving NFV or IDV/ritonavir in order to reach the Cmax of the corresponding PI. For each sample performed after the observed drug intake, the exact interval between last drug intake and blood sampling was recorded. For trough samples, the delay since last dose was evaluated from the time of last evening dose reported by the patient and the exact sampling time in the morning. All NA concentrations measured at V1 and NA concentrations measured one hour (C1h) and three hours after dose (C3h) measured at V2 are analysed in this paper.
NA concentrations were measured in each plasma sample in a central laboratory of phar-macology in Paris. NA were isolated from alkaline plasma samples by double-step solid-liquid extraction and their concentrations were determined by specific high-performance liquid chro-matography assays with ultraviolet - photodiode array [9]. Interlaboratory quality control results at three concentrations (50, 400 and 1000 ng/mL for LMV and 25, 200 and 400 ng/mL for both STV and ZDV) were within 20% of the target values for the three NA. Lower limits of quantification (LOQ) were 20 ng/mL, 10 ng/mL and 10 ng/mL for LMV, STV and ZDV, respectively.
Population pharmacokinetic model
For each of the 3 NA, we tested a one-compartment model with first-order absorption or zero order absorption to analyse concentrations measured at V1. The parameters of these two models are the first-order absorption rate constant (ka) or the zero order absorption duration (Ta), the apparent elimination clearance (Cl/F ) and the apparent volume of distribution (V /F ).
With respect to timing assumptions, exact sampling times were taken for samples scheduled at 0.5, 1, 3 and 6 hours after the morning dose. For modelling, we assumed that trough samples were obtained after the other measurements on the same PK profile.
For each NA, the statistical model for the observed concentration Cij of patient i at the sampling time tij is:
where θi is the vector of the logarithm of all the PK parameters of patient i and εij is the measurement error.
For each NA, we assumed that the errors εij given θi are independent and normally dis-tributed with a null mean and an heteroscedastic variance σ2
ij, which was modelled using a combined proportional and additive error model:
σ2ij = σ2(a + f (tij, θi))2
This combined error model (additive and proportional) is commonly used in population pharma-cokinetics. For high concentrations, variance becomes proportional to the squared concentration whereas for low concentrations, the variance becomes proportional to a2. When LMV, STV or ZDV concentrations were below the LOQ, we set them at LOQ/2 [10]. If several consecutive concentrations were below the LOQ, the first was set to the corresponding value of LOQ/2 and the others were removed from the analysis.
We assumed that the logarithm of the individual parameters θi are random vectors and that θi can be decomposed as:
θi = θ + bi
where θ is the population mean vector of size p, and bi is the random effect of subject i, which is assumed to be normally distributed with zero mean and diagonal variance Ω. The standard deviations of the additive random effects on the log transformed PK parameters are then a first order approximation of the coefficient of variation (CV ) of the original PK parameters. These standard deviations are the square roots of the diagonal elements of Ω.
The parameters were estimated using Lindstr¨om and Bates’ algorithm implemented in the nlme function of R 2.0 software (R Foundation for Statistical Computing, Vienna, Austria) [11–13]. The estimates for the standard errors (SE) of the parameters were used to derive the corresponding asymptotic 95% confidence intervals.
Modelling strategy
For each drug, we first selected the pharmacokinetic model (one compartment model with zero order or first order absorption and first order elimination) based on the Akaike criterion (AIC) [14] using a combined error model. We then selected the error model, starting with the previous combined error model where a and σ are estimated. We also tried a model where a is fixed, a model where a is fixed to zero, and an additive error model. Using the best error model, selected according to the AIC, we built a model with random effects on all PK parameters. We used a backward elimination procedure to test whether each random effect should stay in the model. Goodness-of-fit plots (weighted residuals versus predicted concentrations and versus time) were examined for each model. Models were also compared using the AIC.
For each NA and for each PK parameter whose random effect remained in the model, we eval-uated the effects of the following covariates: age, sex, body weight, co-administrated protease inhibitor (NFV or IDV), co-administration of other antiretroviral drugs (as a binary variable for each drug) and treatment adherence (as a categorical variable). We tested the covariates on the Empirical Bayes estimates of each individual parameter using Spearman non-parametric correlation tests for continuous covariates and Wilcoxon or Kruskal-Wallis tests for categorical covariates with two or more than two categories, respectively. The population covariate model was then built with the covariates which were found to have an effect on the Empirical Bayes estimates with a p-value smaller than 0.20. Continuous covariates were centered on their me-dian. All population models with all the combinations of these selected covariates were then evaluated. The combination with the smallest AIC was chosen as the best population covariate model. The p-values of the covariates were then derived using the Likelihood Ratio Test (LRT).
Model evaluation
We produced the goodness-of-fit plots (population predicted concentrations vs observed con-centrations, individual predicted concentrations versus observed concentrations and population weighted residuals versus observed concentrations) for each of the three NA. We also simu-lated steady-state concentration profiles for the three studied NA and compared them to the
observed data in order to evaluate the predictive performance of the model. More precisely, a vector of PK parameters was simulated for 5000 patients using the final model of each NA. Each parameter vector was drawn in a normal distribution with a variance equal to the inter-variability estimated before. We simulated the covariates included in the final model, using the estimated distribution in the sample of patients. A simulated measurement error was added to each simulated concentration. We simulated 5000 concentration profiles by increments of 0.01 hour. The 10th, 50thand 90thpercentiles of the simulated concentrations at each time were com-pared with the observed concentration data for the patients with the corresponding regimen. The 50th percentile of the simulated concentrations was compared with the observed median of concentration data estimated at 0.5, 1, 3 and 6 hours after drug intake and for the trough con-centration. For trough concentrations, we calculated the median from concentrations measured between 10 h and 14 h after drug intake, since there was an important variability of sampling time for that measurement. The simulations were performed using R 2.0 (R Foundation for Statistical Computing, Vienna, Austria) [13].
Estimation of intra-patient variability
From the two concentration measurements of the same time at visit 1 and visit 2, we estimated the inter- and intra-patient variability for C1h in patients receiving IDV alone and for C3h in patients receiving IDV/ritonavir or NFV. We did not estimated the intra-patient variability of trough concentrations since the time of drug intake on the previous day suffered from too much uncertainty. Moreover, since the sampling protocole had been designed for the two PIs, an important proportion of the NA trough concentrations were below the LOQ : 7.3% for LMV; 35.7% for STV and 46.3% for ZDV; therefore, the estimation of intra-patient variability would have been difficult.
We used a linear mixed effects model and assumed that the logarithm of the individual concentrations yik of patient i on visit k (k = 1, 2) can be decomposed as:
where Ti is equal to 0 if C1h was analysed for subject i and 1 if C3h was analysed; β is the effect quantifying the difference between concentrations measured 1 hour and 3 hours after drug intake, ηi is the random effect of subject i with null mean and variance γ2 and κik is the intra-individual random effect, with null mean and variance ψ2. Using a first order approximation, γ and ψ are estimates of the inter- and intra-patient coefficient of variation of the untransformed concentrations. The estimation was performed using the lme function of R 2.0 [12, 13].
RESULTS
Patients
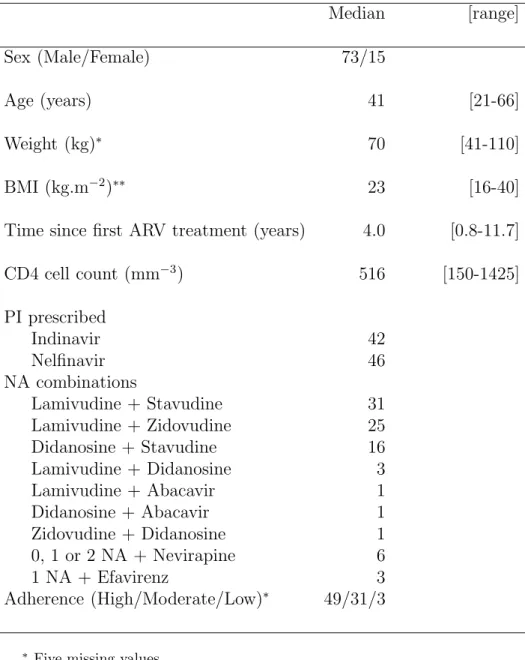
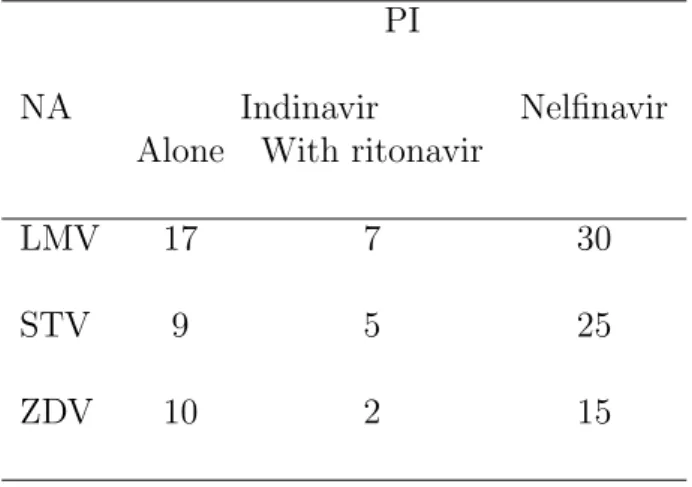
Ninety-five patients were included in the COPHAR1-ANRS102 trial. Eighty-eight of them had a sustained virological response for the 8 months of follow-up and were analysed. The characteristics of these patients are shown on table I. The pharmacokinetics of 54, 39 and 27 patients also receiving LMV, STV and ZDV respectively could be analysed. Some patients had to be excluded since their NA intake was not compatible with the PK samples. The number of patients is therefore different between table I and table II. For LMV, the only regimen was 150 mg twice daily. For STV, 31 patients received 40 mg bid and 8 patients received 30 mg twice daily. For ZDV, 24 patients received 300 mg twice daily and 3 patients received 250 mg twice daily. The repartition of these patients between the two PI groups is shown on table II.
Lamivudine
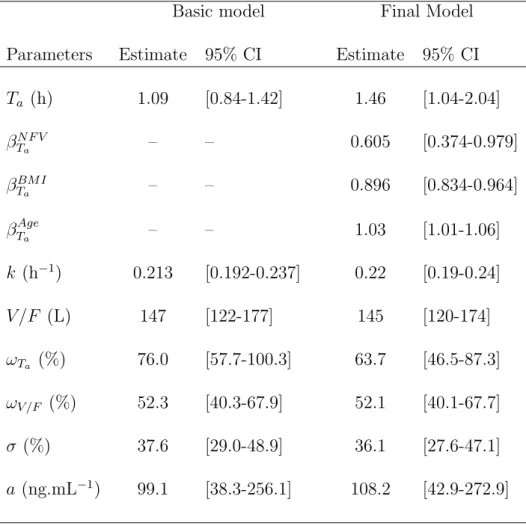
Two hundred and sixty-seven concentration data were obtained from the 54 patients receiv-ing LMV (Fig. 1.A). Eight concentrations were below the quantifition limit (LOQ); six were set to LOQ/2, and the other two were exluded, since they were consecutive to a first con-centration found below the quantification limit. The one-compartment model with zero-order absorption and first order elimination achieved the smallest AIC. Moreover, the model had to be parametrized in log(k) rather than log(Cl/F ) to achieve convergence. A combined error model, where a was estimated, was selected. Random effects could be estimated on log(Ta) and log(V /F ). The parameter estimates of this basic model are displayed in table III.
From the univariate selection performed on the individual parameters, several significant covari-ates were found on log(Ta) only: the co-administered PI, combination with ZDV, combination with STV, age, BMI and creatinine clearance. Since a model with these 6 covariates did not achieve convergence, we performed a preselection using a multiple linear model with a backward selection on the individual parameters of log(Ta). The final model included the co-administered PI, age and BMI, and was therefore:
Ta= 1.46 × 0.605N F V × 0.896(BM I−23) × 1.03(Age−41) h
where NF V equals 1 if patient received NFV as a part of his treatment, and 0 otherwise. Absorption duration was 40% smaller in patients receiving NFV versus IDV as a PI (p¡10−4). The effect found for age corresponds to an increase of 36% of Ta for an increase of 10 years of age (p=0.0143). The effect found for BMI corresponds to a decrease of 10% of Ta for an increase of one BMI unit (p¡10−4). Parameters estimates are presented in table III. Inter-patient variability was found to be large: 63.7% for log(Ta) and 52.1% for log(V /F ). The predicted curve for the mean PK parameters corresponding to each co-administered PI are overlayed on the observed concentration data of LMV in Fig. 1.A.
Stavudine
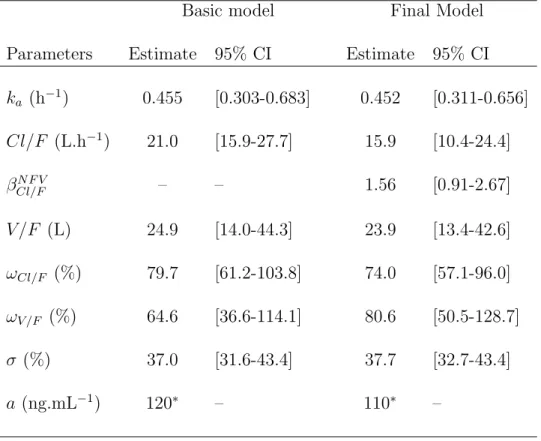
One hundred and eighty two concentration data were obtained from the 39 patients receiv-ing STV. Seventeen concentrations were below the quantifition limit (LOQ) and were fixed to LOQ/2.The one-compartment model with first-order absorption and first order elimination achieved the smallest AIC. A combined error model with a fixed to 120 ng/mL was selected, and random effects could be estimated on log(Cl/F ) and log(V /F ). The parameter estimates of the basic model are displayed in table IV. The univariate covariate selection identified the co-admisitered PI, creatinine clearance and body weight as possibly significant factors explaining the variability observed on log(Cl/F ). No covariate was found to be associated with log(V /F ). The final model found for Cl/F included only NFV as a covariate and was:
where NF V equals 1 if patient received NFV as a part of his treatment, and 0 otherwise. The oral clearance was found to be 56% higher in patients receiving NFV versus IDV as a PI (p=0.031). Inter-patient variability was found to be even larger than for LMV: 77.2% for log(Cl/F ) and 82.4% for log(V /F ). The predicted curve for the mean PK parameters corresponding to each co-administered PI are overlayed on the observed concentration data of STV in Fig. 1.B.
Zidovudine
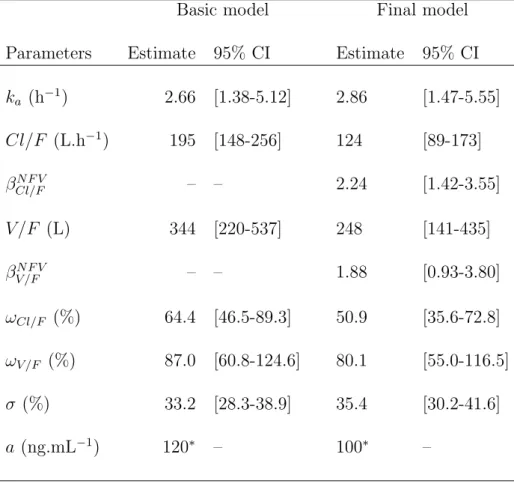
One hundred and thirty three concentration data were obtained from the 27 patients receiving ZDV. Sixteen concentrations were below the quantifition limit (LOQ); fourteen were set to LOQ/2, and the other four were exluded, since they were consecutive to a first concentration found below the quantification limit. The one-compartment model with zero-order absorption and first order elimination achieved the smallest AIC. A combined error model with a fixed to 120 ng/mL was selected. Random effects could be estimated on log(Cl/F ) and log(V /F ). The parameter estimates of the model are displayed in table V. The co-administered PI was the only possibly significant covariate found on both log(Cl/F ) and log(V /F ) during the univari-ate analysis performed on the individual parameters. The model used for Cl/F and V /F was therefore:
Cl/F = 124 × 2.24N F V L.h−1V /F = 248 × 1.88N F V L
where NF V equals 1 if patient received NFV as a part of his treatment, and 0 otherwise. The oral clearance and the oral volume were found to be 124% (p=0.0003) and 88% (p=0.0263) higher, in patients receiving NFV versus IDV as a PI, respectively. Inter-patient variability was found to be 50.9% for log(Cl/F ) and 80.1% for log(V /F ). The predicted curve for the mean PK parameters corresponding to each co-administered PI are overlayed on the observed concentration data of ZDV in Fig. 1.C.
Model evaluation
The goodness-of-fit plots are displayed in Fig. 2. They were satisfactory for the three studied NA. The adequation of the observed concentrations with the simulated 10thand 90thpercentiles and the adequation of the 50th percentile with the median of the observed concentrations are displayed in the log scale in Fig. 3. The model seems to underpredict residual concentrations for STV and ZDV. The percentage of concentrations outside the interval defined by 10th and 90th percentiles were 22.85%, 24.10% and 21.80% for LMV, STV and ZDV, respectively. We considered that these results were close enough to the expected value of 20% to keep the final model for the three NA.
Inter- and intra-patient variability
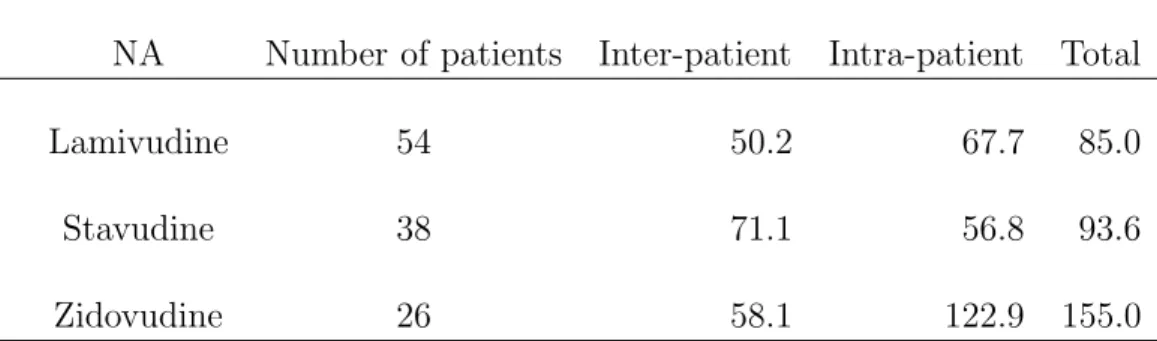
The observed C1hand C3hat the two visits are displayed in Fig. 4. For each NA, the estimates of the inter- and intra-patient coefficient of variation of these concentrations are shown in table VI, together with the coefficient of variation for total variability. Both inter- and intra-patient variabilities were important. Moreover, intra-patient variability was greater than inter-patient variability, except for STV, and was greater than 55% for the three NA. These large variabilities were not expected in patients with sustained virological response, since the exact sampling times and the exact time of drug intake, which took place at the hospital, were known for C1h and C3h.
DISCUSSION
The COPHAR1-ANRS102 study, first designed to study the pharmacokinetics of protease in-hibitors, allowed us to estimate the population PK parameters of three NA, LMV, STV and ZDV, together with their inter-patient variability. Concentration data obtained at a second visit allowed us to estimate the intra-patient variability of concentrations.
Population PK approach for NA has essentially been applied to analyze data obtained in patients treated with mono or bitherapies [15–21]. A first population analysis of all the com-ponents of an antiretroviral treatment was performed in patients receiving a triple combination
of nevirapine plus zidovudine plus didanosine [22], and found a large intra-patient variability (greater than 50%) for ZDV. A population analysis of tenofovir in patients on HAART was also recently performed [23], but did not estimate intra-patient variability. None of these papers proposed reference concentration curves for the studied NA.
We observed a systematic interaction effect of combination with NFV vs IDV for the three drugs. It resulted in lower ZDV concentrations in patients receiving NFV, that may be related to the induction of glucuronidation by NFV via an increase of the activity of glucuronosyltrans-ferase. It also resulted in lower STV concentrations in the NFV group, that may be due to the interaction of NFV on the hepatic enzymes involved in the metabolism of the drug. These results should be taken into account for the choice of ZDV or STV regimens when prescribed in combination with NFV. A decreased exposition to NFV in patients co-medicated with ZDV had also been found in COPHAR1-ANRS102 [7], indicating that precautions should be taken when co-prescribing these two drugs.
For LMV, the increased absorption duration in patients receiving NFV may be partly ex-plained by a food effect. Indeed, patients of the NFV group received a light meal before drug intake. In the IDV group, the 7 patients also receiving ritonavir were fed, whereas the other 17 receiving IDV alone took their medication in fasted conditions. Absorption of LMV has been shown to be slower in fed compared to fasted patients [24, 25], which is in agreement with the increased Ta observed in the NFV group. However, the clinical relevance of this effect and those of BMI and age seem small, since these covariates influence the absorption duration, which has a smaller influence on the AUC. It should be noticed that adherence measured at V1 by the auto-questionnaire was not found to influence significantly the PK parameters of the three NA. We performed the population analysis from concentration data of the first visit only since the model including data from both V1 and V2 could not be fitted using nlme for LMV and STV. We therefore estimated both inter- and intra-patient variability from the observed C1h or C3h measured at two occasions for the three NA. Both variabilities were important for the three drugs, and intra-patient variability is always greater than 55%, resulting in an overall variability of 85% to 155%, even greater than the variability found by Zhou et al. for ZDV [22]. As drug accumulation is very small for the three studied NA, as illustrated by the important
proportion of trough concentrations below the LOQ, and as the exact time of drug intake is know for these measurements, this high intra-patient variability may be essentially due to an important variability of bioavailability, both absorption and presystemic metabolism.
The simulated concentrations used for the graphs of Fig 3 could be used to build reference intervals for NA concentrations. For the three NA, the logarithm of the 5000 concentrations simulated one hour after drug intake was distributed according to a normal distribution, with a variability of 82%, 67% and 61% for LMV, STV and ZDV, respectively. The corresponding whithin-patient variabilities were 67.7%, 56.8% and 122.9% (cf table IV). A reasonable hypoth-esis is to perform TDM only for drug with a within-patient variability of concentrations inferior to the inter-patient variability used to define target concentration intervals. The within-patient variability observed for ZDV would therefore question the interest of TDM for this specific drug. However, results obtained for a single sampling time are not sufficient, and it would be necessary to analyse more complete PK profiles taken at several occasions to be able to better estimate within-patient variability for these three drugs and connect it to safe and effective concentration intervals.
The concentration-effect relationships, that are a prerequisite for TDM [26], have only been demonstrated for some NA, and only when given in monotherapies [27,28]. We could not study these relationships in this trial since all patients had a sustained undetectable viral load. We believe that if all the elements justifying TDM of NA are not available yet, concentration-controlled therapy of the NA composing HAART could be performed. Indeed, Kakuda et al. have already demonstrated the usefulness of this approach for a treatment composed of ZDV, LMV and IDV [4]. Since patients of COPHAR1-ANRS102 achieved sustained virological re-sponse, the 50th percentile curves simulated to evaluate the final model for the three drugs (Fig. 2.) could be used as reference curves for LMV, STV and ZDV in patients. In Western countries, new combinations of nucleoside analogues have appeared since this trial, but the combination of lamivudine plus zidovudine remains largely prescribed, as well as new QD regimens including LMV with either abacavir or tenofovir. LMV, STV and ZDV are still commonly used used all over the world. It is therefore important to have an adequate reference PK profile obtained in patients with sustained virological response for the TDM of these three NA.
Acknowledgements
This study was financially supported by the Agence Nationale de la Recherche sur le SIDA (ANRS), Paris, France.
We gratefully acknowledge all members of the scientific committee of the COPHAR1-ANRS102 trial: Prof V. Calvez (Hˆopital Piti´e-Salp´etri`ere, Paris), Prof G. Chˆene (INSERM U330, Bor-deaux), Prof B. Diquet (Hˆopital Salp´etri`ere, Paris), Prof C. Katlama (Hˆopital Piti´e-Salp´etri`ere, Paris), Prof C. Leport (Hˆopital Bichat, Paris), Mrs A. Metro (ANRS, Paris), Dr G. Peytavin (Hˆopital Bichat, Paris), Prof F. Raffi (Hˆopital Hˆotel Dieu, Nantes), Dr A. Roux (Hˆopital Ambroise Par´e, Boulogne), and Prof D. Salmon-Ceron (Hˆopital Cochin, Paris). We would like to thank the investigators in the clinical centres for including patients: J.M. Es-tavoyer, R. Laurent (Besan¸con), X. Bazin (Caen), C. Perrone (Garches), J.F. Delfraissy (Krem-lin Bicˆetre), F. Raffi (Nantes), E. Bouvet, F. Bricaire, S. Herson, W. Rozenbaum, D. S´er´eni, D. Sicard, A. Simon, J.L. Vild´e (Paris), X. Lang (Strasbourg), and the pharmacological labo-ratories for performing drug assays: B. Royer, P. Muret (Besan¸con), M. Tod (Bobigny), A.M. Taburet (Kremlin Bicˆetre), C. Solas (Marseille), D. Hillaire (Montpellier), E. Dailly (Nantes), B. Diquet, G. Peytavin, J.M. Poirier, E. Rey, H. Sauvageon (Paris), J.C. Alvarez (Versailles). We also thank the patients for their participation.
References
[1] Stretcher B. Pharmacokinetic optimisation of antiretroviral therapy in patients with HIV infection. Clin Pharmacokinet 1995; 29(1):46–65
[2] Hoetelmans R, Burger D, Meenhorst P, Beijnen J. Pharmacokinetic individualisation of zidovudine therapy. Current state of pharmacokinetic-pharmacodynamic relationships. Clin Pharmacokinet 1996; 30(4):314–27
[3] Fletcher C, Acosta E, Henry K, Page L, Gross C, Kawle S, Remmel R, Erice A, Balfour H. Concentration-controlled zidovudine therapy. Clin Pharmacol Ther 1998; 64(3):331–8 [4] Kakuda T, Page L, Anderson P, Henry K, Schacker T, Rhame F, Acosta E, Brundage R, Fletcher C. Pharmacological basis for concentration-controlled therapy with zidovudine, lamivudine, and indinavir. Antimicrob Agents Chemother 2001; 45(1):236–42
[5] Goujard C, Legrand M, Panhard X, Diquet B, Duval X, Peytavin G, Vincent I, Katlama C, Leport C, Bonnet B, Salmon-C´eron D, Mentr´e F, Taburet A, the COPHAR1 ANRS 102 Study Group. High variability of indinavir and nelfinavir pharmacokinetics in hiv-infected patients with a sustained virological response on haart. Clin Pharmacokinet 2005; 44(12):1267–78
[6] Brendel K, Legrand M, Taburet A, Baron G, Goujard C, Mentr´e F, the Cophar 1-ANRS 102 Trial Group. Population pharmacokinetic analysis of indinavir in HIV-infected patient treated with a stable antiretroviral therapy. Fundam Clin Pharmacol 2005; 19(3):373–83 [7] Panhard X, Goujard C, Legrand M, Taburet A, Diquet B, Mentr´e F, study group CA.
Population pharmacokinetic analysis for nelfinavir and its metabolite M8 in virologically controlled HIV-infected patients on HAART. Br J Clin Pharmacol 2005; 60(4):390–403 [8] Spire B, Duran S, Souville M, Leport C, Raffi F, Moatti J, the APROCO cohort study
group. Adherence to highly active antiretroviral therapies (HAART) in HIV-infected pa-tients: from a predictive to a dynamic approach. Soc Sci Med 2002; 54(10):1481–96 [9] Aymard G, Legrand M, Trichereau N, Diquet B. Determination of twelve antiretroviral
agents in human plasma sample using reversed-phase high-performance liquid chromatog-raphy. J Chromatogr B Biomed Sci Appl 2000; 744(2):227–40
[10] Beal S. Ways to fit a PK model with some data below the quantification limit. J Phar-macokinet Pharmacodyn 2001; 28(5):481–504
[11] Lindstrom M, Bates D. Nonlinear mixed effects models for repeated measures data. Bio-metrics 1990; 46(3):673–87
[12] Pinheiro J, Bates D. Mixed-effect models in S and Splus. Springer-Verlag, New York 2000 [13] R Development Core Team. R: A language and environment for statistical computing. R
Foundation for Statistical Computing, Vienna, Austria 2005
[14] Akaike H. Statistical predictor identification. Ann Inst Statist Math 1973; 22:203–217 [15] Gitterman S, Drusano G, Egorin M, Standiford H. Population pharmacokinetics of
zi-dovudine. The Veterans Administration Cooperative Studies Group. Clin Pharmacol Ther 1990; 48(2):161–7
[16] Mentr´e F, Escolano S, Diquet B, Golmard J, Mallet A. Clinical pharmacokinetics of zidovudine: inter and intraindividual variability and relationship to long term efficacy and toxicity. Eur J Clin Pharmacol 1993; 45(5):397–407
[17] Horton C, Dudley M, Kaul S, Mayer K, Squires K, Dunkle L, Anderson R. Population pharmacokinetics of stavudine (d4T) in patients with AIDS or advanced AIDS-related complex. Antimicrob Agents Chemother 1995; 39(10):2309–15
[18] Harb G, Mandema J, Delahunty T, Benowitz N, Coleman R, Sheiner L, Jacobson M. Population pharmacokinetics of didanosine in patients with human immunodeficiency virus infection. J Infect Dis 1996; 173(1):273
[19] Adams J, Shelton M, Hewitt R, DeRemer M, DiFrancesco R, Grasela T, Morse G. Zalcitabine population pharmacokinetics: application of radioimmunoassay. Antimicrob Agents Chemother 1998; 42(2):409–13
[20] Moore K, Yuen G, Hussey E, Pakes G, Eron J, Bartlett J. Population pharmacokinetics of lamivudine in adult human immunodeficiency virus-infected patients enrolled in two phase III clinical trials. Antimicrob Agents Chemother 1999; 43(12):3025–9
[21] Weller S, Radomski K, Lou Y, Stein D. Population pharmacokinetics and pharmaco-dynamic modeling of abacavir (1592U89) from a dose-ranging, double-blind, random-ized monotherapy trial with human immunodeficiency virus-infected subjects. Antimicrob Agents Chemother 2000; 44(8):2052–60
[22] Zhou X, Sheiner L, D’Aquila R, Hughes M, Hirsch M, Fischl M, Johnson V, Myers M, Sommadossi J. Population pharmacokinetics of nevirapine, zidovudine, and didanosine in human immunodeficiency virus-infected patients. The National Institute of Allergy and Infectious Diseases AIDS Clinical Trials Group Protocol 241 Investigators. Antimicrob Agents Chemother 1999; 43(1):121–8
[23] Jullien V, Tr´eluyer J, Rey E, Jaffray P, Krivine A, Moachon L, Louet ALL, Lescoat A, Dupin N, Salmon D, Pons G, Urien S. Population pharmacokinetics of tenofovir in hu-man immunodeficiency virus-infected patients taking highly active antiretroviral therapy. Antimicrob Agents Chemother 2005; 49(8):3361–6
[24] Angel J, Hussey E, Hall S, Donn K, Morris D, McCormack J, Montaner J, Ruedy J. Phar-macokinetics of 3TC (GR109714X) administered with and without food to HIV-infected patients. Drug Invest 1993; 6(2):70–74
[25] Moore K, Shaw S, Laurent A, Lloyd P, Duncan B, Morris D, O’Mara M, Pakes G. Lamivu-dine/zidovudine as a combined formulation tablet: bioequivalence compared with lamivu-dine and zidovulamivu-dine administered concurrently and the effect of food on absorption. J Clin Pharmacol 1999; 39(6):593–605
[26] Aarnoutse RE, Schapiro JM, Boucher CAB, Hekster YA, Burger DM. Therapeutic drug monitoring: an aid to optimising response to antiretroviral drugs? Drugs 2003; 63(8):741– 53
[27] Drusano G, Yuen G, Lambert J, Seidlin M, Dolin R, Valentine F. Relationship between dideoxyinosine exposure, CD4 counts, and p24 antigen levels in human immunodeficiency virus infection. A phase I trial. Ann Intern Med 1992; 116(7):562–6
[28] Sasomsin P, Mentr´e F, Diquet B, Simon F, Brun-Vezinet F. Relationship between exposure to zidovudine and decrease of P24 antigenemia in HIV-infected patients in monotherapy. Fundam Clin Pharmacol 2002; 16(5):347–52
Legends for figures
Fig 1: Observed concentrations of LMV (A), STV (B) and ZDV (C) and curve predicted for the fixed effects for patients comedicated with IDV (dashed line) and NFV (solid line). Two concentrations greater than 2000 ng/mL are not displayed for STV.
Fig 2: Goodness of fit plots for the final model for LMV (A), STV (B) and ZDV (C): population predicted concentrations versus observed concentrations, individual predicted con-centrations versus observed concon-centrations and population weighted residuals versus population predicted concentrations.
Fig 3: Evaluation of the final model: comparison between the 10th, 50th (solid line) and 90th percentiles for the 1000 simulations for patients receiving LMV (A), STV (B) and ZDV (C) with the observed data and the median of the observed concentrations measured at 0.5, 1, 3 and 6 hours, and between 10 and 14h for the trough sample (dark grey rectangles and dark grey line). Two concentrations greater than 2000 ng/mL are not displayed for STV.
Fig 4: Variability of the concentrations observed 1 hour (C1h, ◦ and dotted line) and 3 hours (C3h, • and full line) after drug administration between the two visits (V1 and V2) in patients receiving LMV (A), STV (B) and ZDV (C).
Tables
Table I. Characteristics at baseline of the 88 studied patients with sustained virological response.
Median [range]
Sex (Male/Female) 73/15
Age (years) 41 [21-66]
Weight (kg)∗ 70 [41-110]
BMI (kg.m−2)∗∗ 23 [16-40]
Time since first ARV treatment (years) 4.0 [0.8-11.7]
CD4 cell count (mm−3) 516 [150-1425] PI prescribed Indinavir 42 Nelfinavir 46 NA combinations Lamivudine + Stavudine 31 Lamivudine + Zidovudine 25 Didanosine + Stavudine 16 Lamivudine + Didanosine 3 Lamivudine + Abacavir 1 Didanosine + Abacavir 1 Zidovudine + Didanosine 1 0, 1 or 2 NA + Nevirapine 6 1 NA + Efavirenz 3 Adherence (High/Moderate/Low)∗ 49/31/3
∗ Five missing values ∗∗ Eight missing values
Table II. Repartition of patients treated with LMV, STV or ZDV between the two PI groups. PI
NA Indinavir Nelfinavir
Alone With ritonavir
LMV 17 7 30
STV 9 5 25
Table III. Population pharmacokinetic parameters of LMV and 95% confidence intervals.
Basic model Final Model
Parameters Estimate 95% CI Estimate 95% CI
Ta (h) 1.09 [0.84-1.42] 1.46 [1.04-2.04] βN F V Ta – – 0.605 [0.374-0.979] βBM I Ta – – 0.896 [0.834-0.964] βTAgea – – 1.03 [1.01-1.06] k (h−1) 0.213 [0.192-0.237] 0.22 [0.19-0.24] V /F (L) 147 [122-177] 145 [120-174] ωTa (%) 76.0 [57.7-100.3] 63.7 [46.5-87.3] ωV /F (%) 52.3 [40.3-67.9] 52.1 [40.1-67.7] σ (%) 37.6 [29.0-48.9] 36.1 [27.6-47.1] a (ng.mL−1) 99.1 [38.3-256.1] 108.2 [42.9-272.9]
Table IV. Population pharmacokinetic parameters of STV and 95% confidence intervals.
Basic model Final Model
Parameters Estimate 95% CI Estimate 95% CI
ka (h−1) 0.455 [0.303-0.683] 0.452 [0.311-0.656] Cl/F (L.h−1) 21.0 [15.9-27.7] 15.9 [10.4-24.4] βN F V Cl/F – – 1.56 [0.91-2.67] V /F (L) 24.9 [14.0-44.3] 23.9 [13.4-42.6] ωCl/F (%) 79.7 [61.2-103.8] 74.0 [57.1-96.0] ωV /F (%) 64.6 [36.6-114.1] 80.6 [50.5-128.7] σ (%) 37.0 [31.6-43.4] 37.7 [32.7-43.4] a (ng.mL−1) 120∗ – 110∗ – ∗ Fixed
Table V. Population pharmacokinetic parameters of ZDV and 95% confidence intervals.
Basic model Final model
Parameters Estimate 95% CI Estimate 95% CI
ka (h−1) 2.66 [1.38-5.12] 2.86 [1.47-5.55] Cl/F (L.h−1) 195 [148-256] 124 [89-173] βN F V Cl/F – – 2.24 [1.42-3.55] V /F (L) 344 [220-537] 248 [141-435] βN F V V /F – – 1.88 [0.93-3.80] ωCl/F (%) 64.4 [46.5-89.3] 50.9 [35.6-72.8] ωV /F (%) 87.0 [60.8-124.6] 80.1 [55.0-116.5] σ (%) 33.2 [28.3-38.9] 35.4 [30.2-41.6] a (ng.mL−1) 120∗ – 100∗ – ∗ Fixed
Table VI. Estimated inter-patient, intra-patient and total variabilities (in CV%) for LMV, STV and ZDV concentrations measured 1 hour or 3 hours after observed drug intake on two occasions.
Variability (%)
NA Number of patients Inter-patient Intra-patient Total
Lamivudine 54 50.2 67.7 85.0
Stavudine 38 71.1 56.8 93.6
a
0 5 10 15 0 500 1000 1500 2000 Time (h) LMV concentration (ng/mL)b
0 5 10 15 0 500 1000 1500 2000 Time (h) STV concentration (ng/mL)c
0 5 10 15 0 500 1000 1500 2000 Time (h) ZDV concentration (ng/mL) F ig 1 25a
0 500 1500 0 500 1000 1500 2000 2500 3000 LMV observed concentrationsLMV population predicted concentrations
0
500
1500
0 500 1000 1500 2000 2500 3000
LMV observed concentrations
LMV individual predicted concentrations
200
600
1000
−2 −1 0 1 2
LMV population predicted concentrations Weighted residuals
b
0 500 1000 2000 0 500 1000 1500 2000 STV observed concentrationsSTV population predicted concentrations
0 500 1000 2000 0 500 1000 1500 2000 STV observed concentrations
STV individual predicted concentrations
0 100 200 300 400 −2 −1 0 1 2
STV population predicted concentrations Weighted residuals
c
0 500 1500 2500 0 500 1000 1500 2000 2500 3000 LMV observed concentrationsLMV population predicted concentrations
0 500 1500 2500 0 500 1000 1500 2000 2500 3000 LMV observed concentrations
LMV individual predicted concentrations
200
600
1000
−2 −1 0 1 2
LMV population predicted concentrations Weighted residuals
F
ig
2