Workload Characterization of JVM Languages
Doctoral Dissertation submitted to the
Faculty of Informatics of the Università della Svizzera Italiana in partial fulfillment of the requirements for the degree of
Doctor of Philosophy
presented by
Aibek Sarimbekov
under the supervision of
Prof. Walter Binder
Dissertation Committee
Prof. Matthias Hauswirth Università della Svizzera Italiana, Switzerland Prof. Cesare Pautasso Università della Svizzera Italiana, Switzerland Prof. Andreas Krall Technische Universität Wien, Vienna, Austria Prof. Petr T˚uma Charles University, Prague, Czech Republic
Dissertation accepted on 9 May 2014
Prof. Walter Binder Research Advisor
Università della Svizzera Italiana, Switzerland
Prof. Stefan Wolf and Prof. Igor Pivkin PhD Program Director
I certify that except where due acknowledgement has been given, the work pre-sented in this thesis is that of the author alone; the work has not been submitted previously, in whole or in part, to qualify for any other academic award; and the content of the thesis is the result of work which has been carried out since the official com-mencement date of the approved research program.
Aibek Sarimbekov Lugano, 9 May 2014
To my family
Everything should be made as simple as possible, but not simpler.
Albert Einstein
Abstract
Being developed with a single language in mind, namely Java, the Java Virtual Machine (JVM) nowadays is targeted by numerous programming languages. Automatic memory management, Just-In-Time (JIT) compilation, and adaptive optimizations provided by the JVM make it an attractive target for different language implementations. Even though being targeted by so many languages, the JVM has been tuned with respect to characteristics of Java programs only – different heuristics for the garbage collector or compiler optimizations are focused more on Java programs. In this dissertation, we aim at contributing to the understanding of the workloads imposed on the JVM by both dynamically-typed and statically-typed JVM languages. We introduce a new set of dynamic metrics and an easy-to-use toolchain for collecting the latter. We apply our toolchain to applications written in six JVM languages – Java, Scala, Clojure, Jython, JRuby, and JavaScript. We identify differences and commonalities between the examined languages and discuss their implications. Moreover, we have a close look at one of the most efficient compiler optimizations – method inlining. We present the decision tree of the HotSpot JVM’s JIT compiler and analyze how well the JVM performs in inlining the workloads written in different JVM languages.
Acknowledgements
First of all I would like to thank my research adviser Professor Walter Binder who guided me for the past four years through this interesting journey called Ph.D. I am also grateful for my committee members including Professor Andreas Krall, Professor Petr T˚uma, Professor Cesare Pautasso, and Professor Matthias Hauswirth, your valuable comments helped me a lot to strengthen this dissertation.
I would like to thank all the past and present members of the Dynamic Analysis Group with whom I had a pleasure to work with during my Ph.D at University of Lugano: Philippe, Danilo, Akira, Alex, Achille, Stephen, Yudi, Lukáš, Lubomír, Andrej, Sebastiano, Andrea – you guys are awesome!
I am thankful to my collaborators and co-authors from different parts of the world: Danilo Ansaloni, Walter Binder, Christoph Bockisch, Eric Bodden, Lubomír Bulej, Samuel Z. Guyer, Kardelen Hatun, Stephen Kell, Lukáš Marek, Mira Mezini, Philippe Moret, Zhengwei Qi, Nathan P. Ricci, Martin Schoeberl, Andreas Sewe, Lukas Stadler, Petr T˚uma, Alex Villazón, Yudi Zheng. In particular I am grateful to Andreas Sewe, whose energy and motivation still impresses me. Thank you Andreas for all your help and support throughout my Ph.D.
Elisa, Janine, Danijela and Diana from the decanato office deserve special thanks for their support and help with numerous bookings and registration stuff. I cannot find the words to thank you.
Maksym and Konstantin I will miss a lot our discussions during the lunches and coffee breaks, however, I am more than sure that our friendship will last for good.
And finally I would like to thank my family that keeps supporting me in my every venture. This work is dedicated to every member of my family.
This work was partially funded by Swiss National Science Foundation (project CRSII2_136225).
Contents
Contents xi
1 Introduction 1
1.1 Motivation . . . 1
1.2 Contributions . . . 3
1.2.1 Toolchain for Workload Characterization . . . 3
1.2.2 Rapid Development of Dynamic Program Analysis Tools . . . 3
1.2.3 Workload Characterization of JVM Languages . . . 4
1.3 Dissertation Outline . . . 4
1.4 Publications . . . 5
2 State of the Art 9 2.1 Overview . . . 9
2.2 Feedback-Directed Optimizations . . . 9
2.3 Workload Characterization . . . 10
2.4 Programming Languages Comparison . . . 13
2.5 Instrumentation . . . 14
2.5.1 Binary Instrumentation . . . 14
2.5.2 Bytecode Instrumentation . . . 15
3 Rapid Development of Dynamic Program Analysis Tools 19 3.1 Motivation . . . 19
3.2 Background: DiSL Overview . . . 21
3.3 Quantifying the Impact of DiSL . . . 23
3.3.1 Experiment Design . . . 23
3.3.2 Task Design . . . 26
3.3.3 Subjects and Experimental Procedure . . . 26
3.3.4 Variables and Analysis . . . 27
3.3.5 Experimental Results . . . 28
3.3.6 Threats to Validity . . . 29
3.4 DiSL Tools Are Concise and Efficient . . . 31
3.4.1 Overview of Recasted Analysis Tools . . . 31 xi
xii Contents
3.4.2 Instrumentation Conciseness Evaluation . . . 34
3.4.3 Instrumentation Performance Evaluation . . . 36
3.5 Summary . . . 39
4 Toolchain for Workload Characterization 41 4.1 Dynamic Metrics . . . 41
4.1.1 Object access concerns . . . 42
4.1.2 Object allocation concerns . . . 44
4.1.3 Code generation concerns . . . 46
4.2 Toolchain Description . . . 48
4.2.1 Deployment and Use . . . 48
4.2.2 Query-based Metrics . . . 50
4.2.3 Instrumentation . . . 51
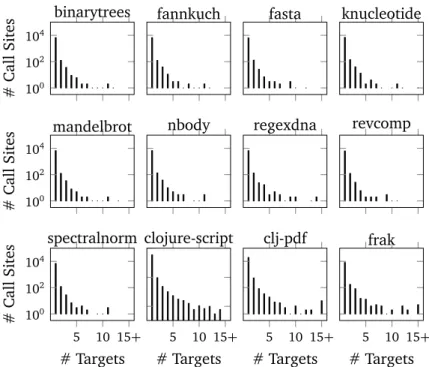
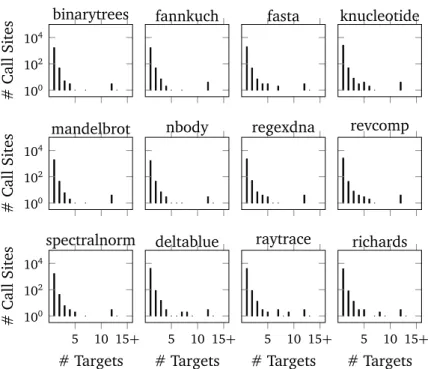
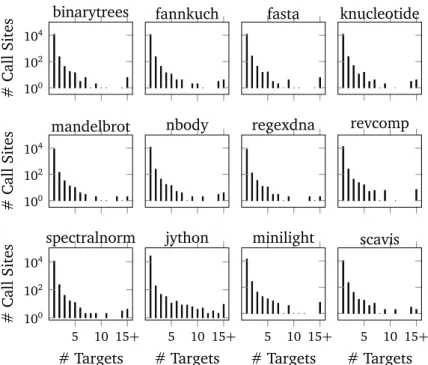
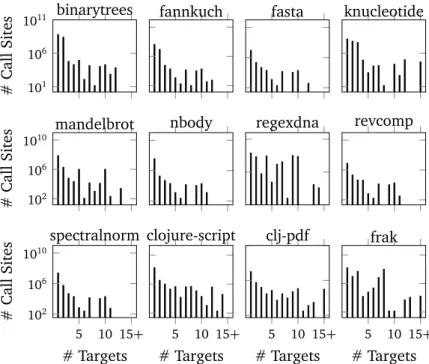
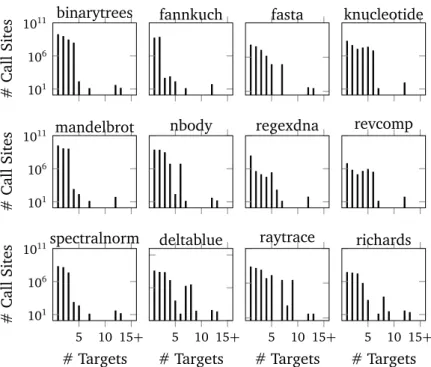
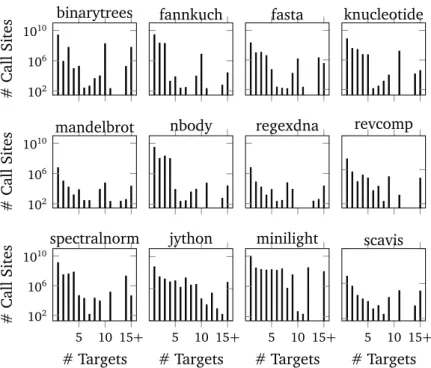
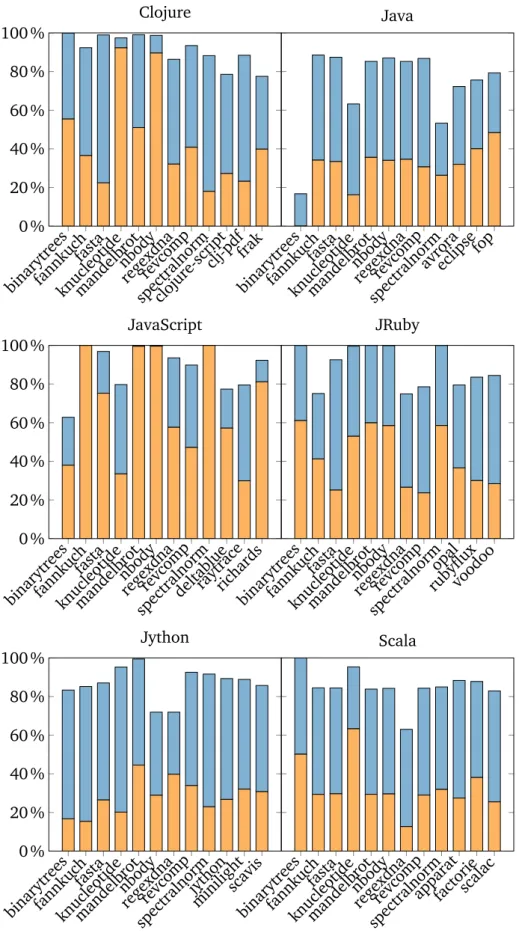
5 Workload Characterization of JVM Languages 53 5.1 Experimental Setup . . . 53 5.1.1 Examined Metrics . . . 53 5.1.2 Workloads . . . 54 5.1.3 Measurement Context . . . 55 5.2 Experiment Results . . . 55 5.2.1 Call-site Polymorphism . . . 55
5.2.2 Field, Object, and Class Immutability . . . 64
5.2.3 Identity Hash-code Usage . . . 68
5.2.4 Unnecessary Zeroing . . . 70
5.2.5 Object Lifetimes . . . 72
5.3 Inlining in the JVM . . . 77
5.3.1 Inlining Decision . . . 77
5.3.2 Top Reasons for Inlining Methods . . . 80
5.3.3 Top Reasons for Not Inlining Methods . . . 83
5.3.4 Inlining Depths . . . 85
5.3.5 Fraction of Inlined Methods . . . 89
5.3.6 Fraction of Decompiled Methods . . . 91
5.3.7 Summary . . . 93
6 Conclusions 95 6.1 Summary of Contributions . . . 96
6.2 Future Work . . . 97
Chapter 1
Introduction
1.1
Motivation
Modern applications have brought about a paradigm shift in software development. With different application parts calling for different levels of performance and produc-tivity, developers use different languages for the various tasks at hand. Very often, core application parts are written in a statically-typed languages, data management uses a suitable domain-specific language (DSL), and the glue code that binds all the pieces together is written in a dynamically-typed language. This development style is called
polyglot programming, and promotes using the right language for a particular task[90]. This shift has gained support even in popular managed runtimes such as the .NET Common Language Runtime and the Java Virtual Machine (JVM), which are mainly known for automatic memory management, high performance through Just-In-Time (JIT) compilation and optimization, and a rich class library. In case of the JVM, the in-troduction of scripting support (JSR-223) and support for dynamically-typed languages (JSR-292) to the Java platform enables scripting in Java programs and simplifies the development of dynamic language runtimes. Consequently, developers of literally hun-dreds of programming languages target the JVM as the host for their language—both to avoid developing a new runtime from scratch, and to benefit from the JVM’s maturity, ubiquity, and performance. Today, programs written in popular dynamic languages such as JavaScript, Ruby, Python, or Clojure (a dialect of Lisp) can be run on the JVM, creating an ecosystem that boosts developer productivity.
Even though being targeted by so many languages, the JVM was originally designed with a single language in mind, namely Java, and therefore was tuned with respect to characteristics of Java programs only. Dynamically-typed languages such as Clojure, Groovy, JRuby, and Jython suffered from performance problems until recently. Some of them have been addressed with introduction of theinvokedynamicbytecode in Java 7,
intended to improve performance of dynamic JVM languages. However, it did not result in significant performance benefits[116]. To gain performance when repurposing
2 1.1 Motivation
an existing JIT compiler for dynamically-typed languages, compiler developers are encouraged to specialize the generic execution (inherent to such languages) as much as possible, instead of overly relying on the original JIT to gain performance[25].
Making the JVM perform well with various statically- and dynamically-typed lan-guages clearly requires significant effort, not only in optimizing the JVM itself, but also, more importantly, in optimizing the bytecode-emitting language compilers. This in turn requires that developers of both the language compilers and the JVM need to understand the characteristics of the workloads imposed by various languages or compilation strategies on the JVM. Therefore, the research question of this dissertation is:
What are the differences in the workloads imposed on the JVM by different pro-gramming languages?
In order to answer stated research question, we require the means of characterizing the full range of workloads on the JVM, including applications written in different JVM languages. Two classes of artifacts are useful for workload characterization: benchmarks and metrics. The former draw representative samples from the space of application code, while the latter identify useful performance dimensions within their behaviour. Whereas benchmarking shows how well a system performs at different tasks, metrics show in what way these tasks differ from each other, providing essential guidance for optimization effort.
Ideally, metrics should capture the differing properties both of Java and non-Java workloads and should provide useful information for developers of JVM languages and JVM implementers. For example, a developer might hypothesize that a workload performed poorly because of heap pressure generated by increased usage of boxed primitive values, which are used relatively rarely in normal Java code, but frequently in some other JVM languages such as in JRuby. Developers could optimize their bytecode generator, for example, to try harder at using primitives in their unboxed form. A dynamic metric of boxing behaviour would allow these developers to quantify the effects of such optimizations.
Meanwhile, JVM developers may also benefit from the metrics, but in a rather different way. JVM optimizations are dynamic and adaptive. Each optimization decision is guarded by a heuristic decision procedure applied to profile data collected at runtime. For example, the decision whether to inline a callee into a fast path depends on factors such as the hotness of that call site (evaluated by dynamic profiling) and the size of the callee. JVMs can therefore benefit from better heuristics which more accurately match real workloads, including non-Java workloads.
3 1.2 Contributions
1.2
Contributions
Answering the research question of this dissertation requires versatile research that has to address several needs: (i) the need for tools to perform workload characterization; (ii) the need to rapidly develop those tools; (iii) the actual characterization of different
kinds of workloads on the JVM.
1.2.1
Toolchain for Workload Characterization
Dynamic program analysis tools support different software engineering tasks, including profiling[15, 69], debugging [6, 26, 44, 132], and program comprehension [84, 104]. Identifying the intrinsic and differing properties of different JVM workloads can be achieved also by means of dynamic program analysis tools.
There are several approaches serving workload characterization, however, no exist-ing work has defined a comprehensive set of metrics and provided the tools to compute them. Rather, existing approaches are fragmented across different infrastructures: many lack portability by using a modified version of the JVM[38, 74], while others collect only architecture-dependent metrics[114]. In addition, at least one well-known metric suite implementation[41] runs with unnecessarily high performance overhead. Ideally, metrics should be collected within reasonable time, since this enables the use of com-plex, real-world workloads and shortens the development cycles. Metrics should also be computed based on observation of the whole workload, which not all infrastructures allow. For example, existing metrics collected using AspectJ are suboptimal since they lack coverage of code from the Java class library[19, 27, 94].
We present our approach which bases all metrics on a unified infrastructure which is JVM-portable, offers non-prohibitive runtime overhead with near-complete bytecode coverage, and can compute a full suite of metrics “out of the box”. Among the metrics of interest to be collected by our toolchain are object allocations, method and basic block hotness, the degree of call-site polymorphism, stack usage and recursion, instruction mix, use of immutability and synchronization, amount of unnecessary zeroing, and use of hash codes.
1.2.2
Rapid Development of Dynamic Program Analysis Tools
All the tools from our toolchain rely on bytecode instrumentation, which is usually performed by means of low-level libraries such as BCEL[124], ASM [91], Soot [127], Shrike[66], or Javassist [28]. However, even with those libraries, bytecode instru-mentation is an error-prone task and requires advanced expertise from the developers. Due to the low-level nature of the Java bytecode, the resulting code is often verbose, complex, and difficult to maintain or to extend.
The complexity associated with manipulating Java bytecode can be sometimes avoided by using aspect-oriented programming (AOP)[70] to implement the
instrumen-4 1.3 Dissertation Outline
tation. This is possible because AOP provides a high-level abstraction over predefined points in program execution (join points) and allows inserting code (advice) at a declar-atively specified set of join points (pointcuts). Tools like the DJProf profiler[94], the RacerAJ data race detector[19], or the Senseo Eclipse plugin for augmenting static source views with dynamic metrics[104] are examples of successful applications of this approach.
Having many choices for performing bytecode instrumentation, developers face a hard time of choosing the proper instrumentation framework that allows rapid development of efficient dynamic program analysis tools. To the best of our knowledge, no such quantification is present in the literature concerning instrumentation of Java programs. We address this problem by performing a thorough empirical evaluation: (i) we conduct a controlled experiment to determine which bytecode instrumentation framework increases developer productivity; (ii) we collect different performance and source-code metrics for recasts of ten open-source dynamic program analysis tools in order to find out which framework allows development of efficient dynamic program analysis tools.
1.2.3
Workload Characterization of JVM Languages
Recently, dynamic languages gained a lot of attention due to their flexibility and ease of use. While originally designed for scripting purposes only (e.g., for text processing or for glueing together different components in a large system), they are currently used as general-purpose programming languages along with statically typed ones. After introducing scripting support (JSR-223) and support for dynamically-typed languages (JSR-292), the JVM has become an attractive environment for developers of new dynamic programming languages. However, the JVM appeared two decades ago with a single language in mind and was build specifically for running Java applications; therefore, its heuristics were tuned for efficiently running Java applications. The question whether workloads written in a non-Java language run efficiently on the JVM remains open.
In this dissertation we perform a thorough workload characterization of popular JVM languages such as Java, Clojure, JRuby, Jython, JavaScript, and Scala. We collect numerous bytecode-level metrics and discuss their implications. Moreover, we shed a light on the most efficient compiler optimization, namely method inlining, and identify whether the JVM handles workloads written in different JVM languages equally well as Java workloads.
1.3
Dissertation Outline
5 1.4 Publications
• Chapter 2 discusses the state of the art in the area of workload characterization. It gives an overview of the existing techniques and discusses their limitations. The chapter also discusses bytecode and binary instrumentation techniques that are usually used in the the area of dynamic program analysis. Finally, it gives an overview of studies that compare programming languages.
• Chapter 3 introduces a user study on three popular frameworks for performing bytecode instrumentation. It presents a controlled experiment which aims at identifying a framework that boosts developer productivity. The chapter also presents a second case study, empirical evaluation of the recasts of instrumentation parts of ten existing open-source dynamic program analysis tools.
• Chapter 4 focuses on our toolchain for collecting various dynamic metrics. It gives an overview of the metrics that can be collected by our toolchain, together with a detailed description of the techniques for collecting the metrics.
• Chapter 5 presents the study – workload characterization of six different JVM languages (Clojure, Java, JavaScript, JRuby, Jython, and Scala). The chapter presents the results of applying our toolchain to workloads written in the exam-ined languages and discusses the collected metrics.
• Chapter 6 concludes the dissertation and outlines future research directions opened by this work.
1.4
Publications
This dissertation is based on several published and submitted work. The empirical evaluation of different instrumentation frameworks (Chapter 3) was published in:
• Aibek Sarimbekov, Yudi Zheng, Danilo Ansaloni, Lubomír Bulej, Lukáš Marek, Wal-ter Binder, Petr T˚uma, and Zhengwei Qi. Dynamic Program Analysis – Reconciling Developer Productivity and Tool Performance. Science of Computer Programming., 2014.
• Aibek Sarimbekov, Yudi Zheng, Danilo Ansaloni, Lubomír Bulej, Lukáš Marek, Walter Binder, Petr T˚uma, and Zhengwei Qi. Productive Development of Dynamic Program Analysis Tools with DiSL. In Proceedings of 22nd Australasian Software
Engineering Conference (ASWEC), pp. 11–19. Melbourne, Australia, 2013. The description of the toolchain and new dynamic metrics (Chapter 4) was published in:
• Aibek Sarimbekov, Andreas Sewe, Stephen Kell, Yudi Zheng, Walter Binder, Lubomír Bulej, and Danilo Ansaloni. A comprehensive toolchain for workload
6 1.4 Publications
characterization across JVM languages. In Proceedings of the 11th Workshop on
Program Analysis for Software Tools and Engineering (PASTE), pp. 9–16. Seattle, Washington, 2013.
The work on the calling context profiler JP2 and on its applicability (Chapter 4) was published in:
• Aibek Sarimbekov, Andreas Sewe, Walter Binder, Philippe Moret, and Mira Mezini. JP2: Call-site Aware Calling Context Profiling for the Java Virtual Machine. Science
of Computer Programming.79:146–157, 2014.
• Aibek Sarimbekov, Walter Binder, Philippe Moret, Andreas Sewe, Mira Mezini, and Martin Schoeberl. Portable and Accurate Collection of Calling-Context-Sensitive Bytecode Metrics for the Java Virtual Machine. In Proceedings of the
9th International Conference on the Principles and Practice of Programming in Java (PPPJ), pp. 11–20, Kongens Lyngby, Denmark, 2011.
• Aibek Sarimbekov, Philippe Moret, Walter Binder, Andreas Sewe, and Mira Mezini. Complete and Platform-Independent Calling Context Profiling for the Java Virtual Machine. In Proceedings of the 6th Workshop on Bytecode Semantics, Verification,
Analysis and Transformation (BYTECODE), pp. 61–74. Saarbrucken, Germany, 2011.
• Aibek Sarimbekov, Walter Binder, Andreas Sewe, Mira Mezini, and Alex Villazón. JP2 – Collecting Dynamic Bytecode Metrics in JVMs. In Proceedings of the
Con-ference Companion on Object-Oriented Programming, Systems, Languages, and Applications (OOPSLA), pp. 35–36, Portland, Oregon, 2011.
The work on workload characterization of different JVM languages (Chapter 5) was published in (or is under review in):
• Aibek Sarimbekov, Lukas Stadler, Lubomír Bulej, Andreas Sewe, Andrej Podzimek, Yudi Zheng, and Walter Binder. Workload Characterization of JVM Languages. Currently under review in Software: Practice and Experience, 2014.
• Aibek Sarimbekov, Andrej Podzimek, Lubomír Bulej, Yudi Zheng, Nathan Ricci, and Walter Binder. Characteristics of dynamic JVM languages. In Proceedings
of the 7th Workshop on Virtual Machines and Intermediate Languages (VMIL), pp. 11–20. Indianapolis, Indiana, 2013.
• Andreas Sewe, Mira Mezini, Aibek Sarimbekov, Danilo Ansaloni, Walter Binder, Nathan P. Ricci, and Samuel Z. Guyer. new Scala() instance of Java: a comparison of the memory behaviour of Java and Scala programs. In Proceedings of
Interna-tional Symposium of Memory Managment (ISMM), pp. 97–108, Beijing, China, 2012.
7 1.4 Publications
• Andreas Sewe, Mira Mezini, Aibek Sarimbekov, and Walter Binder. Da Capo con Scala: Design and Analysis of a Scala Benchmark Suite for the Java Virtual Ma-chine. In Proceedings of the Conference on Object-Oriented Programming, Systems,
Languages, and Applications (OOPSLA), pp. 657–676, Portland, Oregon, 2011. During my Ph.D. studies I was also involved in other projects that resulted in the following publications:
• Lukáš Marek, Yudi Zheng, Danilo Ansaloni, Lubomír Bulej, Aibek Sarimbekov, Walter Binder and Petr T˚uma. Introduction to Dynamic Program Analysis with DiSL. Science of Computer Programming, 2014.
• Aibek Sarimbekov. Comparison of Instrumentation Techniques for Dynamic Program Analysis. In Proceedings of 12th International Conference Companion on
Aspect-oriented Software Development (AOSD), pp. 31–32, Fukuoka, Japan, 2013. • Lukáš Marek, Stephen Kell, Yudi Zheng, Lubomír Bulej, Walter Binder, Petr T˚uma, Danilo Ansaloni, Aibek Sarimbekov, and Andreas Sewe. ShadowVM: Robust and Comprehensive Dynamic Analysis for the Java Platform. In Proceedings of
12th International Conference on Generative Programming: Concepts & Experiences (GPCE), pp. 105–114, Indianapolis, Indiana 2013.
• Lukáš Marek, Yudi Zheng, Danilo Ansaloni, Lubomír Bulej, Aibek Sarimbekov, Walter Binder, and Zhengwei Qi. Introduction to Dynamic Program Analysis with DiSL. In Proceedings of 4th International Conference on Performance Engineering,
(ICPE), pp. 429–430, Prague, Czech Republic, 2013.
• Danilo Ansaloni, Walter Binder, Christoph Bockish, Eric Bodden, Kardelen Hatun, Lukáš Marek, Zhengwei Qi, Aibek Sarimbekov, Andreas Sewe, Petr T˚uma and Yudi Zheng. Challenges for Refinement and Composition of Instrumentations: Position Paper. In Proceedings of 11th International Conference on Software Composition
(SC), pp. 86–96, Prague, Czech Republic, 2012.
• Lukáš Marek, Yudi Zheng, Danilo Ansaloni, Aibek Sarimbekov, Walter Binder, and Zhengwei Qi. Java Bytecode Instrumentation Made Easy: The DiSL Framework for Dynamic Program Analysis. In Proceedings of 10th Asian Symposium on
Programming Languages and Systems (APLAS), pp. 256–263, Kyoto, Japan, 2012. • Walter Binder, Philippe Moret, Danilo Ansaloni, Aibek Sarimbekov, Akira Yokokawa,
and Éric Tanter. Towards a domain-specific aspect language for dynamic program analysis: position paper. In Proceedings of 6th Workshop on Domain-specific Aspect Languages (DSAL), pp. 9–11, Porto de Galinhas, Brasil, 2011.
Chapter 2
State of the Art
2.1
Overview
In this chapter we discuss the state of the art in the area of workload characterization and comparison of programming languages. We give an overview of the existing techniques and discuss their limitations. We first describe what feedback-directed optimizations (FDO) are and discuss their relevance to this dissertation. The chapter also presents one of the main techniques used in FDO, namely program instrumentation.
2.2
Feedback-Directed Optimizations
Feedback-directed optimization is a well-known mechanism used for improving program execution based on its runtime behaviour. There are two types of FDO: off-line and online. In an off-line FDO the programmer first runs the application, gathers some statistics summarizing the behavior of the examined application and after using the collected statistics creates a new version of the application. Therefore, off-line refers to the fact that optimization takes place only after the application run[118], opposed to the online one, where optimizations take place during the application runtime. FDO techniques are heavily used in the area of computer architecture, i.e., in the production of processor chips [49, 103]. Caches, instruction scheduling, register allocations – all these are examples of FDO. FDO is also used in other fields, such as compiler development and software engineering.
Profile-guided compilation (PGC)[35, 64, 117] is a widely known technique used by modern compilers. In PGC the compiler tries to optimize the parts of the program that are frequently executed. Different profiling techniques, such as block[97], edge [45], or path[12] profiling are used to identify frequently executed program parts.
Another approach is offline optimization based on continuous profiling, where the profile collection takes place on the user’s machine continuously [3]. After the application terminates, the system will reoptimize the program offline, if necessary.
10 2.3 Workload Characterization
Opposed to PGC this approach is considered to be more adaptive and to incur less overhead[3, 61, 135].
Techniques for code generation[36, 53] stage the compilation of the program so that the optimization can take place during the program run, instead of performing the optimization during the compile time as in the previously discussed approaches. Partial evaluation is used to identify which parts of the application can benefit from the optimizations based on the information that can be collected during the runtime only. Since the majority of the optimizations anyway happens at compile time, this approach exhibits low overhead.
The most prominent FDO technique in the area of compiler development is online adaptive optimizations [4, 31, 92, 122]. As an example of this technique, one can consider HotSpot’s JIT compiler [92] and IBM Jikes RVM’s adaptive optimization system [4]. The optimization process in these systems is two staged, first the code is run in interpreted mode and after determining the frequently executed code the system performs additional optimizations. A similar approach is used by the Dynamo system[11].
The work presented in this dissertation uses the techniques that fall in the category of offline FDO. However, our system does not perform any optimizations, we leave this task to the developer who should take responsibilities between different trade-offs that usually happen while making optimizations (e.g., longer startup time vs. faster startup time)[63]. Another reason for not performing optimizations is our primary design goal: we opted to use a standard JVM and do not rely on any modified version of it. An example of such an approach is described in[5], where the authors extended the adaptive optimization system of the Jikes RVM[4]. Our primary goal was to equip JVM developers and JVM language implementers with tools that provide insights of the behaviour imposed by novel JVM languages. Therefore, our system only hints at possible optimizations that can be made.
2.3
Workload Characterization
After a careful study of the related work in the area of workload characterization, we identified several limitations that we try to address with our approach.
Excessive overhead.
Dufour et al.[41] define dynamic platform-independent metrics that serve for catego-rizing programs according to their dynamic behaviour in five areas: size, data structure, memory use, concurrency, and polymorphism. The tool *J[42] used by the authors relies on the JVMPI1, a deprecated2profiling interface for the JVM. Apart from being
1http://docs.oracle.com/javase/1.5.0/docs/guide/jvmpi/index.html 2JVMPI was deprecated in Java 5, and JVMTI is now offered instead.
11 2.3 Workload Characterization
not maintained anymore, it exhibits huge performance overhead making their approach hardly applicable to more complex Java workloads.
Ricci et al.[101] created a tool named ElephantTracks that implements the Merlin algorithm[59] for computing object life times. It produces traces that contain each object allocation and death, method entries and exits, and all pointer update events. Garbage collector (GC) implementers design and evaluate new GC algorithms by simulation based on those traces. However, this tracing tool introduces prohibitive overhead (e.g., it can take several days to run it on a single DaCapo benchmark with small workload size).
Architecture-dependent metrics.
Ammons et al.[2] use hardware performance counters for performing context sen-sitive and flow sensen-sitive profiling. The authors rely on binary instrumentation using Executable Editing Library in order to record profiling data. Their tool records hardware counters of UltraSPARC processors, such as instructions executed, cycles executed, and cache misses. Calling-context trees (CCT) are used to represent the execution of the application and each CCT is associated with hardware metrics.
Shiv et al.[115] compare the SPECjvm20083 and SPECjvm984benchmark suites. The authors present a quantitative evaluation based on different JVM- and architecture-dependent metrics; they look at the effectiveness of Java runtime systems including JIT compilation, dynamic optimizations, synchronization, and object allocation, and report the statistics also for SPECjAppServer20045 and SPECjbb20056.
These approaches strongly depend on the chosen architecture and cannot be gener-alized. Moreover, as shown in[62], microarchitecture-dependent metrics hide inherent program behaviour, while microarchitecture-independent metrics are more effective and useful in workload characterization.
Modified JVM.
Daly et al.[38] analyze the Java Grande benchmark suite [24] using JVM-independent metrics. The authors consider static and dynamic instruction mix and use five different Java-to-bytecode compilers in order to identify the impact of the choice of a compiler on the dynamic bytecode frequency. For collecting the metrics of interest, the authors use a modified version of the Kaffe Java Virtual Machine7.
Other researchers also use a modified version of a virtual machine in order to facilitate workload characterization, thus sacrificing portability. For instance, Gregg et al.[55] use a modified version of the Kaffe Java Virtual Machine for collecting a number of actual invocations to native methods. This approach is also used in[57, 74].
3http://www.spec.org/jvm2008/ 4http://www.spec.org/jvm98/ 5http://www.spec.org/jAppServer2004 6http://www.spec.org/jbb2005 7http://www.kaffe.org/
12 2.3 Workload Characterization
Ha et al.[56] implemented a concurrent analysis framework for multicore hardware. Their implementation is based on a modified version of the Jikes RVM[1]. To assess the framework the authors created 5 different well-known dynamic analyses and applied them to the SPECjvm2008 and the Dacapo 2006 benchmarks.
Limited coverage.
Pearce et al.[94] applied aspect-oriented programming (AOP) to create profiling tools. The authors used AspectJ to profile heap usage and object lifetime. Even though the study shows that AspectJ eases the development of tools for workload characterization, it suffers from a severe limitation. It has limited coverage and does not support profiling classes from the Java class library. The same limitation is true for most AOP-based approaches.
Bodden et al.[19] created RacerAJ that implements the ERASER algorithm [109] for data-race detection. At runtime, RacerAJ monitors all field accesses and lock acquisitions and releases, and reports a potential data race when a field had a write access from multiple threads without synchronizing the accesses. To maintain various per-thread and per-field data structures, RacerAJ uses an AOP-based instrumentation to intercept all field accesses, and all lock acquisitions and releases, both due to synchronized method invocations and due to entering syncrhonized blocks.
Chen et al.[27] developed an aspect-based memory leak detector for Java programs named FindLeaks. The tool identifies loitering objects using the constructor call and field set join points of AspectJ. It reports loitering objects, their construction site and their referencing objects. It also points out where in the source code references to loitering objects were created. However, the tool does not allow to identify a memory leak if no explicit allocation is made in the application code. This limitation can be solved by analyzing also the classes from the Java class library[128, 129].
Other approaches.
Jovic et al.[69] developed the tool LagHunter for detecting performance problems in interactive applications. The authors propose to measure latency instead of the common method hotness metric. Their tool collects so-called landmark methods that contain timing information for measuring lags. These landmark methods represent potential performance issues. In contrast to approaches using complete traces of method calls and returns, LagHunter results in small performance overhead. The authors used their tool for finding performance problems in the Eclipse IDE.
Zaparanuks et al.[134] presented an algorithmic profiling tool. The intention of the tool is to identify to what extent the implementation of an algorithm contributes to the overall performance by automatically producing cost functions. Using these cost functions, developers can understand the complexity of the algorithm and see which inputs cause long execution times.
13 2.4 Programming Languages Comparison
using SPECjvm98 and SPECjbb20058 benchmarks on a previous release of the Java JRE 1.6. They conclude that less than 20% of the execution time is spent in native code, thus confirming that platform-independent performance analysis is appropriate for most of the Java workloads.
Ratanaworabhan et al.[100] compare JavaScript benchmarks with real web appli-cations and compute different static and dynamic platform-independent metrics, such as instruction mix, method hotness, number of executed instructions. The authors use an instrumented version of the popular Internet Explorer browser, however the methodology is browser agnostic and can be used with any browser.
Richards et al.[102] apply the same approach to analyze the dynamic behavior of JavaScript, although they do not consider event-driven web applications that happen to be often the case of nowadays popular JavaScript applications as shown in[102].
In contrast to existing work, our approach is focused on obtaining dynamic metrics that spot potential optimizations. Our approach is based on bytecode instrumentation and can be run on any production JVM. It produces JVM-independent metrics that can be obtained in a reasonable amount of time. Our approach supports full bytecode coverage, i.e., it covers every method that has bytecode representation (including dynamically downloaded or generated classes together with the classes from the Java class library).
2.4
Programming Languages Comparison
The first attempts of comparing different languages were done 4 decades ago[126], where Algol 68 and PL/I were compared. Then, several other papers were published on the same topic[81, 123].
In [99] the authors present an empirical evaluation of 7 different programming languages. Performance, source code metrics, and memory consumption of C, C++, Java, Tcl, Ruby, Python, and Rexx applications are considered. As workloads, the authors use different implementations of the same application written in different languages by different programmers, thus avoiding the threat to validity of comparing a single implementation of an application.
In [58] the authors conduct a controlled experiment with subjects in order to compare object-oriented languages with procedural ones in the area of software mainte-nance. The authors asked the subjects to perform a set of typical software maintenance tasks and assess the difficulty of each task. C and Objective-C are the languages that were compared during the experiment. The authors find that systems developed in object-oriented languages are easier to maintain compared to systems developed in procedural languages.
In [10] the author compares 5 different parallel programming languages based on different paradigms. The author implemented 3 parallel programs in all the 5
14 2.5 Instrumentation
languages and reported on the programming experience, language implementation and performance. Since no platform exists on which all the languages can run, fair performance comparison was not possible, although the author used many different platforms in order to give rough estimations of the observed performance.
In[50] the authors report on a comprehensive comparison of parametric polymor-phism in six programming languages: C++, Standard ML, Haskell, Eiffel, Java9, and
Generic C#. The authors wanted to identify what language features were necessary to support generic programming and to provide guidance for the development of language support for generics.
While the topic on comparison of programming languages has always been popular, our intentions are different from previous work in the area. In this dissertation we are not comparing the performance of either programming language, instead we try to identify how well the JVM handles them. Therefore, the methodology used in our dissertation is rather different. The details of the study will follow in Chapter 5.
2.5
Instrumentation
In the following section we give an overview of instrumentation techniques for creating tools for workload characterization. Even though we rely on bytecode instrumen-tation for building our tools, for the sake of completeness we describe also binary instrumentation techniques.
2.5.1
Binary Instrumentation
Binary instrumentation helps one to analyze native methods that do not have any bytecode representation.
ATOM[119] is a binary instrumentation framework for building customized pro-gram analysis tools. ATOM allows selective instrumentation – only specified points in the application are targets for the instrumentation. The user has to provide a file that contains an instrumentation routine, a file with analysis routines and the application that has to be instrumented. ATOM takes care of avoiding interference between the code in the analysis routine and the code in the application itself by having two copies of the method in the executable.
Pin[77] is a tool that follows the ATOM approach. The tool developer needs to analyze an application at the instruction level without the need for detailed knowledge of the underlying architecture. Pin can attach to a running application, instrument it, collect profiles and, finally, detach. Pin has a rich API allowing to write customized instrumentation tools in C/C++.
Javana[78] is a tool that performs binary instrumentation underneath the virtual machine. High-level language constructs such as objects, methods, and threads are
15 2.5 Instrumentation
linked to the low-level native instructions and memory addresses in a vertical map through event handling mechanism. The instrumentation layer communicates with the virtual machine. Javana allows different events to be intercepted, such as class loading, object allocation and relocation, method compilation, Java thread creation and termination. Javana uses a modified version of the Jikes RVM[1].
DIOTA[79] is a tool that allows instrumentation of the running application. DIOTA does not alter the original application, it generates an instrumented version on the fly and keeps it in another memory location. The generated code will be created in such a way, that all data accesses will be taken from the original application, whereas code accesses will be taken from the instrumented version. In such a way, self-modifying code can be handled correctly. DIOTA uses backends that are responsible for what and how the code has to be instrumented.
Valgrind[85] is a dynamic binary instrumentation framework with a distinguishing feature, the support for shadow values. It is used for developing tools that detect memory-management problems, by intercepting all memory reads and writes, memory allocations, and frees. Valgrind’s core and the tool to be instrumented are loaded into a single process in order to avoid inter-process communication overhead.
EEL[73] is a tool for editing executables. It provides abstractions that allow one to modify executables without being concerned about the underlying architecture or operating system. Moreover, EEL provides portability across a wide range of systems. EEL provides five abstractions: executable, routine, control flow graph, instruction, and snippet. EEL allows editing control flow graphs by deleting or adding instructions, however it can be potentially dangerous, since instructions that corrupt the state of an application can be inserted.
DynamoRIO[23] is a framework for building customized program analysis tools. It operates with two kinds of code sequences: basic blocks and traces that are represented as linked lists of instructions. DynamoRIO copies basic blocks into a code cache and then executes them natively. A context switch happens at the end of each basic block and the control returns to DynamoRIO for copying the next basic block. The goal of DynamoRIO is to observe and manipulate, if needed, every single instruction prior to execution.
2.5.2
Bytecode Instrumentation
Java bytecode instrumentation is a common technique used in dynamic program analysis tools. It is usually performed by means of low-level libraries that require in-depth knowledge of the bytecode.
BCEL[37] provides a low-level API to analyze, create, and transform Java class files. Java classes are represented as objects that contain all the information of the given class: constant pools, methods, fields and bytecode instructions.
ASM[91] is similar to BCEL and allows generation of stub classes or other proxy classes. It also supports load-time transformation of Java classes. Classes in ASM can
16 2.5 Instrumentation
be represented in two ways: an object representation that exposes each class file as a tree of objects and an event-based representation that generates an event each time a specific element of a class file is parsed.
WALA [67] stands for IBM T.J. Watson Libraries for Analysis. WALA contains libraries both for static and dynamic program analysis. While WALA IR is immutable and no code generation is provided, it has limited code transformation abilities through Shrike. Shrike has a patch-based API that atomically applies all modifications to a given method body. For load-time bytecode transformations one has to use Dila[65] which is based on Shrike.
Spoon[93] is a framework for program transformation and static analysis in Java, which reifies the program with respect to a meta-model. This allows for direct access and modification of its structure at compile-time and enables template-based AOP, users can insert code, e.g., before or after a method body. Spoon uses source code-level transformations.
Javassist[28] is a load-time bytecode manipulation library that enables structural reflection, i.e. alter data structures in the program, which are statically fixed at compile time. Javassist provides convenient source-level abstractions, allowing its use without knowledge of Java bytecode. It additionally supports bytecode-level API allowing one to directly edit the class file.
Soot[127] is a bytecode optimization framework. Soot supports multiple bytecode representations in order to simplify the analysis and the transformation of Java bytecode. Soot can be used as a stand alone tool to optimize or inspect Java class files, as well as a framework to develop optimizations or transformations on Java bytecode.
Josh[29] is an AspectJ-like language that allows developers to define domain-specific extensions to the pointcut language. Josh is inspired by the idea of the open-compiler approach[72]. Internal structure and the behaviour of the compiler is represented as understandable abstractions and the open-compiler provides programming interface to customize the compiler through the abstractions. Extensions to the pointcut language can be developed as optional libraries or compiler plug-ins. Josh is built on top of Javassist[28].
Sofya [71] is a framework that allows rapid development of dynamic program analysis tools. It has a layered architecture in which the lower levels act as an abstraction layer on top of BCEL, while the top layers hide low-level details about the bytecode format and offer a publish/subscribe API that promotes composition and reuse of analyses. An Event Description Language (EDL) allows programmers to define custom streams of events, which can be filtered, splitted, and routed to the analyses.
RoadRunner[47] is a framework for composing different small and simple analyses for concurrent programs. Each analysis can stand on its own, but by composing them one can obtain more complex ones. Each dynamic analysis is essentially a filter over event streams, and filters can be chained. Per program run, only one chain of analyses can be specified, thus avoiding the combination of arbitrary analyses in incompatible
17 2.5 Instrumentation
way.
Chord10is a framework that provides a set of common static and dynamic analyses for Java. Moreover, developers can specify custom analyses, possibly on top of the existing ones. Chord provides a rich and extensible set of low-level events that can be intercepted.
DiSL[80, 136] is a domain-specific language for instrumentation. DiSL enables rapid development of efficient instrumentations for Java-based dynamic program analy-sis tools. It is built on top of ASM and provides higher abstraction layer at which the instrumentations can be specified.
Chapter 3
Rapid Development of Dynamic
Program Analysis Tools
3.1
Motivation
With the growing complexity of computer software, dynamic program analysis (DPA) has become an invaluable tool for obtaining information about computer programs that is difficult to ascertain from the source code alone. Existing DPA tools aid in a wide range of tasks, including profiling [15], debugging [6, 44, 132], and program comprehension[84, 104]. DPA tools also serve the task of workload characterization that we aim to conduct in this dissertation.
The implementation of a typical DPA tool usually comprises an analysis part and an instrumentation part. The analysis part implements algorithms and data structures, and determines what points in the execution of the analyzed program must be observed. The instrumentation part is responsible for inserting code into the analyzed program. The inserted code then notifies the analysis part whenever the execution of the analyzed program reaches any of the points that must be observed.
There are many ways to instrument a program, but the focus of this dissertation is on Java bytecode manipulation. Since Java bytecode is similar to machine code, manipulating it is considered difficult and is usually performed using libraries such as BCEL[124], ASM [91], Soot [127], Shrike [66], or Javassist [28]. However, even with those libraries, writing the instrumentation part of a DPA tool is error-prone and requires advanced expertise from the developers. Due to the low-level nature of the Java bytecode, the resulting code is often verbose, complex, and difficult to maintain or to extend.
The complexity associated with manipulating Java bytecode can be sometimes avoided by using aspect-oriented programming (AOP)[70] to implement the instrumen-tation part of a DPA tool. This is possible because AOP provides a high-level abstraction over predefined points in program execution (join points) and allows inserting code
20 3.1 Motivation
(advice) at a declaratively specified set of join points (pointcuts). Tools like the DJProf profiler [94], the RacerAJ data race detector [19], or the Senseo Eclipse plugin for augmenting static source views with dynamic metrics[104], are examples of successful applications of this approach.
AOP, however, is not a general solution to DPA needs—mainly because AOP was not primarily designed for DPA. AspectJ, the de-facto standard AOP language for Java, only provides a limited selection of join point types and thus does not allow inserting code at the boundaries of, e.g., basic blocks, loops, or individual bytecodes. Another important drawback is the lack of support for custom static analysis at instrumentation time, which can be used, e.g., to precompute static information accessible at runtime, or to select join points that need to be captured. An AOP-based DPA tool will usually perform such tasks at runtime, which can significantly increase the overhead of the inserted code. This is further aggravated by the fact that access to certain static and dynamic context information is not very efficient[16].
To leverage the syntactic conciseness of the pointcut-advice mechanism found in AOP without sacrificing the expressiveness and performance attainable by using the low-level bytecode manipulation libraries, the DiSL [80, 136] framework was introduced. DiSL is an open-source framework that enables rapid development of efficient instrumentations for Java-based DPA tools. DiSL achieves this by relying on AOP principles to raise the abstraction level (thus reducing the effort needed to develop an instrumentation), while avoiding the DPA-related shortcomings of AOP languages (thus increasing the expressive power and enabling instrumentations that perform as well as instrumentations developed using low-level bytecode manipulation libraries).
Having many choices for specifying instrumentations, DPA tool developers face a hard time of choosing the right instrumentation framework that fully satisfies their needs. To the best of our knowledge, no such quantification is present in the literature concerning instrumentation of Java programs.
The purpose of this chapter, therefore, is to quantify the usefulness of instrumen-tation frameworks when developing DPA tools. Specifically, we aim to address the following research questions:
RQ1 Which instrumentation framework improves developer productivity in writing instrumentations for DPA?
RQ2 Do instrumentations written in a high-level style perform as fast as their equiva-lents written using low-level libraries?
To answer the research questions, we conduct a controlled experiment to determine the framework that increases developer productivity. We also perform an extensive evaluation of 10 existing open source DPA tools, in which we reimplement their instru-mentation parts using DiSL, which offer a high-level approach for writing instrumen-tations. We compare reimplemented and the original instrumentation parts of those 10 DPA tools. With respect to RQ1, the controlled experiment provides evidence of
21 3.2 Background: DiSL Overview
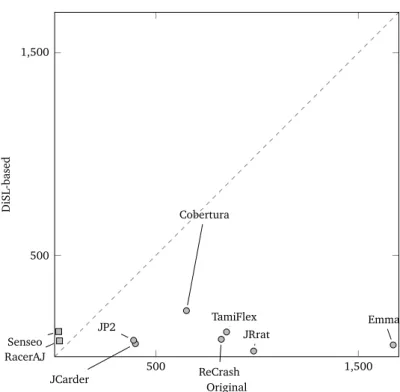
increased developer productivity, supported by the evidence of more concise expression of equivalent instrumentations obtained by comparing the sizes of the original and DiSL-based instrumentations in terms of logical lines of code. Regarding RQ2, we compare the overhead of the evaluated DPA tools on benchmarks from the DaCapo[17] suite using both the original and the DiSL-based instrumentation.
3.2
Background: DiSL Overview
DiSL1is a domain-specific language that provides developers of DPA tools with high-level concepts similar to those in AOP, without taking away the expressiveness and performance that can be attained when developing instrumentations using low-level bytecode manipulation libraries.
The key concepts raising the level of abstraction in DiSL instrumentations are
markersand snippets, complemented by scopes and guards. A marker represents a class of potential instrumentation sites and is similar to a join point in AOP. DiSL provides a predefined set of markers at the granularity of methods, basic blocks, loops, exception handlers, and individual bytecodes. Since DiSL follows an open join point model, programmers can implement custom markers to represent the desired instrumentation sites.
Snippets contain the instrumentation code and are similar to advice in AOP. Snippets are inlined before or after an instrumentation site, with the usual semantics found in AOP. The snippet code can access any kind of static context information (e.g., class and method name, basic block index), and may also inspect the dynamic context of the executing method (e.g., stack and method arguments).
Scopes and guards restrict the application of snippets. While scopes are based on method signature matching, guards contain Java code capturing potentially complex conditionals evaluated at instrumentation time. Snippets annotated with markers, scopes, and guards are colocated in a class referred to as DiSL instrumentation, which is similar to an aspect in AOP.
To illustrate the basic DiSL concepts and their similarity to AOP, Figures 3.1 and 3.2 show the source code of a simple tracing tool implemented using AspectJ and DiSL, respectively. On each method entry and method exit, the tool should output the full name of the method and its signature.
In the AspectJ version, theexecutionPointcut () construct selects method executions restricted to the desired class, while thebefore () and after () constructs define the advice code that should be run before and after method execution. Within the advice code, the thisJoinPointStaticPart pseudo-variable is used to access static information, e.g., method name, related to each join-point where the advice is applied.
In the DiSL version, we define two code snippets, represented by theonMethodEntry() andonMethodExit()methods, that print out the method name and signature before
22 3.2 Background: DiSL Overview
pointcut executionPointcut () : execution (* HelloWorld.* (..)); before (): executionPointcut () {
System.out.println ("On "+ thisJoinPointStaticPart.getSignature () +" method entry"); }
after (): executionPointcut () {
System.out.println ("On "+ thisJoinPointStaticPart.getSignature () +" method exit"); }
Figure 3.1. Tracing tool implemented using AspectJ.
@Before (marker = BodyMarker.class, scope = "*.HelloWorld.*") void onMethodEntry (MethodStaticContext msc) {
System.out.println ("On "+ msc.thisMethodFullName () +" method entry"); }
@After (marker = BodyMarker.class, scope = "*.HelloWorld.*") void onMethodExit (MethodStaticContext msc) {
System.out.println ("On "+ msc.thisMethodFullName () +" method exit"); }
Figure 3.2. Tracing tool implemented using DiSL.
and after executing a method body. The method name and signature is obtained from a method static context, which is accessed through the mscmethod argument. To determine when—relative to the desired point in program execution—the snippets should be executed, we use the @Before and @After annotations. The annotation parameters determine where to apply the snippets. Themarkerparameter selects the whole method body, and thescopeparameter restricts the selection only to methods of theHelloWorldclass.
To demonstrate the more advanced features of DiSL, Figure 3.3 shows a DiSL-based implementation of the instrumentation part of a field-immutability analysis tool, which identifies fields that were never written to outside the dynamic extent of the constructor [111]. This notion of immutability is dynamic by nature, and while it differs from the classic notion of immutability found in the literature[51, 52], it still provides a developer with valuable insights. The analysis (not shown) driven by the instrumentation tracks all field accesses and object allocations, and keeps a small state machine for each instance field. Every field can be in one of the three states: virgin (i.e., not read or not written to), immutable (i.e., read or was written to inside the dynamic extent of its owner object’s constructor), or mutable (otherwise).
To implement the instrumentation for such an analysis in DiSL, we define two snip-pets,beforeFieldWriteandbeforeFieldRead, which intercept theputfieldandgetfield bytecodes, respectively. Inside the snippets, we extract the reference to the instance
23 3.3 Quantifying the Impact of DiSL
in which the field is being accessed from the operand stack, and pass it along with the field identifier and a queue of objects under construction to the analysis class, ImmutabilityAnalysis2, using theonFieldWriteandonFieldReadmethods, respectively. To extract values from the operand stack (in this case the object reference), we use theDynamicContextAPI, which allows obtaining the values from arbitrary (valid) operand stack slots. The type of access to a field is determined by the bytecode instruction to which the snippets are bound, and the instruction in turn determines the operand stack layout we can expect when the corresponding snippet is executed. For field reads we therefore extract the object reference from the top of the operand stack, while for field writes we extract the reference from the second position from the top. The field identifier is obtained through a customMethodStaticContext.
After each object allocation, we use theafterInitializationsnippet to pass the newly allocated object, along with the identification of its allocation site, to the analysis runtime class using theonObjectInitializationmethod. As in the case of field accesses, theDynamicContextAPI is used to extract the reference to the newly allocated object from the operand stack.
The ThreadLocal static variable objectsUnderConstruction holds a stack of cur-rently executing constructors, which the analysis uses to determine whether the owner of a field being accessed is under construction. To maintain the stack, the beforeConstructorsnippet pushes the object under construction on the stack, whereas the afterConstructorsnippet pops the stack. The ConstructorsOnlyguard is used at instrumentation time to restrict the application of the two stack-maintenance snippets to constructors only.
3.3
Quantifying the Impact of DiSL
In this section we present the controlled experiment conducted to answer the first research question of this chapter. We first introduce the experiment design, including task and subject descriptions, and then present the results of the experiment followed by a discussion of threats to the validity of the study.
3.3.1
Experiment Design
The purpose of the experiment is to quantitatively evaluate the effectiveness of high-level framework for writing instrumentations for DPA tools compared to the use of a low-level bytecode manipulation library. We claim that using DiSL, developers of DPA tools can improve their productivity and the correctness of the resulting tools. In terms of hypothesis testing, we have formulated the following null hypotheses:
2For sake of brevity, we omit the description and the source code of the analysis runtime class, because
it is not important in the context of instrumentation—it merely defines an API that the instrumentation will use to notify the analysis about events in the base program.
24 3.3 Quantifying the Impact of DiSL
/** INSTRUMENTATION CLASS **/ public class DiSLClass {
@ThreadLocal
private static Deque <Object> objectsUnderConstruction; /** STACK MAINTENANCE **/
@Before (marker = BodyMarker.class, guard = ConstructorsOnly.class) public static void beforeConstructor (DynamicContext dc) {
try {
if (objectsUnderConstruction == null) {
objectsUnderConstruction = new ArrayDeque <Object> (); } objectsUnderConstruction.push (dc.getThis ()); } catch (Throwable t) { t.printStackTrace (); } }
@After (marker = BodyMarker.class, guard = ConstructorsOnly.class) public static void afterConstructor () {
ImmutabilityAnalysis.instanceOf ().popStackIfNonNull (objectsUnderConstruction); }
/** ALLOCATION SITE **/
@AfterReturning (marker = BytecodeMarker.class, args = "new")
public static void afterInitialization (MyMethodStaticContext sc, DynamicContext dc) { ImmutabilityAnalysis.instanceOf ().onObjectInitialization (
dc.getStackValue (0, Object.class), // the allocated object sc.getAllocationSite () // the allocation site
); }
/** FIELD ACCESSES **/
@Before (marker = BytecodeMarker.class, args = "putfield")
public static void beforeFieldWrite (MyMethodStaticContext sc, DynamicContext dc) { ImmutabilityAnalysis.instanceOf ().onFieldWrite (
dc.getStackValue (1, Object.class), // the accessed object sc.getFieldId (), // the field identifier
objectsUnderConstruction // the stack of constructors );
}
@Before (marker = BytecodeMarker.class, args = "getfield")
public static void beforeFieldRead (MyMethodStaticContext sc, DynamicContext dc) { ImmutabilityAnalysis.instanceOf ().onFieldRead (
dc.getStackValue (0, Object.class), // the accessed object sc.getFieldId (), // the field identifier
objectsUnderConstruction // the stack of constructors ); } } /** GUARD CLASS **/ class ConstructorsOnly { @GuardMethod
public static boolean isApplicable (MethodStaticContext msc) { return msc.thisMethodName ().equals ("<init>");
} }
25 3.3 Quantifying the Impact of DiSL
H10: Implementing DPA tools with DiSL does not reduce the development time of the
tools.
H20: Implementing DPA tools with DiSL does not improve the correctness of the tools.
We therefore need to determine if there is evidence that would allow us to refute the two null hypotheses in favor of the corresponding alternative hypotheses:
H1: Implementing DPA tools with DiSL reduces the development time of the tools. H2: Implementing DPA tools with DiSL improves the correctness of the tools.
The rationale behind the first alternative hypothesis is that DiSL provides high-level language constructs that enable users to rapidly specify compact instrumentations that are easy to write and to maintain. The second alternative hypothesis is motivated by the fact that DiSL does not require knowledge of low-level details of the JVM and bytecodes from the developer, although more advanced developers can extend DiSL for special use cases.
To test the hypotheses H10 and H20, we define a series of tasks in which the subjects, split between a control and an experimental group, have to implement different instrumentations similar to those commonly found in DPA tools. The subjects in the control group have to solve the tasks using only ASM, while the subjects in the experimental group have to use DiSL.
The choice of ASM as the tool for the control group was driven by several factors. The goal of the experiment was to quantify the impact of the abstractions and the programming model provided by high-level approach on the development of instrumen-tations for DPA tools. We did a thorough research of existing bytecode manipulation libraries and frameworks, and ASM came out as a clear winner with respect to flexi-bility and performance, both aspects crucial for development of efficient DPA tools. In addition, ASM is a mature, well-maintained library with an established community. As a result, ASM is often used for instrumentation development (and bytecode manipulation in general) both in academia and industry. We maintain that when a developer is asked to instrument an application by manipulating Java bytecode, ASM will most probably be the library of choice.
DiSL was developed as an abstraction layer on top of ASM precisely because of the above reasons, but with a completely different programming model inspired by AOP, tailored for instrumentation development. Using ASM as the baseline allowed us to quantify the impact of the abstraction layer and programming model on the instrumentation development process, compared to a lower-level, but commonly used programming model provided by ASM as the de-facto standard library.
26 3.3 Quantifying the Impact of DiSL
Task Description
0 a) On method entry, print the method name.
b) Count the number ofNEWbytecodes in the method. c) On each basic block entry, print its index in the method.
d) Before each lock acquisition, invoke a given method that receives the object to be locked as its argument.
1 On method entry, print the number of method arguments.
2 Before array allocation, invoke a given method that receives the array length as its argument.
3 Upon method completion, invoke a given method that receives the dynamic execution count of a particular bytecode instruction as its argument.
4 Before eachAASTOREbytecode, invoke a given method that receives the object to be stored in the array together with the corresponding array index as its arguments.
5 On eachINVOKEVIRTUALbytecode, invoke a given method that takes only the receiver of the invoke bytecode as its argument.
6 On each non-static field write access, invoke a given method that receives the object whose field is written to, and the value of the field as its arguments. Invocation shall be made only when writing non-null reference values.
Table 3.1. Description of instrumentation tasks
3.3.2
Task Design
With respect to the instrumentation tasks to be solved during the experiment, we maintain two important criteria: the tasks shall be representative of instrumentations that are used in real-world applications, and they should not be biased towards either ASM or DiSL. Table 3.1 provides descriptions of the instrumentation tasks the subjects have to implement. Those are examples of typical instrumentations that are used in profiling, testing, reverse engineering, and debugging.
To familiarize themselves with all the concepts needed for solving the tasks, the subjects first had to complete a bootstrap task 0.
3.3.3
Subjects and Experimental Procedure
In total, we had 16 subjects—BSc., MSc., and PhD students from Shanghai Jiao Tong University—participate in the experiment on a voluntary basis. Prior to the experiment, all subjects were asked to complete a self-assessment questionnaire regarding their expertise in object-oriented programming (OOP), Java, Eclipse, DPA, Java bytecode, ASM, and AOP. The subjects rated themselves on a scale from 0 (no experience) to 4 (expert), and on average achieved a level of 2.6 for OOP, 2.5 for Java, 2.5 for Eclipse, 0.75 for DPA, 0.6 for JVM bytecode, 0 for ASM, and 0.12 for AOP. Our subjects can be thus considered average (from knowledgeable to advanced) Java developers who had experience with Eclipse and with writing very simple instrumentation tasks, but
27 3.3 Quantifying the Impact of DiSL
with little knowledge of DPA and JVM in general, and with no expertise in ASM and AOP. Based on the self-assessment results, the subjects were assigned to the control and experimental groups so as to maintain approximately equal distribution of expertise.
The subjects in both groups were given a thorough tutorial on DPA, JVM internals, and ASM. The ASM tutorial focused on the tree API, which is considered easier to understand and use. In addition, the subjects in the experimental group were given a tutorial on DiSL. Since the DiSL programming model is conceptually closer to AOP and significantly differs from the programming model provided by low-level bytecode manipulation libraries, including ASM, we saw no benefit in giving the tutorial on DiSL also to the subjects in the control group. The tutorial was based on the experience of the author of this dissertation with dynamic program analysis and was given in form of an informal 3-hour lecture. The subjects were free to ask clarification questions. The experiment was performed in a single session in order to minimize the experimental bias (e.g., by giving different tutorials on the same topic) that could affect the experimental results. The session was supervised, allowing the subjects to ask clarification questions and preventing them from cheating. The subjects were not familiar with the goal of the experiment and the hypotheses.
We provided the subjects with disk images for VirtualBox,3 which was the only piece of software that had to be installed. Each disk image contained all the software necessary to complete the tasks: Eclipse IDE, Apache Ant, and ASM installed on an Ubuntu 10.4 operating system. In addition, the disk images for the experimental group also contained an installation of DiSL. All subjects received the task descriptions and a debriefing questionnaire, which required the subjects to rate the perceived time pressure and task difficulty. The tasks had to be completed in 180 minutes, giving a 30 minutes time slot for each task.
3.3.4
Variables and Analysis
The only independent variable in our experiment is the availability of DiSL during the tasks.
The first dependent variable is the time the subjects spend to implement the instru-mentations, measured by having the subjects write down the current time when starting and finishing a task. Since the session is supervised and going back to the previous task is not allowed, there is no chance for the subjects to cheat.
The second dependent variable is the correctness of the implemented solutions. This is assessed by code reviews and by manual verification. A fully correct solution is awarded 4 points, no solution 0 points, partially correct solutions can get from 1 to 3 points.
For hypothesis testing, we use the parametric one-tailed Student’s t-test, after validating the assumptions of normality and equal variance using the
![Figure 4.3. Query-based metrics are implemented on top of JP2 [108].](https://thumb-eu.123doks.com/thumbv2/123doknet/15018959.682439/64.892.243.651.159.445/figure-query-based-metrics-implemented-jp.webp)