1
Planning of spatially-oriented locomotion following focal brain damage in
1humans: a pilot study.
2 3 Supplementary Material 4 5 Methods 6 7 Protocol 8 9The experiments took place in a laboratory of dimensions 8.7 x 6 x 3.3 meters (length, width 10
and height respectively). The protocol was similar to the one used in our previous studies [see 11
1, 2]. Briefly, participants had to start from one of three fixed positions in the laboratory (left, 12
center or right) and to walk towards a distant target indicated by an arrow placed on the 13
ground (see figure 1A of the main manuscript). The dimensions of the arrow were 1.20 x 0.25 14
meters (length and width, respectively). The arrow was placed at a specific (x,y) position in 15
the room with a particular orientation (South, East, North and West, respectively S, E, N and 16
W). In the blindfolded condition, the participant first observed the arrow while standing at the 17
starting position. This observation period typically lasted less than 3 seconds. When he (or 18
she) was ready, he closed his eyes and attempted to complete the task without vision. The 19
starting signal was given by the experimenter by touching the participant shoulder with his 20
hand (for both “visual” and “blindfolded” conditions). 21
During blindfolded walking, the experimenter removed the arrow in order to avoid any tactile 22
feedback. Once the participant had completely stopped, he was asked to keep his eyes closed 23
while the experimenter took his hand and guided him randomly for a few seconds in the 24
laboratory before stopping at a random position. He was then allowed to re-open his eyes and 25
to go back to the starting position. This procedure prevented participants from visual feedback 26
during both task and post-task execution (avoiding in this way any spatial calibration of a 27
particular displacement using kinaesthetic cues). Participants completed two to three trials 28
before the experiment actually started in order to be familiar with the task and to dispel any 29
fear of hitting the walls during blindfolded trials. They were aware that one of the 30
experimenters (or a physiotherapist for patients) was present in the room during the whole 31
trial duration to prevent any fall or contact with the wall. While the experimenter had to 32
2
intervene 1 or 2 times (out of 114 repetitions per participant) in few participants to prevent 1
hitting the wall, none of them reported having felt fear during movement execution. 2
For a particular starting position, we asked participants to start walking the first step straight 3
ahead (orthogonal to the laboratory X axis) to make sure that they all begun the task in the 4
same conditions (both with vision and blindfolded). They were asked to enter the arrow by the 5
shaft and to stop walking when at the tip of the (visible or memorized) arrow. This allowed us 6
controlling for the final walking position and direction. Except for these instructions, no 7
specific restriction relative to the path to follow was provided to participants who walked at 8
their preferred speed. The angular displacement of the body in space induced by the different 9
orientations of the arrow ranged between -180° to 180° (see figure 1B). 10 11 Analysis 12 13 Whole-body trajectories 14
The average trajectory [xav(t), yav(t)] was defined by
15
( )
( )
y
( )
t
N
=
y
;
t
x
N
=
t
x
N = i i N = i i∑
∑
1 av 1 av1
1
(1)where N corresponds to the number of trajectories recorded for a given target. 16
The variability of a particular actual trajectory around the average trajectory was measured 17
using the instantaneous trajectory deviation (TD): 18
( )
(
( )
( )
)
(
( )
( )
)
2 av 1 2 av1
1
TD
x
t
x
t
+
y
t
y
t
N
=
t
i N = i i−
−
−
∑
(2) 19The Average and Maximum Trajectory Deviations (ATD, MTD) of each actual trajectory 20
around the average trajectory were given by: 21
3
ATD
( )
t
=
TD
( )
t
1 t 0 mean ≤ ≤ ,( )
( )
t
TD
=
t
MTD
1 t 0 max ≤ ≤ (3) 1Variance ellipses were calculated by principal component analysis. The variance ellipse at 2
time t is centred at [xav(t), yav(t)]. Its orientation and size indicate how the [xi(t), yi(t)] (I =
3
1,...,N) are distributed around [xav(t), yav(t)]. Note that r1(t)2 + r2(t)2 = TD(t)2 where r1 and r2
4
are the lengths of the ellipse’s semi major and semi minor axes [3]. 5
Comparison of trajectories in two conditions/groups of participants 6
We also compared the average trajectories recorded in two conditions (VI and BF) or between 7
patients (P) and controls (C) for a same condition. For this, we defined, for each target, the 8
instantaneous Trajectory Separation (TS) as 9
( )
(
( )
( )
)
(
( )
( )
)
2 B A 2 B A A/BTS
t
=
x
t
−
x
t
+
y
t
−
y
t
(4) 10where (xA,yA) and (xB,yB) denote the average trajectories respectively in condition/group A
11
and in condition/group B. We then defined the Average and Maximal Trajectory Separation 12
(ATS, MTS) as described in (3). 13
Temporal attributes of the locomotor trajectories 14
Whole-body velocity profiles 15
The computation of the velocity profiles and the variability around the mean velocity profile 16
was devoted to investigate whether participants varied their walking speed at similar 17
instants/positions along the trajectory. We thus defined the normalized velocity profile vi and
18
the average normalized velocity profile vav as follows
19
∑
∫
N = i i i i i i iv
N
=
v
;
dt
y
+
x
y
+
x
=
v
1 av 1 0 2 2 2 21
(5) 204
Next, the instantaneous Velocity Deviation (VD) was defined as: 1
( )
∑
(
( )
−( )
)
− N = i i t v t v N = t 1 2 av 1 1 VD (6) 2We defined the Average and Maximal Velocity Deviation (AVD, MVD) as described in (3). 3
4
Results 5
6
Walking speed, traveled distances and walking durations 7
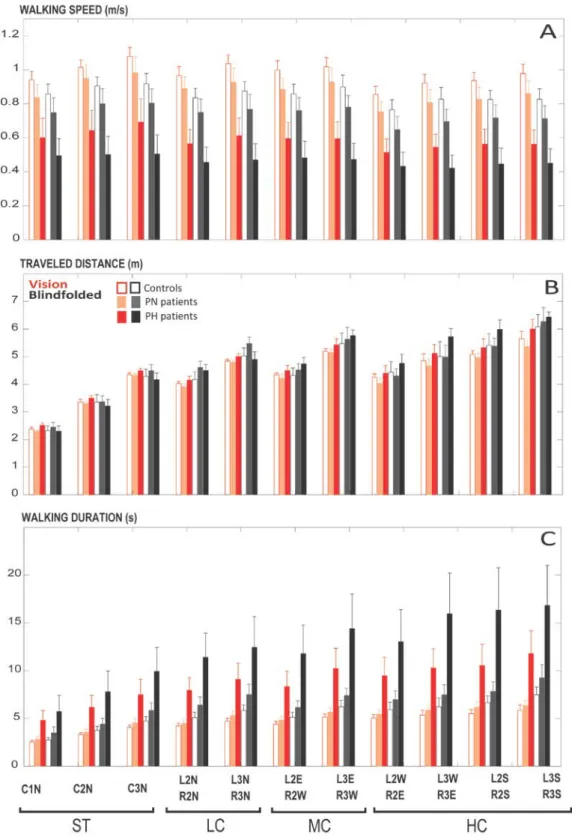
The average walking speeds, traveled distances and walking durations are presented in the 8
figures 6A, 6B and 6C. 9
Walking speed 10
On average, hemiparetic patients walk more slowly than healthy controls and non hemiparetic 11
brain lesion patients [13]. We observed the same group effect here: the mean walking speed 12
of CO was equal to 0.98 ± 0.11 and 0.85 ± 0.12 m/s (visual and blindfolded trials, 13
respectively) while it was equal to 0.88 ± 0.15 and 0.74 ± 0.15 m/s in PN and to 0.59 ± 0.19 14
and 0.47 ± 0.17 m/s in PH (F(1, 16)=14,879, p<0.01). We also observed a significant effect of 15
the category of trajectories (F(10, 160)=58,394, p<0.01) on the walking speed (figure 6A), 16
with the highest speeds being reached for the second and third straight targets (ST) and the 17
lowest speeds being reached for the four most angled (HC) targets. The visual condition also 18
significantly affected the walking speed (F(1, 16)=121,8, p<0.01). The (category x vision) 19
interaction effect was significant (F(10, 160)=8,0425, p<0.01) while the (category x group) 20
interaction effect was not significant (p>0.05). We did not observe any other interaction 21
effect. The effect of hemiparesis on the walking speed was assessed by performing ANOVA 22
on the patients’ group. This effect was significant (F(1, 8)=6,87, p=0.03): PH walked at a 23
significantly lowest speed than PN. We observed here a significant (category x hemiparesis) 24
interaction effect (F(10, 80)=2,149, p=,029) with walking speeds being nearly constant in the 25
PH sub-group across the 11 tested categories of trajectories. However, the individual 26
inspection of the walking speeds within each sub-group of patients revealed that PH patients 27
P07 and P09 had walking speeds comparable to that of PN. This effect of hemiparesis can 28
5
thus be attributed to PH patients P03, P04 and P08. Thus, hemiparesis significantly reduced 1
the walking speed (compared to PN) which was constant across straight and angled targets for 2
these three PH patients only. 3
Traveled distances 4
While these parameters naturally differ as a function of targets positions (the eleven 5
categories of targets along the axis of abscissas), traveled distances (figure 6B) were not 6
found to significantly differ across groups (p>.05). However, traveled distances were 7
significantly longer for blindfolded (BF) compared to visual (VI) conditions, as revealed by 8
the ANOVA tests (F(1, 16)=7,35, p<.05). This is particularly noticeable for angled targets 9
(categories LC, MC and HC) for both groups. This observation confirms oral reports of most 10
participants who expressed no “fear of hitting the wall” (see Methods): indeed, the average 11
distance traveled during blindfolded trials is comparable to that of visual trials. In any cases, 12
the difference between the VI and BF traveled distances never exceeds one meter even for the 13
most distant targets. No interaction effect (group x vision) was observed (p>.05). 14
Walking durations 15
In contrast with the walking distances, the walking durations (figure 6C) needed to complete 16
the task were found to be significantly longer in patients compared to healthy participants 17
(F(1, 16)=7,82, p<.05). Similarly, all participants walked a longer time to complete the task 18
during blindfolded trials (F(1, 16)=15,52, p<.01). However, the ANOVA comparison did not 19
reveal an interaction effect (Group x Vision). The group effect seems to be mainly driven by 20
the hemiparetic patients (see figure 6C). However, the ANOVA could not reasonably be 21
performed for the patients group as the Mauchley test for sphericity was positive (the 22
variances of the patients’ group were not homogeneous). Detailed inspection of the individual 23
data (not shown) showed that walking durations are usually twice longer for the PH patients 24
(compared to PN) except for patients P07 and patient P09 (who walked at a speed comparable 25
to PN, see Walking speed section). 26
Effect of the turning direction on the traveled distances and the walking durations 27
For this analysis, we added one level of comparison of the walking parameters by grouping 28
together the targets including only left or right turns. The performed ANOVA comparisons 29
did not reveal any significant effect of the turning direction on the traveled distances and 30
walking durations (p>.05). 31
6 Stepping behaviour
1
Here, we further analyze the spatial and temporal aspects of locomotion at the level of the 2
locomotor/stepping pattern. In particular, all PH patients had right-sided hemiparesis. We thus 3
tested whether the number of left (non-paretic in PH patients) and right (paretic) steps as well 4
as the non-paretic and paretic steps’ length/duration ratios varied across groups. 5
Number of steps to complete the task 6
The ANOVA comparisons did not reveal any effect of the side (p>.05), or interaction effect 7
(Side x Group or Side x Group x Category, p>.05) on the number of steps. This observation 8
revealed no asymmetry of hemiparetic gaits in terms of number of non-paretic and paretic 9
steps across all targets (including those inducing non-paretic or paretic turns). We thus pooled 10
together the non-paretic and paretic steps (figure 7A). Naturally, the number of steps varied as 11
a function of the categories (which were defined based on the target positions). More 12
interestingly, we observed that the total (left and right, or non-paretic and paretic in PH 13
patients) number of steps was systematically higher for patients (F(1, 16)=12,29, p<.01) and 14
for blindfolded trials (F(1, 16)=22,78, p<.01). We also observed an interaction effect (group x 15
vision: F(1, 16)=4,76, p<.01), explained by a higher effect of the visual condition in patients 16
(see figure 7A). As previously observed for the walking duration parameter, the ANOVA 17
could not reasonably be performed for the patients group as the Mauchley test for sphericity 18
was positive (the variances of the patients’ group were not homogeneous). Detailed inspection 19
of the individual data (not shown) showed that the number of steps to complete the task was 20
systematically higher (across categories and visual conditions) for all PH patients (compared 21
to PN) but patients P07 and P09. 22
Step Length Ratio 23
Although the step length was significantly shorter (by about 0.3 meter, 1.17 ± 0.13 vs 0.89 ± 24
0.22 meter on average for healthy participants vs patients, respectively) in patients compared 25
to healthy participants (F(1, 16)=17,90, p<0.01), we did not observe any effect of the side (left 26
/right steps, or non-paretic/paretic steps in PH) on the mean step length (p>0.05). We also 27
observed an effect of vision with steps shorter (by about 0.15 meter) in BF trials compared to 28
VI trials (F(1, 16)=48,19, p<.01). No interaction effect (vision x group) was observed (p>.05). 29
We thus compared (left/right or non-paretic/paretic) step length ratios across categories, 30
groups and visual conditions. This ratio was close to 1 (figure 7B) and no effect of the 31
7
category (p>.05) or the visual condition (p>.05) was observed. However, we observed a 1
significant group effect (F(1, 16)=6,96, p<.05) on the step length ratios SLR, although ratios 2
ranged between 0.99 and 1.02 on average (for healthy participants vs patients, respectively). 3
No interaction effect (category x group, category x vision, group x vision, or category x vision 4
x group, p>.05) was observed. The effect of hemiparesis on the SLR was assessed by 5
performing ANOVA on the patients’ group. No statistically significant effect of hemiparesis 6
(and no interaction effect with vision or category of trajectories, p>0.05) on the SLR was 7
observed. Thus, step length does not seem to be a strong marker of gait asymmetry in PH 8
patients [4]. 9
Stance Duration Ratios 10
The mean stance phase duration was longer (by about 0.21 second, 1.24 ± 0.18 vs 1.45 ± 0.30 11
seconds on average for healthy participants vs patients, respectively) in patients compared to 12
healthy participants. However, we could not compare the mean stance phase durations (nor 13
the stance phase durations ratios SDR) across groups because the Mauchley test for sphericity 14
was positive (the variances of the whole population of participants group were not 15
homogeneous). We therefore performed this test separately for the healthy and for the 16
patients’ groups only and the tests were negative in both cases. The ANOVA comparisons 17
performed on the CO group revealed a statistically significant effect of the category of 18
trajectories (F(10, 90)=4,42, p<0.01 – shorter stance phase durations for the straight targets 19
ST), of vision (F(1, 9)=13,21, p<0.01 – longer stance phase durations for BF trials) and a 20
significant interaction (category x vision) effect (F(10, 90)=2,67, p<0.01) on the mean stance 21
phase durations. The ANOVA comparisons performed on the patients’ group revealed no 22
significant effect of hemiparesis (p>0.05), a statistically significant effect of the limb side 23
(F(1, 8)=7,67, p=0.024), of the visual condition (F(1, 8)=10,89, p=0.011 – longer stance phase 24
durations for BF trials) and the category of trajectory (F(10, 80)=4,02, p<0.01 – shorter stance 25
phase durations for the straight targets ST), and a significant interaction (hemiparesis x limb 26
side) effect (F(1, 8)=14,11, p<0.01) on the stance phase duration. The stance phase duration 27
of the paretic limb in PH patients was thus significantly shorter than the one of the non-paretic 28
limb. The stance phase duration ratios (SDR, figure 7C) confirmed these observations. A SDR 29
close to 1 reveals perfect gait symmetry at the level of the stance phase. These were higher 30
than 1 only in PH patients (around 1.17 on average). The ANOVA comparisons of the stance 31
duration ratios (SDR) across categories and visual conditions revealed no statistically 32
significant difference in the CO group, indicating symmetric gaits in CO. The ANOVA 33
8
comparisons performed on the patients group revealed a statistically significant effect of 1
hemiparesis (F(1, 8)=9,85, p=0.013) on the SDR without any interaction effect. However, 2
visual inspection of individual data revealed the opposite phenomenon for the hemiparetic 3
patient P09 who had SDR systematically around 0.8 (paretic limbs had longer stance phase 4
durations). Thus, gait asymmetries frequently reported at the level of step duration [4] are 5
mainly explained by stance duration asymmetries (whatever the limb under consideration), 6
confirming the findings of a previous study [see 5]. 7
Effect of the turning direction on the stepping pattern 8
The turning direction did not affect any of the computed step parameters (p>.05), as observed 9
in a previous study [see 5]. 10
11
References 12
[1] Hicheur H, Pham QC, Arechavaleta G, Laumond JP, Berthoz A. The formation of trajectories 13
during goal-oriented locomotion in humans. I. A stereotyped behaviour. EurJ Neurosci. 2007;26:2376-14
90. 15
[2] Pham QC, Hicheur H. On the open-loop and feedback processes that underlie the formation of 16
trajectories during visual and nonvisual locomotion in humans. JNeurophysiol. 2009;102:2800-15. 17
[3] Pham QC, Hicheur H, Arechavaleta G, Laumond JP, Berthoz A. The formation of trajectories 18
during goal-oriented locomotion in humans. II. A maximum smoothness model. EurJ Neurosci. 19
2007;26:2391-403. 20
[4] Lauziere S, Betschart M, Aissaoui R, Nadeau S. Understanding Spatial and Temporal Gait 21
Asymmetries in Individuals Post Stroke. Int J Phys Med Rehabil. 2014;2. 22
[5] Godi M, Nardone A, Schieppati M. Curved walking in hemiparetic patients. Journal of 23 rehabilitation medicine. 2010;42:858-65. 24 25 26 27
9 1 S1 S2 S3 S4 2 3 4 S4 S6 S7 S8 5 6 7 S09 S10 8 9 10
Figure 5: Images from MRI/CT indicating the core brain lesions in each patient (Left is on the right 11
side) - see Table 1 of the main paper for a detailed description of the lesioned areas. 12
10 1
Figure 6: Walking speeds (A), traveled distances (B) and walking durations (C) across targets (C1N 2
to R3S) and visual conditions. L and R indicate Left and Right turns, respectively - 1, 2 and 3 indicate 3
target positions (see figure 1 of the main manuscript) - S, E, W and N indicate South, East, West and 4
North final target orientations. Categories ST, LC, MC and HC correspond to straight-ahead walking, 5
Low-Medium-High Curvature walking trajectories, respectively. Red and black colors correspond to 6
visual and blindfolded trials, respectively (see insert of the top-left corner of B for further information 7
about the color code). Note the longer durations (slowest walking speeds) necessary to perform the 8
task and the weak effect of targets on the walking speeds in PH patients only (see text for results of the 9
statistical comparisons across groups, targets and visual conditions). 10
11 1
Figure 7: Number of steps to complete the task (A), left/right (non hemiparetic limb/paretic limb in 2
PH patients) step length ratio (B) and stance phase duration ratio (C) across targets and visual 3
conditions (same color code as figure 5). The horizontal dashed line in B and C indicate a perfect gait 4
symmetry (ratio = 1). Note the higher number of steps (A) to perform the task and the clear gait 5
asymmetry observed at the temporal (C) but not at the spatial (B) level in PH patients only only (see 6
text for results of the statistical comparisons across groups, targets and visual conditions). 7