HAL Id: inserm-00090000
https://www.hal.inserm.fr/inserm-00090000
Submitted on 25 Aug 2006
HAL is a multi-disciplinary open access
archive for the deposit and dissemination of
sci-entific research documents, whether they are
pub-lished or not. The documents may come from
teaching and research institutions in France or
abroad, or from public or private research centers.
L’archive ouverte pluridisciplinaire HAL, est
destinée au dépôt et à la diffusion de documents
scientifiques de niveau recherche, publiés ou non,
émanant des établissements d’enseignement et de
recherche français ou étrangers, des laboratoires
publics ou privés.
French population.
Claire Cheyssac, Cécile Lecoeur, Aurélie Dechaume, Amina Bibi, Guillaume
Charpentier, Beverley Balkau, Michel Marre, Philippe Froguel, Fernando
Gibson, Martine Vaxillaire
To cite this version:
Claire Cheyssac, Cécile Lecoeur, Aurélie Dechaume, Amina Bibi, Guillaume Charpentier, et al..
Anal-ysis of common PTPN1 gene variants in type 2 diabetes, obesity and associated phenotypes in the
French population.. BMC Medical Genetics, BioMed Central, 2006, 7, pp.44.
�10.1186/1471-2350-7-44�. �inserm-00090000�
BioMedCentral
Page 1 of 10
(page number not for citation purposes)
BMC Medical Genetics
Open Access
Research article
Analysis of common PTPN1 gene variants in type 2 diabetes, obesity
and associated phenotypes in the French population
Claire Cheyssac
1, Cécile Lecoeur
1, Aurélie Dechaume
1, Amina Bibi
2,
Guillaume Charpentier
3, Beverley Balkau
4, Michel Marre
5,
Philippe Froguel
1,2, Fernando Gibson
2and Martine Vaxillaire*
1Address: 1CNRS UMR 8090, Institut de Biologie de Lille – Institut Pasteur, 59019 Lille, France, 2Imperial College Genome Centre and Section of
Genomic Medicine, Hammersmith campus, Imperial College, W2 0NN London, UK, 3Service de diabétologie, Centre Hospitalier Sud-Francilien,
91106 Corbeil-Essonnes, France, 4INSERM U780-IFR69, Research in Epidemiology and Biostatistics, 94807 Villejuif, France and 5INSERM U695,
Faculté de Médecine Xavier Bichat, Paris, France
Email: Claire Cheyssac - [email protected]; Cécile Lecoeur - [email protected];
Aurélie Dechaume - [email protected]; Amina Bibi - [email protected]; Guillaume Charpentier - [email protected]; Beverley Balkau - [email protected]; Michel Marre - [email protected];
Philippe Froguel - [email protected]; Fernando Gibson - [email protected]; Martine Vaxillaire* - [email protected]
* Corresponding author
Abstract
Background: The protein tyrosine phosphatase-1B, a negative regulator for insulin and leptin signalling, potentially modulates
glucose and energy homeostasis. PTP1B is encoded by the PTPN1 gene located on chromosome 20q13 showing linkage with type 2 diabetes (T2D) in several populations. PTPN1 gene variants have been inconsistently associated with T2D, and the aim of our study was to investigate the effect of PTPN1 genetic variations on the risk of T2D, obesity and on the variability of metabolic phenotypes in the French population.
Methods: Fourteen single nucleotide polymorphisms (SNPs) spanning the PTPN1 locus were selected from previous association
reports and from HapMap linkage disequilibrium data. SNPs were evaluated for association with T2D in two case-control groups with 1227 cases and 1047 controls. Association with moderate and severe obesity was also tested in a case-control study design. Association with metabolic traits was evaluated in 736 normoglycaemic, non-obese subjects from a general population. Five SNPs showing a trend towards association with T2D, obesity or metabolic parameters were investigated for familial association.
Results: From 14 SNPs investigated, only SNP rs914458, located 10 kb downstream of the PTPN1 gene significantly associated
with T2D (p = 0.02 under a dominant model; OR = 1.43 [1.06–1.94]) in the combined sample set. SNP rs914458 also showed association with moderate obesity (allelic p = 0.04; OR = 1.2 [1.01–1.43]). When testing for association with metabolic traits, two strongly correlated SNPs, rs941798 and rs2426159, present multiple consistent associations. SNP rs2426159 exhibited evidence of association under a dominant model with glucose homeostasis related traits (p = 0.04 for fasting insulin and HOMA-B) and with lipid markers (0.02 = p = 0.04). Moreover, risk allele homozygotes for this SNP had an increased systolic blood pressure (p = 0.03). No preferential transmission of alleles was observed for the SNPs tested in the family sample.
Conclusion: In our study, PTPN1 variants showed moderate association with T2D and obesity. However, consistent
associations with metabolic variables reflecting insulin resistance and dyslipidemia are found for two intronic SNPs as previously reported. Thus, our data indicate that PTPN1 variants may modulate the lipid profile, thereby influencing susceptibility to metabolic disease.
Published: 05 May 2006
BMC Medical Genetics 2006, 7:44 doi:10.1186/1471-2350-7-44
Received: 08 December 2005 Accepted: 05 May 2006 This article is available from: http://www.biomedcentral.com/1471-2350/7/44
© 2006 Cheyssac et al; licensee BioMed Central Ltd.
This is an Open Access article distributed under the terms of the Creative Commons Attribution License (http://creativecommons.org/licenses/by/2.0), which permits unrestricted use, distribution, and reproduction in any medium, provided the original work is properly cited.
Page 2 of 10
Background
The ubiquitously expressed protein tyrosine phosphatase-1B (PTPphosphatase-1B), encoded by the PTPN1 gene, catalyzes the dephosphorylation of tyrosine residues from the insulin receptor kinase activation segment [1] and IRS1 [2] result-ing in the down-regulation of insulin signallresult-ing. PTP1B also inhibits leptin signalling through the dephosphoryla-tion of JAK2 and STAT3 [3,4]. The disrupdephosphoryla-tion of the
PTPN1 gene in mice results in increased insulin
sensitiv-ity, resistance to diet-induced obesity [5] and enables nor-malization of blood glucose levels [6]. Moreover, it was shown that the inactivation of PTPN1 with antisense oli-gonucleotides regulates the expression of genes involved in lipogenesis, such as SREBF1, suggesting that PTP1B may play a role in the enlargement of adipocyte energy storage [7]. Taken together, these data illustrate a crucial role for PTP1B in insulin and leptin pathways and suggest that abnormal PTP1B activity could lead to insulin resist-ance and thereby to T2D and to obesity.
The human PTPN1 gene maps on chromosome 20q13.13, a syntenic region of the distal arm of the murine chromo-some 2 that harbours quantitative trait loci for body fat and body weight [8]. In humans, several linkage signals with T2D [9], BMI [10], fat mass and energetic intake [8,11,12] were reported at this locus in different popula-tions, further supporting PTPN1 candidacy in T2D and obesity. This locus also showed evidence of linkage with early onset T2D (onset = 45 years) in a subset of 55 French families [13]. Several recent studies have investigated genetic variants of PTPN1 for association with T2D. In an extensive analysis of the PTPN1 gene locus, Bento et al. [14] found convincing associations between multiple SNPs and T2D in two independent Caucasian American case-control samples. All of the associated SNPs were found to lie in a single 100 kb haplotype block and one common haplotype (frequency = 36%) was found to be strongly associated with T2D. The same group evaluated SNPs and haplotypes of PTPN1 for association with quan-titative glycaemic traits in Hispanic American subjects from the Insulin Resistance Atherosclerosis Study Family Study (IRASFS) [15]. Again, multiple SNPs were found to be associated with the insulin sensitivity index (Si) and fasting glucose. Haplotypes that were previously associ-ated with T2D risk also presented association with lower Si and with higher fasting glucose in the IRAS family study. However, a recent meta-analysis including 7883 individuals from three large European case-control sam-ples (from US, Poland and Scandinavia) did not replicate this association for any single SNP or haplotype [16]. These divergent findings question the impact of variation in the PTPN1 gene on the risk of T2D in populations of different ethnic origin. The aim of the present study was to further investigate the contribution of common PTPN1 polymorphisms to the risk of T2D and obesity, and to the
variability of quantitative metabolic traits in the French population.
Methods
Subjects
Two independently ascertained case-control samples were used to investigate association between PTPN1 gene vari-ants and T2D. The first case group (D1) is composed of 325 unrelated T2D probands from French families with strong T2D aggregation recruited at the CNRS unit in Lille [13]. The D1 probands were compared to a group of 311 unrelated normoglycaemic subjects called C1 (age> 45 years; fasting glycaemia< 5.6 mM) selected among spouses of French families recruited at the CNRS unit in Lille. The second case group, called D2, consists of 902 diabetes subjects recruited at the Endocrinology-Diabetol-ogy Department of the Corbeil-Essonnes Hospital. The D2 diabetes subjects were compared to a second group of 736 normoglycaemic (fasting glycaemia< 5.6 mM), non-obese subjects (C2) selected from the D.E.S.I.R. cohort [17]. To assess the association between SNPs and obesity, two groups of obese subjects were studied: a group of 616 subjects with moderate obesity (30 kg/m2< BMI< 40 kg/
m2) referred to as OBM and a group of 688 subjects with
severe obesity (BMI> 40 kg/m2) termed SO. Both groups
of obese subjects were compared to the C2 control group. The clinical characteristics of the case and control groups are given in Table 1. Familial association tests were per-formed in 148 French Caucasian nuclear families and in a subset of 55 sib-pairs characterized by an early age-of-onset of T2D (before 45 years) previously presenting link-age with T2D [13]. The entire family sample set include a total of 633 individuals, of whom 432 presented with dia-betes (sex ratio: 198/234, mean age-at-diagnosis: 49.5 ± 10.6 years, mean BMI: 27.9 ± 4.5 kg/m2), 72 with glucose
intolerance (sex ratio: 36/36, mean age-at-diagnosis: 59.1 ± 9.6 years, mean BMI: 27.4 ± 4.7 kg/m2), and 129 were
normoglycaemic subjects (sex ratio: 40/89, mean BMI: 25.1 ± 4.1 kg/m2).
Genotyping
SNPs were genotyped using the Applied Biosystem SNPlex™ Technology based on the Oligonucleotide Liga-tion Assay (OLA) combined with multiplex PCR, to achieve target amplification and allelic discrimination [18]. This allows multiplex genotyping for 48 SNPs simul-taneously in a unique sample. Allelic discrimination is performed through a capillary electrophoresis analysis using an Applied Biosystems 3730xl DNA Analyzer and the GeneMapper3.7 software. Thirty two individuals were genotyped in duplicate to assess the genotyping accuracy. All SNPs gave a genotyping concordance rate of 100%. SNPs rs941798 and rs914458 were genotyped in the fam-ily sample set by direct sequencing using an automated ABI Prism 3700 DNA sequencer in combination with the
BMC Medical Genetics 2006, 7:44 http://www.biomedcentral.com/1471-2350/7/44
Page 3 of 10
(page number not for citation purposes)
Big Dye Terminator Cycle Sequencing Ready Reaction Kit (Applied Biosystems, Foster City, California, United States). For SNP-7077G/C, genotyping in the families was performed by the FRET technology using the LightCycler™ assay based on hybridization probes labelled with fluores-cent dyes (Roche Diagnostics, Basel, Switzerland). In order to assess genotyping accuracy for this SNP, more than 10% of the genotypes were checked by direct sequencing and presented a concordance rate in excess of 99%.
Tag SNP selection
The genotypes of 29 SNPs in 30 Caucasian European trios available from the HapMap database (version of January 2005) were analysed using the Haploview software, and seven tag SNPs were selected according to the pairwise linkage disequilibrium calculated using the four gamete rule.
Statistical analysis
The Chi-square test was used to assess the deviation of SNP genotypes from the Hardy-Weinberg Equilibrium (HWE) and to examine the association of SNPs with T2D and obesity [19]. Significant association was considered for a p-value< 0.05. The Mantel-Haenzsel interaction test was used to define odds-ratios for the combined case-con-trol analysis [20]. Four quantitative traits related to glu-cose homeostasis were analysed in the control group C2: fasting glucose (Go expressed in mM); fasting insulin (Io expressed in µU/ml); HOMA-B, defined by the formula HOMA-B = (Io*20)/(Go-3.5); and HOMA-IR, defined by the formula HOMA-IR = (Io*Go)/22.5. BMI (kg/m2),
total cholesterol (mM), HDL cholesterol (mM), LDL cho-lesterol (mM), triglycerides (mM), systolic and diastolic blood pressure were also analysed in this control group. Non-Gaussian variables were either log or square-root
transformed. Linear regressions were then performed to adjust each variable for covariates such as age, sex and BMI. According to the normality of the standardized resid-uals, ANOVA or non-parametric tests were performed and three genetic models (codominant, dominant and reces-sive) were investigated. Linear regressions, ANOVA and non-parametric tests were performed using the SPSS sta-tistical analysis software. Familial association was investi-gated using the Family Based Association Test (FBAT) [21]. The Haploview software [22] was used to determine the pairwise linkage disequilibrium (D') and the minimal set of SNPs displaying the genetic information. This was checked with the STRATEGY software [23]. Haplotype analyses were then performed using the Haplotype Trend Regression (HTR) programme [24] to test haplotypic asso-ciation with T2D, obesity status and adjusted quantitative variables. The relevance of the best haplotypic association was computed using 1000 permutations and the Cocaphase software [25]. The statistical power of our combined sample of diabetes and control subjects was evaluated through the Quanto software [26] using the log-additive model of inheritance. Prevalence of T2D was esti-mated at 5%, and power was calculated for 1.2= OR= 1.4.
Results
Fourteen PTPN1 SNPs were selected for the study, includ-ing: (i) six common PTPN1 gene promoter or intronic SNPs (-7077G/C, rs941798, rs1570179, rs3787345, rs754118 and rs718050) showing association with T2D in previous studies [14,15,27]; (ii) seven tag SNPs selected from the HapMap version 14 of January 2005; and (iii) the synonymous exon 8 variant rs2282146, previously referred to as P303P [28]. The linkage disequilibrium (LD) structure at the PTPN1 locus was evaluated from the fourteen SNPs genotyped in a group of 736 French nor-moglycaemic non-obese subjects (C2). As shown in
Fig-Table 1: Characteristics of the case and control groups studied
Populations n Sex ratio men/women Mean age-at-diagnosis (years) Mean age-at-examination (years) Mean BMI (kg/m2) Diabetic subjects recruited in Lille (D1) 325 175/150 45.50 ± 10.71 61.83 ± 10.51 26.64 ± 3.63 Diabetic subjects recruited in Corbeil-Essonnes hospital (D2) 902 518/384 51.76 ± 8.87 62.55 ± 9.50 30.46 ± 6.02 Subjects with moderate obesity (OBM) 616 275/341 - 50.11 ± 14.15 34.21 ± 3.61
Subjects with severe obesity (SO)
688 165/523 - 46.03 ± 11.67 47.55 ± 7.33
Control subjects (C1) 311 123/188 - 62.99 ± 10.93 25.80 ± 4.57
Control subjects from D.E.S.I.R. cohort (C2)
736 293/443 - 53.47 ± 5.65 23.25 ± 1.78
For each group the number of subjects (n) and the sex ratio (men/women) are given. The mean age-at-diagnosis is the age of the patient when diabetes was diagnosed. The mean age-at-diagnosis, the mean age and the mean BMI are given as means ± standard deviation.
Page 4 of 10 ure 1, the LD analysis defined two strongly correlated
haplotype blocks (D' = 0.98). Moreover the LD matrix showed high pairwise LD between 12 of the 14 SNPs gen-otyped. The SNP rs3787335 presented a moderate LD (0.55=D'= 0.70) with 7 SNPs leading to a two block struc-ture covering ~91 kb at the PTPN1 locus and SNP rs914458, located 10 kb downstream of PTPN1, that showed no LD with the other 13 SNPs genotyped. Thus, our data indicated that PTPN1 lies in a region of strong LD, in agreement with previous reports [14,16].
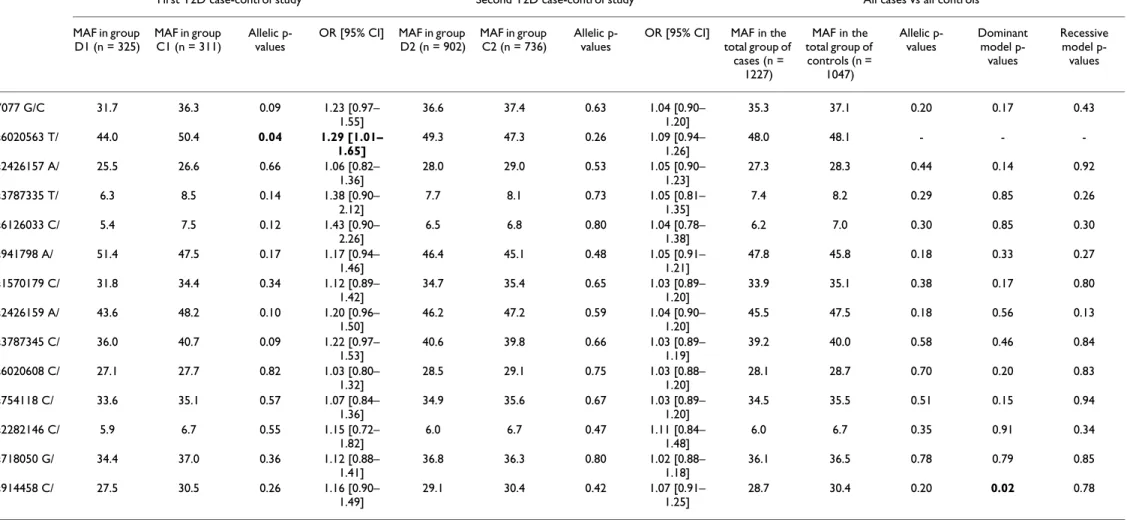
To assess the influence of the PTPN1 genetic variation on T2D and obesity risk in the French population, the 14 common SNPs (minor allele frequency (MAF) >5%) were genotyped in two case-control cohorts described in Table 1. Only SNP rs914458 deviated from the Hardy-Weinberg equilibrium (HWE) in the group of subjects presenting with a severe obesity (p = 0.005). To avoid genotyping
errors, 17% of the total genotypes were verified by direct sequencing, resulting in a 99.1% concordance rate. In our initial T2D association analysis, we compared the allelic frequencies of the 14 SNPs between 325 probands from T2D French families (D1) and a group of 311 nor-moglycaemic controls (C1). As shown in Table 2, only SNP rs6020563 presented a nominal allelic association with T2D (p = 0.04, OR = 1.29 [1.01–1.65]). This associa-tion is slightly stronger under a recessive model (p = 0.031, OR = 1.52 [1.04–2.23]; data not shown). In our second independently ascertained case-control study comprising 902 French adult diabetes subjects (D2) and 736 normoglycaemic subjects from the general popula-tion (C2), none of the 14 SNPs tested were associated with T2D. In order to assess a possible confounding role of BMI on the diabetes status, the D2 diabetes subjects were divided into two sub-groups: (i) subjects with BMI< 27 kg/m2 (n = 277); and (ii) subjects with BMI= 27 kg/m2 (n
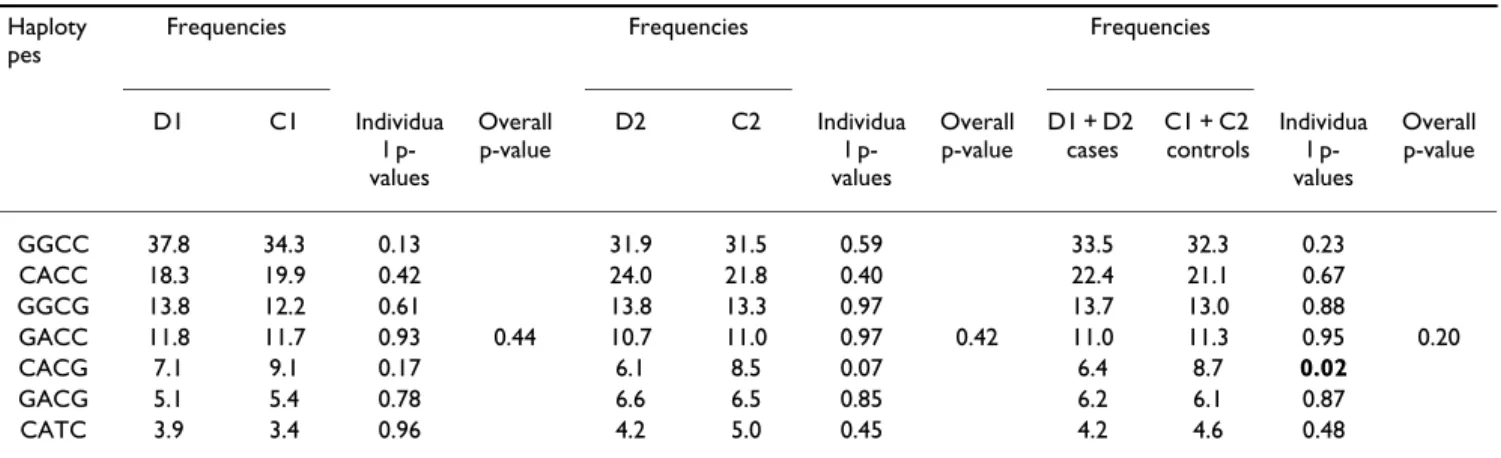
= 625). Neither of the sub-groups showed evidence of association with T2D (data not shown). To enhance statis-tical power, combined odds-ratios were then determined for each SNP by the Mantel-Haenszel test, except for rs6020563 which showed a significant difference in allelic frequencies between the two case-control studies (p = 0.019). In the combined sample, no significant differ-ences of allele frequency were observed for the 13 remain-ing SNPs, as shown in Table 2. However, SNP rs914458, located 10 kb downstream of PTPN1, associated with T2D when analysed under a dominant model (p = 0.02; Com-bined OR = 1.43 [1.06–1.94]). In order to assess the hap-lotypic effects, the Haploview and Strategy software were used to define a minimal set of 4 SNPs (-7077 G/C, rs941798, rs2282146 and rs914458), which were identi-fied as tagging the seven common haplotypes (frequency= 5%), and accounted for 97.6% of the haplotypic diversity (Figure 1). In the combined sample, haplotype CACG, including the G "protective" allele of the associated SNP rs914458, was more frequent in the control subjects than in the diabetes cases (Table 3) suggesting a potential "pro-tective" effect. In order to better estimate the significance of this effect, we computed the p-value for the association in 1000 permutations of the dataset. The empirical p-value obtained (p = 0.22) was not statistically significant, suggesting that the association could have been observed by chance.
We also investigated the potential contribution of the 14 common PTPN1 SNPs to obesity risk. SNPs were geno-typed in a group of 616 subjects presenting with moderate obesity (30 kg/m2<BMI< 40 kg/m2) and a group of 688
subjects presenting with severe obesity (BMI = 40 kg/m2).
Both groups were compared to the C2 group of 736 non diabetic and non-obese control subjects. SNP rs914458 displayed an association with moderate obesity (p = 0.04, Linkage disequilibrium plot of the PTPN1 gene region
evalu-ated in a group of 736 French normoglycaemic non-obese subjects
Figure 1
Linkage disequilibrium plot of the PTPN1 gene region evalu-ated in a group of 736 French normoglycaemic non-obese subjects The PTPN1 gene is shown by the black line with boxes representing its 10 exons. The localisation of the selected SNPs is indicated by the dotted line. The linkage dis-equilibrium plot represents the pairwise LD (D') estimated from the control group (C2) using the four gamete rule implemented in the Haploview software. The values cated in each square is the D' value, when no value is indi-cated D' = 1. The red colour indicates strong (D'> 0.8) and statistically significant (LOD>2) LD. Above the gene, the hap-lotype combinations are indicated with their respective fre-quencies; they were determined using the Haploview and Strategy softwares.
OR = 1.2 [1.01–1.43], Table 4) and a trend towards association with morbid obesity. The effect of the haplotypes was also investigated in both groups of obese subjects. In spite of a non-significant overall p-value, the CACG haplotype was significantly more frequent in the control group compared to the moderately obese subjects group (Table 4). However, the empirical p-value estimated through permutation testing, was not significant (p = 0.30) suggesting that the association observed with moderate obesity was probably due to chance.
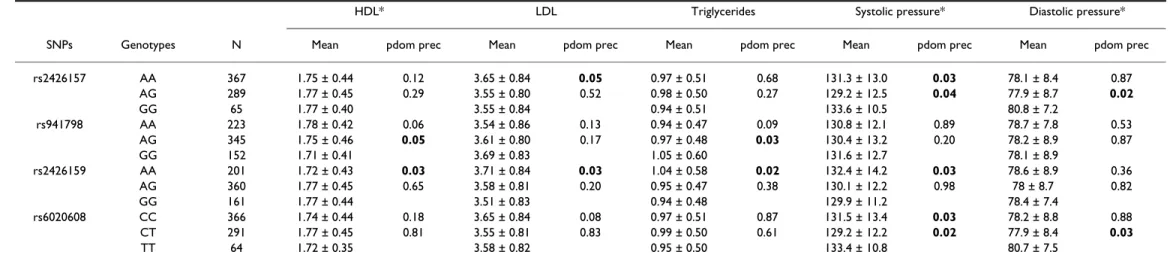
In order to assess the influence of the common PTPN1 gene variants on quantitative met-abolic variables, association analyses were performed in the C2 group of normoglycaemic and non-obese subjects. Tables 5 and 6 present the results of the genotype-quantitative
traits correlation studies for glucose and lipid metabolism traits, respectively. Two SNPs located in intron 1, rs941798 and rs2426159 (D' = 0.99), were strongly correlated and showed multiple associations with metabolic parameters as previously reported for SNP rs941798 [14]. SNP rs941798 displayed an association with HOMA-B in a dominant model (p = 0.03), whilst in a recessive model it was associated with decreased HDL cho-lesterol (p = 0.05) and increased triglyceride levels (p = 0.03). SNP rs2426159 showed associations with increased fasting insulin (p = 0.04), HOMA-B (p = 0.04), triglycerides (p = 0.02), and LDL cholesterol levels (p = 0.03), decreased HDL cholesterol level (p = 0.03) and with an increased systolic blood pressure (p = 0.03). Taken together these results suggest an association with the metabolic syndrome. No associations were
Table 2: Type 2 Diabetes case-control association study of the 14 PTPN1 SNPs.
First T2D case-control study Second T2D case-control study All cases vs all controls MAF in group D1 (n = 325) MAF in group C1 (n = 311) Allelic p-values
OR [95% CI] MAF in group D2 (n = 902)
MAF in group C2 (n = 736)
Allelic p-values
OR [95% CI] MAF in the total group of cases (n = 1227) MAF in the total group of controls (n = 1047) Allelic p-values Dominant model p-values Recessive model p-values -7077 G/C 31.7 36.3 0.09 1.23 [0.97– 1.55] 36.6 37.4 0.63 1.04 [0.90– 1.20] 35.3 37.1 0.20 0.17 0.43 rs6020563 T/ G 44.0 50.4 0.04 1.29 [1.01– 1.65] 49.3 47.3 0.26 1.09 [0.94– 1.26] 48.0 48.1 - - -rs2426157 A/ G 25.5 26.6 0.66 1.06 [0.82– 1.36] 28.0 29.0 0.53 1.05 [0.90– 1.23] 27.3 28.3 0.44 0.14 0.92 rs3787335 T/ G 6.3 8.5 0.14 1.38 [0.90– 2.12] 7.7 8.1 0.73 1.05 [0.81– 1.35] 7.4 8.2 0.29 0.85 0.26 rs6126033 C/ T 5.4 7.5 0.12 1.43 [0.90– 2.26] 6.5 6.8 0.80 1.04 [0.78– 1.38] 6.2 7.0 0.30 0.85 0.30 rs941798 A/ G 51.4 47.5 0.17 1.17 [0.94– 1.46] 46.4 45.1 0.48 1.05 [0.91– 1.21] 47.8 45.8 0.18 0.33 0.27 rs1570179 C/ T 31.8 34.4 0.34 1.12 [0.89– 1.42] 34.7 35.4 0.65 1.03 [0.89– 1.20] 33.9 35.1 0.38 0.17 0.80 rs2426159 A/ G 43.6 48.2 0.10 1.20 [0.96– 1.50] 46.2 47.2 0.59 1.04 [0.90– 1.20] 45.5 47.5 0.18 0.56 0.13 rs3787345 C/ T 36.0 40.7 0.09 1.22 [0.97– 1.53] 40.6 39.8 0.66 1.03 [0.89– 1.19] 39.2 40.0 0.58 0.46 0.84 rs6020608 C/ T 27.1 27.7 0.82 1.03 [0.80– 1.32] 28.5 29.1 0.75 1.03 [0.88– 1.20] 28.1 28.7 0.70 0.20 0.83 rs754118 C/ T 33.6 35.1 0.57 1.07 [0.84– 1.36] 34.9 35.6 0.67 1.03 [0.89– 1.20] 34.5 35.5 0.51 0.15 0.94 rs2282146 C/ T 5.9 6.7 0.55 1.15 [0.72– 1.82] 6.0 6.7 0.47 1.11 [0.84– 1.48] 6.0 6.7 0.35 0.91 0.34 rs718050 G/ A 34.4 37.0 0.36 1.12 [0.88– 1.41] 36.8 36.3 0.80 1.02 [0.88– 1.18] 36.1 36.5 0.78 0.79 0.85 rs914458 C/ G 27.5 30.5 0.26 1.16 [0.90– 1.49] 29.1 30.4 0.42 1.07 [0.91– 1.25] 28.7 30.4 0.20 0.02 0.78
All SNPs were in Hardy-Weinberg equilibrium in the different groups tested. Minor Allele Frequencies (MAF) are given for each group and for the pooled sample. P-values, odds-ratios (OR) and 95% confidence interval (95%CI) were estimated by a chi-square test for both initial case-control studies. Individual ORs are given for each SNP as "at-risk" vs. "protective" alleles. The combined p-values were determined by the Mantel-Haenszel interaction test. For the combined analysis, the p-values for dominant and recessive genetic models are also given. For SNP rs914458, which showed an association under the dominant model from the combined analysis, the OR value was 1.43, [95%CI: 1.06–1.94].
Page 6 of 10 observed for BMI, HOMA-IR, or total cholesterol. Finally,
Table 4: Obesity case-control association study of the 14 PTPN1 SNPs and haplotypes.
OBM vs C2 SO vs C2 MAF in the OBM group (n = 616) MAF in the SO group (n = 688) MAF in the C2 group (n = 736)
Allelic p-values OR [95% CI] Allelic p-values OR [95% CI]
-7077 G/C 38.4 38.0 37.4 0.60 1.04 [0.89–1.22] 0.83 1.02 [0.87–1.19] rs6020563 T/G 48.4 50.2 47.3 0.56 1.05 [0.89–1.23] 0.14 1.12 [0.96–1.31] rs2426157 A/G 28.9 27.8 29.0 0.96 1.00 [0.84–1.18] 0.39 1.07 [0. 91– 1.27] rs3787335 T/G 8.5 9.6 8.1 0.67 1.06 [0.81–1.40] 0.13 1.22 [0.94–1.58] rs6126033 C/T 7.0 8.7 6.8 0.81 1.04 [0.77–1.41] 0.05 1.32 [1.0–1.75] rs941798 A/G 44.6 45.2 45.1 0.76 1.02 [0.88–1.19] 0.97 1.00 [0.86–1.16] rs1570179 C/T 35.4 35.9 35.4 0.99 1.00 [0.85–1.17] 0.82 1.02 [0.87–1.19] rs2426159 A/G 48.9 49.4 47.2 0.36 1.07 [0.92–1.25] 0.22 1.10 [0.95–1.27] rs3787345 C/T 40.4 42.0 39.8 0.76 1.02 [0.88–1.20] 0.23 1.10 [0.94–1.28] rs6020608 C/T 28.7 27.8 29.1 0.85 1.02 [0.86–1.20] 0.41 1.07 [0. 91– 1.12] rs754118 C/T 35.5 37.4 35.6 0.93 1.00 [0.86–1.18] 0.35 1.08 [0.92–1.27] rs2282146 C/T 6.2 7.0 6.7 0.65 1.08 [0.77–1.53] 0.69 1.06 [0.79–1.43] rs718050 G/A 36.7 38.7 36.3 0.84 1.02 [0.87–1.19] 0.20 1.11 [0.95–1.29] rs914458 C/G 26.7 27.5 30.4 0.04 1.20 [1.01–1.43] 0.07 1.17 [0.99–1.39] Haplotype Frequencies in OBM Frequencies in SO Frequencies in C2 Individual p-values
Overall p-value Individual p-values Overall p-value GGCC 32.3 34.4 31.5 0.53 0.17 CACC 24.3 20.5 21.8 0.25 0.71 GGCG 12.0 11.3 13.3 0.22 0.19 GACC 12.2 11.1 11.0 0.38 0.32 0.91 0.78 CACG 5.8 8.7 8.5 0.04 0.58 GACG 6.2 6.3 6.5 0.58 0.70 CATC 4.7 6.0 5.0 0.78 0.55
Genotype and allele frequencies were estimated for each group. All genotypes were in Hardy-Weinberg equilibrium in the populations tested, except for SNP rs914458 C/G in the group of subjects with severe obesity. The p-values for chi-square tests, odds-ratios (ORs) and 95% confidence intervals (CI95) are given. The individual and overall p-values of the haplotypes are indicated. We estimated the empirical p-value of the CACG haplotype in the group of moderate obese subjects (p = 0.30) using 1000 permutations.
Table 3: Type 2 Diabetes association analysis for the seven common haplotypes
Haploty pes
Frequencies Frequencies Frequencies
D1 C1 Individua l p-values Overall p-value D2 C2 Individua l p-values Overall p-value D1 + D2 cases C1 + C2 controls Individua l p-values Overall p-value GGCC 37.8 34.3 0.13 31.9 31.5 0.59 33.5 32.3 0.23 CACC 18.3 19.9 0.42 24.0 21.8 0.40 22.4 21.1 0.67 GGCG 13.8 12.2 0.61 13.8 13.3 0.97 13.7 13.0 0.88 GACC 11.8 11.7 0.93 0.44 10.7 11.0 0.97 0.42 11.0 11.3 0.95 0.20 CACG 7.1 9.1 0.17 6.1 8.5 0.07 6.4 8.7 0.02 GACG 5.1 5.4 0.78 6.6 6.5 0.85 6.2 6.1 0.87 CATC 3.9 3.4 0.96 4.2 5.0 0.45 4.2 4.6 0.48
The 7 haplotypes defined by the four most informative SNPs (-7077 G/C, rs941798, rs2282146 and rs914458) were tested for association with T2D in both the individual case-control samples and in the pooled sample. Frequencies were estimated from case and control groups separately using the HTR software. Individual and overall p-values were indicated. We estimated the empirical p-value of the CACG haplotype in the combined sample through 1000 permutations of the dataset using the Cocaphase software (p = 0.20).
Table 5: Analysis of associations between genotypes and phenotypes related with T2D in the C2 group.
Genotypes N Go (mmol/l)* Io (mSI/ml) HOMA-B HOMA-IR*
Mean pdom prec Mean pdom prec Mean pdom prec Mean pdom prec
-7077G/C GG 283 5.03 ± 0.37 0.41 5.02 ± 2.45 0.43 68.63 ± 35.42 0.14 1.13 ± 0.58 0.63 GC 336 5.05 ± 0.35 0.37 5.24 ± 4.81 0.13 66.44 ± 32.30 0.05 1.19 ± 1.11 0.16 CC 102 5.10 ± 0.34 4.57 ± 1.85 58.96 ± 25.34 1.04 ± 0.44 rs6020563 TT 186 5.05 ± 0.34 0.83 5.23 ± 2.52 0.05 69.98 ± 35.11 0.07 1.18 ± 0.60 0.08 TG 319 5.05 ± 0.36 0.98 5.17 ± 4.88 0.07 65.68 ± 31.96 0.1 1.17 ± 1.13 0.11 GG 150 5.06 ± 0.34 4.63 ± 1.89 61.23 ± 25.65 1.05 ± 0.47 rs941798 AA 223 5.08 ± 0.33 0.23 4.69 ± 1.93 0.15 61.23 ± 25.81 0.03 1.06 ± 0.46 0.31 AG 345 5.03 ± 0.37 0.85 5.23 ± 4.88 0.06 67.75 ± 35.89 0.075 1.18 ± 1.13 0.06 GG 153 5.05 ± 0.35 5.20 ± 2.24 70.15 ± 34.05 1.17 ± 0.54 rs2426159 AA 202 5.04 ± 0.35 0.64 5.21 ± 2.51 0.04 70.36 ± 37.00 0.05 1.18 ± 0.60 0.07 AG 360 5.05 ± 0.36 0.81 5.19 ± 4.71 0.06 66.71 ± 35.32 0.06 1.17 ± 1.09 0.15 GG 161 5.06 ± 0.35 4.66 ± 2.01 61.68 ± 26.88 1.05 ± 0.45 rs3787345 CC 261 5.03 ± 0.37 0.31 5.05 ± 2.49 0.55 69.12 ± 36.16 0.15 1.14 ± 0.59 0.82 CT 332 5.05 ± 0.34 0.18 5.06 ± 2.44 0.115 67.28 ± 35.07 0.03 1.14 ± 0.57 0.21 TT 116 5.10 ± 0.34 5.28 ± 7.38 59.37 ± 25.80 1.21 ± 1.70 rs6020608 CC 366 5.02 ± 0.38 0.17 4.95 ± 2.36 0.79 67.93 ± 34.04 0.12 1.12 ± 0.56 0.92 CT 291 5.06 ± 0.33 0.03 5.25 ± 5.08 0.79 65.54 ± 32.22 0.16 1.19 ± 1.17 0.99 TT 64 5.15 ± 0.33 4.80 ± 2.12 59.72 ± 59.72 1.10 ± 0.50 rs754118 CC 297 5.01 ± 0.38 0.05 4.97 ± 2.44 0.92 68.76 ± 35.38 0.09 1.12 ± 0.58 0.73 CT 314 5.07 ± 0.33 0.18 5.28 ± 4.93 0.36 65.67 ± 31.93 0.14 1.20 ± 1.14 0.5 TT 94 5.11 ± 0.34 4.71 ± 1.99 60.19 ± 26.53 1.08 ± 0.47 rs718050 GG 290 5.01 ± 0.38 0.09 5.03 ± 2.48 0.54 69.50 ± 35.55 0.05 1.13 ± 0.59 0.77 GA 324 5.06 ± 0.33 0.07 5.23 ± 4.86 0.30 65.79 ± 32.21 0.07 1.18 ± 1.13 0.48 AA 96 5.12 ± 0.34 4.65 ± 1.90 58.93 ± 24.56 1.06 ± 0.45
Data are means ± SD for nonadjusted variables. Variables were transformed and adjusted by covariates (age, sex, BMI). The G0 and HOMA-IR variables had non-Gaussian residuals and were thus analysed by non-parametric tests as indicated by an asterisk (*); other variables were analysed by an ANOVA test. Results were presented for dominant and recessive models. Only SNPs showing an association were presented.
Table 6: Association analysis with quantitative traits related to the lipid and arterial blood pressure profiles
HDL* LDL Triglycerides Systolic pressure* Diastolic pressure*
SNPs Genotypes N Mean pdom prec Mean pdom prec Mean pdom prec Mean pdom prec Mean pdom prec
rs2426157 AA 367 1.75 ± 0.44 0.12 3.65 ± 0.84 0.05 0.97 ± 0.51 0.68 131.3 ± 13.0 0.03 78.1 ± 8.4 0.87 AG 289 1.77 ± 0.45 0.29 3.55 ± 0.80 0.52 0.98 ± 0.50 0.27 129.2 ± 12.5 0.04 77.9 ± 8.7 0.02 GG 65 1.77 ± 0.40 3.55 ± 0.84 0.94 ± 0.51 133.6 ± 10.5 80.8 ± 7.2 rs941798 AA 223 1.78 ± 0.42 0.06 3.54 ± 0.86 0.13 0.94 ± 0.47 0.09 130.8 ± 12.1 0.89 78.7 ± 7.8 0.53 AG 345 1.75 ± 0.46 0.05 3.61 ± 0.80 0.17 0.97 ± 0.48 0.03 130.4 ± 13.2 0.20 78.2 ± 8.9 0.87 GG 152 1.71 ± 0.41 3.69 ± 0.83 1.05 ± 0.60 131.6 ± 12.7 78.1 ± 8.9 rs2426159 AA 201 1.72 ± 0.43 0.03 3.71 ± 0.84 0.03 1.04 ± 0.58 0.02 132.4 ± 14.2 0.03 78.6 ± 8.9 0.36 AG 360 1.77 ± 0.45 0.65 3.58 ± 0.81 0.20 0.95 ± 0.47 0.38 130.1 ± 12.2 0.98 78 ± 8.7 0.82 GG 161 1.77 ± 0.44 3.51 ± 0.83 0.94 ± 0.48 129.9 ± 11.2 78.4 ± 7.4 rs6020608 CC 366 1.74 ± 0.44 0.18 3.65 ± 0.84 0.08 0.97 ± 0.51 0.87 131.5 ± 13.4 0.03 78.2 ± 8.8 0.88 CT 291 1.77 ± 0.45 0.81 3.55 ± 0.81 0.83 0.99 ± 0.50 0.61 129.2 ± 12.2 0.02 77.9 ± 8.4 0.03 TT 64 1.72 ± 0.35 3.58 ± 0.82 0.95 ± 0.50 133.4 ± 10.8 80.7 ± 7.5
Data are means ± SD for nonadjusted variables. Variables were transformed and adjusted by covariates (age, sex, BMI). The HDL and blood pressure measures variables had Gaussian residuals and were analysed by non-parametric tests as indicated by an asterisk (*); other variables were analysed by an ANOVA test. Results were presented for dominant and recessive models. Only SNPs showing an association are presented here.
Page 8 of 10 no PTPN1 haplotype was associated with any of the
quan-titative traits (data not shown).
Three non redundant SNPs (-7077 G/C, rs941798 and rs914458) presenting trends or associations with T2D in the case-control study, or with quantitative traits, were further investigated in the entire family sample set com-prising 148 French families and in a subset of 55 sib-pairs presenting with an early age-of-onset of T2D and having shown linkage at the 20q13 locus. No preferential trans-mission of alleles was observed for the SNPs tested in either of the samples (using the FBAT software; data not shown).
Discussion
In this study, we investigated the effect of PTPN1 genetic variation on susceptibility to T2D and obesity, and also on quantitative metabolic parameters. Our T2D associa-tion results strongly differ from those obtained in Cauca-sian American populations [14] and in Hispanic Americans from IRASFS [15] but are in good accordance with the meta-analysis conducted by Florez et al. [16]. Indeed, in the meta-analysis of the French case-control samples, only an extragenic SNP, rs914458 located 10 kb downstream of the PTPN1 gene, showed moderate associ-ation with T2D under a dominant model (p = 0.02). These divergent findings could be due to heterogeneity of T2D aetiology among the different populations, perhaps driven by differences in genetic or environmental modifi-ers. Indeed, we note that the Bento et al. and Palmer et al. studies displaying associations to T2D were performed in American subjects, whereas the Florez study and the present study were focused on European populations. The hypothesis of a lack of power seems unlikely for SNPs with an "at-risk" allele frequency> 24%. According to the Quanto software, for such an allele frequency and consid-ering ORs between 1.2 and 1.4, our combined case-con-trol sample (including 1227 diabetic subjects and 1047 controls) provide more than 80% power to detect an asso-ciation with T2D (power of 80.4% for OR = 1.2, and power of 99.9% for OR = 1.4). Thus, we expect that our study has good power to replicate the Bento et al results. However, we cannot formally exclude the possibility that our study design does not allow us to observe associations for SNPs rarer than 24% (rs3787335, rs6126033 and rs2282146).
Only a few association studies between PTPN1 gene vari-ants and obesity status have been reported previously. Here, we show a weak association between SNP rs914458 and moderate obesity (p = 0.04) and a trend towards asso-ciation with severe obesity for SNP rs6126033 located in the first intron (p = 0.05). However, our association anal-ysis of metabolic syndrome quantitative traits supports the hypothesis of a possible influence of PTPN1 genetic
variation on insulin sensitivity, plasma lipid levels and hypertension which are characteristics of the metabolic syndrome. Indeed, multiple consistent associations were observed between SNPs rs941798 and rs2426159 and metabolic parameters reflecting insulin sensitivity and the lipid profile. These results are in accordance with a number of studies showing influence of PTPN1 SNPs on metabolic syndrome traits. Recently, Spencer-Jones et al [29] reported several associations between PTPN1 gene variants and insulin sensitivity quantitative traits. Kipfer-Coudreau et al [30] showed association between PTPN1 genetic variation and dyslipidemia in the French popula-tion. An association was also reported between the Pro387Leu variant and hypertriglyceridemia in a German population [31]. In addition, Olivier et al. reported asso-ciations of PTPN1 gene variants with BMI and total cho-lesterol level in an Asian population [27]. These results are consistent with the known role of PTPN1 in the dephos-phorylation of the JAK2 kinase, an essential event in the leptin signalling pathway, and in the regulation of the expression of the lipogenic SREBF1, LPL and PPARγgenes [7].
Conclusion
Taken together, our data indicate that PTPN1 variants may modify the lipid profile, thereby influencing susceptibility to the metabolic syndrome in the French population. Fur-ther genetic and functional studies of the contribution of
PTPN1 variation to the metabolic syndrome and related
traits are clearly warranted.
Abbreviations
T2D: type 2 diabetes
PTPN1: protein tyrosine phosphatase non-receptor type1
JAK2: Janus kinase 2 BMI: Body Mass Index
SNP: Single Nucleotide Polymorphisms OLA: Oligonucleotide Ligation Assay DNA: desoxyribonucleic acid PCR: polymerase chain reaction
FRET: fluorescence resonnance energy transfert HTR: Haplotype Trend Regression
FBAT: Family Based Association Test GIST: Genotype IBD Sharing Test
BMC Medical Genetics 2006, 7:44 http://www.biomedcentral.com/1471-2350/7/44
Page 9 of 10
(page number not for citation purposes)
NPL: non parametric linkage
HOMA-B: Homeostasis Model Assessment β-cell insulin secretory index
HOMA-IR: Homeostasis Model Assessment Insulin Resist-ance
HDL: high density level LDL: low density level ANOVA: Analysis of Variance
Competing interests
The author(s) declare that they have no competing inter-ests.
Authors' contributions
Claire Cheyssac contributed to the study design and SNP selection for genotyping, to the statistical analyses and to the preparation and writing of the paper. Cecile Lecoeur performed the familial analysis (FBAT and TDT). Aurelie Dechaume and Amina Bibi have participated to the SNPs genotyping in the study samples. Guillaume Charpentier, Beverley Balkau and Michel Marre have provided some of the patient and control cohorts included in our study. Fernando Gibson has participated in the discussion of the results and the writing of the paper. Philippe Froguel and Martine Vaxillaire have directed the study and the writing of the paper.
Acknowledgements
The authors wish to thank Saida Lahmidi for her help in genotyping, Mari-anne Deweirder and Frederic Allegaert for DNA preparation, Christian Dina for statistical advice, Christophe Wachter and Sophie Gallina for their support in bio-informatics. Claire Cheyssac is supported by the Association "200 Familles pour vaincre le Diabète et l'Obésité" and the "Association Française des Diabétiques". This study was supported by grants from the "Region Nord Pas-de-Calais Genopole" and the Lille 2/CNRS institution.
References
1. Seely BL, Staubs PA, Reichart DR, Berhanu P, Milarski KL, Saltiel AR, Kusari J, Olefsky JM: Protein tyrosine phosphatase 1B interacts
with the activated insulin receptor. Diabetes 1996, 45:1379-85.
2. Goldstein BJ, Bittner-Kowalczyk A, White MF, Harbeck M: Tyrosine
dephosphorylation and deactivation of insulin receptor sub-strate-1 by protein-tyrosine phosphatase 1B. Possible facili-tation by the formation of a ternary complex with the Grb2 adaptor protein. J Biol Chem 2000, 275:4283-9.
3. Zabolotny JM, Bence-Hanulec KK, Stricker-Krongrad A, Haj F, Wang Y, Minokoshi Y, Kim YB, Elmquist JK, Tartaglia LA, Kahn BB, Neel BG:
PTP1B regulates leptin signal transduction in vivo. Dev Cell
2002, 2:489-95.
4. Cheng A, Uetani N, Simoncic PD, Chaubey VP, Lee-Loy A, McGlade CJ, Kennedy BP, Tremblay ML: Attenuation of leptin action and
regulation of obesity by protein tyrosine phosphatase 1B.
Dev Cell 2002, 2:497-503.
5. Elchebly M, Payette P, Michaliszyn E, Cromlish W, Collins S, Loy AL, Normandin D, Cheng A, Himms-Hagen J, Chan CC, Ramachandran C, Gresser MJ, Tremblay ML, Kennedy BP: Increased insulin
sensitiv-ity and obessensitiv-ity resistance in mice lacking the protein tyro-sine phosphatase-1B gene. Science 1999, 283:1544-8.
6. Klaman LD, Boss O, Peroni OD, Kim JK, Martino JL, Zabolotny JM, Moghal N, Lubkin M, Kim YB, Sharpe AH, Stricker-Krongrad A, Shul-man GI, Neel BG, Kahn BB: Increased energy expenditure,
decreased adiposity, and tissue-specific insulin sensitivity in protein-tyrosine phosphatase 1B-deficient mice. Mol Cell Biol
2000, 20:5479-89.
7. Rondinone CM, Trevillyan JM, Clampit J, Gum RJ, Berg C, Kroeger P, Frost L, Zinker BA, Reilly R, Ulrich R, Butler M, Monia BP, Jirousek MR, Waring JF: Protein tyrosine phosphatase 1B reduction
regulates adiposity and expression of genes involved in lipo-genesis. Diabetes 2002, 51:2405-11.
8. Lembertas AV, Perusse L, Chagnon YC, Fisler JS, Warden CH, Purcell DA-Huynh, Dionne FT, Gagnon J, Nadeau A, Lusis AJ, Bouchard C:
Identification of an obesity quantitative trait locus on mouse chromosome 2 and evidence of linkage to body fat and insu-lin on the human homologous region 20q. J Cinsu-lin Invest 1997, 100:1240-7.
9. Bowden DW, Sale M, Howard TD, Qadri A, Spray BJ, Rothschild CB, Akots G, Rich SS, Freedman BI: Linkage of genetic markers on
human chromosomes 20 and 12 to NIDDM in Caucasian sib pairs with a history of diabetic nephropathy. Diabetes 1997, 46:882-6.
10. Hunt SC, Abkevich V, Hensel CH, Gutin A, Neff CD, Russell DL, Tran T, Hong X, Jammulapati S, Riley R, Weaver-Feldhaus J, Macalma T, Richards MM, Gress R, Francis M, Thomas A, Frech GC, Adams TD, Shattuck D, Stone S: Linkage of body mass index to
chromo-some 20 in Utah pedigrees. Hum Genet 2001, 109:279-85.
11. Collaku A, Rankinen T, Rice T, Leon AS, Rao DC, Skinner JS, Wilmore JH, Bouchard C: A genome-wide linkage scan for dietary
energy and nutrient intakes: the Health, Risk Factors, Exer-cise Training, and Genetics (HERITAGE) Family Study. Am J
Clin Nutr 2004, 79:881-6.
12. Dong C, Wang S, Li WD, Li D, Zhao H, Price RA: Interacting
genetic loci on chromosomes 20 and 10 influence extreme human obesity. Am J Hum Genet 2003, 72:115-24.
13. Zouali H, Hani EH, Philippi A, Vionnet N, Beckmann JS, Demenais F, Froguel P: A susceptibility locus for early-onset non-insulin
dependent (type 2) diabetes mellitus maps to chromosome 20q, proximal to the phosphoenolpyruvate carboxykinase gene. Hum Mol Genet 1997, 6:1401-8.
14. Bento JL, Palmer ND, Mychaleckyj JC, Lange LA, Langefeld CD, Rich SS, Freedman BI, Bowden DW: Association of protein tyrosine
phosphatase 1B gene polymorphisms with type 2 diabetes.
Diabetes 2004, 53:3007-12.
15. Palmer ND, Bento JL, Mychaleckyj JC, Langefeld CD, Campbell JK, Norris JM, Haffner SM, Bergman RN, Bowden DW: Association of
protein tyrosine phosphatase 1B gene polymorphisms with measures of glucose homeostasis in Hispanic Americans: the insulin resistance atherosclerosis study (IRAS) family study.
Diabetes 2004, 53:3013-9.
16. Florez JC, Agapakis CM, Burtt NP, Sun M, Almgren P, Rastam L, Tuomi T, Gaudet D, Hudson TJ, Daly MJ, Ardlie KG, Hirschhorn JN, Groop L, Altshuler D: Association Testing of the Protein
Tyro-sine Phosphatase 1B Gene (PTPN1) With Type 2 Diabetes in 7,883 People. Diabetes 2005, 54:1884-91.
17. Fumeron F, Aubert R, Siddiq A, Betoulle D, Pean F, Hadjadj S, Tichet J, Wilpart E, Chesnier MC, Balkau B, Froguel P, Marre M:
Adiponec-tin gene polymorphisms and adiponecAdiponec-tin levels are inde-pendently associated with the development of hyperglycemia during a 3-year period: the epidemiologic data on the insulin resistance syndrome prospective study.
Diabetes 2004, 53:1150-7.
18. De la Vega FM, Lazaruk KD, Rhodes MD, Wenz MH: Assessment
of two flexible and compatible SNP genotyping platforms: TaqMan SNP Genotyping Assays and the SNPlex Genotyp-ing System. Mutat Res 2005, 573:111-35.
19. Sasieni PD: From genotypes to genes: doubling the sample
size. Biometrics 1997, 53:1253-61.
20. Mantel N, Haenszel W: Statistical aspects of the analysis of data
from retrospective studies of disease. J Natl Cancer Inst 1959, 22:719-48.
21. Horvath S, Xu X, Laird NM: The family based association test
method: strategies for studying general genotype–pheno-type associations. Eur J Hum Genet 2001, 9:301-6.
Publish with BioMed Central and every scientist can read your work free of charge
"BioMed Central will be the most significant development for disseminating the results of biomedical researc h in our lifetime."
Sir Paul Nurse, Cancer Research UK
Your research papers will be:
available free of charge to the entire biomedical community peer reviewed and published immediately upon acceptance cited in PubMed and archived on PubMed Central yours — you keep the copyright
Submit your manuscript here:
http://www.biomedcentral.com/info/publishing_adv.asp
BioMedcentral
Page 10 of 10
22. Barrett JC, Fry B, Maller J, Daly MJ: Haploview: analysis and
visu-alization of LD and haplotype maps. Bioinformatics 2005, 21:263-5.
23. Tregouet DA, Barbaux S, Escolano S, Tahri N, Golmard JL, Tiret L, Cambien F: Specific haplotypes of the P-selectin gene are
asso-ciated with myocardial infarction. Hum Mol Genet 2002, 11:2015-23.
24. Zaykin DV, Westfall PH, Young SS, Karnoub MA, Wagner MJ, Ehm MG: Testing association of statistically inferred haplotypes
with discrete and continuous traits in samples of unrelated individuals. Hum Hered 2002, 53:79-91.
25. Dudbridge F: Pedigree disequilibrium tests for multilocus
hap-lotypes. Genet Epidemiol 2003, 25:115-21.
26. Gauderman WJ: Sample size requirements for association
studies of gene-gene interaction. Am J Epidemiol 2002, 155:478-84.
27. Olivier M, Hsiung CA, Chuang LM, Ho LT, Ting CT, Bustos VI, Lee TM, De Witte A, Chen YD, Olshen R, Rodriguez B, Wen CC, Cox DR: Single nucleotide polymorphisms in protein tyrosine
phosphatase 1beta (PTPN1) are associated with essential hypertension and obesity. Hum Mol Genet 2004, 13:1885-92.
28. Echwald SM, Bach H, Vestergaard H, Richelsen B, Kristensen K, Drivsholm T, Borch-Johnsen K, Hansen T, Pedersen O: A P387L
variant in protein tyrosine phosphatase-1B (PTP-1B) is asso-ciated with type 2 diabetes and impaired serine phosphoryla-tion of PTP-1B in vitro. Diabetes 2002, 51:1-6.
29. Spencer-Jones NJ, Wang X, Snieder H, Spector TD, Carter ND, D O'Dell S: Protein Tyrosine Phosphatase-1B Gene PTPN1:
Selection of Tagging Single Nucleotide Polymorphisms and Association With Body Fat, Insulin Sensitivity, and the Met-abolic Syndrome in a Normal Female Population. Diabetes
2005, 54:3296-3304.
30. Kipfer-Coudreau S, Eberle D, Sahbatou M, Bonhomme A, Guy-Grand B, Froguel P, Galan P, Basdevant A, Clement K: Single nucleotide
polymorphisms of protein tyrosine phosphatase 1B gene are associated with obesity in morbidly obese French subjects.
Diabetologia 2004, 47:1278-84.
31. Gouni-Berthold I, Giannakidou E, Muller-Wieland D, Faust M, Kotzka J, Berthold HK, Krone W: The Pro387Leu variant of protein
tyrosine phosphatase-1B is not associated with diabetes mel-litus type 2 in a German population. J Intern Med 2005, 257:272-80.
Pre-publication history
The pre-publication history for this paper can be accessed here: