HAL Id: hal-03201721
https://hal-univ-paris.archives-ouvertes.fr/hal-03201721
Submitted on 19 Apr 2021
HAL is a multi-disciplinary open access archive for the deposit and dissemination of sci-entific research documents, whether they are pub-lished or not. The documents may come from teaching and research institutions in France or abroad, or from public or private research centers.
L’archive ouverte pluridisciplinaire HAL, est destinée au dépôt et à la diffusion de documents scientifiques de niveau recherche, publiés ou non, émanant des établissements d’enseignement et de recherche français ou étrangers, des laboratoires publics ou privés.
Distributed under a Creative Commons Attribution| 4.0 International License
perceptual and attentional sampling
René Michel, Laura Dugué, Niko Busch
To cite this version:
René Michel, Laura Dugué, Niko Busch. Distinct contributions of alpha and theta rhythms to percep-tual and attentional sampling. European Journal of Neuroscience, Wiley, 2021, �10.1111/ejn.15154�. �hal-03201721�
Eur J Neurosci. 2021;00:1–15. wileyonlinelibrary.com/journal/ejn
|
11
|
INTRODUCTION
In our everyday life, we experience our visual perception as a seamless, continuous flow. More than a century ago, Bergson (1911, p.332) introduced the metaphor of a "cinematograph
inside us" taking "snapshots [...] of the passing reality," which seems to contradict our everyday experience. With his film metaphor, he postulated our visual perception to consist of a succession of "perceptual snapshots" and "blind gaps," comparable to a filmstrip. In the last two decades, this idea
S P E C I A L I S S U E A R T I C L E
Distinct contributions of alpha and theta rhythms to perceptual
and attentional sampling
René Michel
1,2|
Laura Dugué
3,4|
Niko A. Busch
1,2This is an open access article under the terms of the Creative Commons Attribution License, which permits use, distribution and reproduction in any medium, provided the original work is properly cited.
© 2021 The Authors. European Journal of Neuroscience published by Federation of European Neuroscience Societies and John Wiley & Sons Ltd.
Edited by: Dr. Christian Keitel
Abbreviations: FFT, fast Fourier transform; SOA, stimulus onset asynchrony.
1Institute of Psychology, University of
Münster, Münster, Germany
2Otto Creutzfeldt Center for Cognitive and
Behavioral Neuroscience, University of Münster, Münster, Germany
3Université de Paris, INCC UMR 8002,
CNRS, Paris, France
4Institut Universitaire de France (IUF),
Paris, France
Correspondence
René Michel, Institute of Psychology, University of Münster, Münster, Germany. Email: [email protected]
Funding information
Agence Nationale de la Recherche, Grant/ Award Number: J18P08ANR00; Deutsche Forschungsgemeinschaft, Grant/Award Number: BU 2400/8- 1
Abstract
Accumulating evidence suggests that visual perception operates in an oscillatory fashion at an alpha frequency (around 10 Hz). Moreover, visual attention also seems to operate rhythmically, albeit at a theta frequency (around 5 Hz). Both rhythms are often associated to "perceptual snapshots" taken at the favorable phases of these rhythms. However, less is known about the unfavorable phases: do they constitute "blind gaps," requiring the observer to guess, or is information sampled with re-duced precision insufficient for the task demands? As simple detection or discrimi-nation tasks cannot distinguish these options, we applied a continuous report task by asking for the exact orientation of a Landolt ring's gap to estimate separate model parameters for precision and the amount of guessing. We embedded this task in a well- established psychophysical protocol by densely sampling such reports across 20 cue- target stimulus onset asynchronies in a Posner- like cueing paradigm manipulat-ing involuntary spatial attention. Testmanipulat-ing the resultmanipulat-ing time courses of the guessmanipulat-ing and precision parameters for rhythmicities using a fast Fourier transform, we found an alpha rhythm (9.6 Hz) in precision for invalidly cued trials and a theta rhythm (4.8 Hz) in the guess rate across validity conditions. These results suggest distinct roles of the perceptual alpha and the attentional theta rhythm. We speculate that both rhythms result in environmental sampling characterized by fluctuating spatial reso-lution, speaking against a strict succession of blind gaps and perceptual snapshots.
K E Y W O R D S
has inspired researchers to accumulate evidence for a rhyth-mic succession of such snapshots (see VanRullen, 2016; VanRullen & Koch, 2003, for a review). However, while this research has demonstrated that behavioral accuracy is best during the favorable “peaks” of this rhythm, less is known about the less favorable “troughs” in between two snapshots: do they reflect veritable gaps where nothing is processed, or moments of insufficient precision?
Numerous studies have demonstrated that visual percep-tion operates rhythmically, such that perceptual snapshots are taken at favorable phases of the rhythm (VanRullen, 2016). Empirical evidence for perceptual rhythms comes from stud-ies demonstrating the effect of the phase of ongoing neuro-nal oscillations in the alpha range (8– 12 Hz) at the moment of stimulus onset on stimulus detection (Busch et al., 2009; Mathewson et al., 2009) or detection of TMS- induced pho-sphenes (Dugué et al., 2011). Moreover, the speed of a per-son's alpha rhythm determines the temporal resolution of their visual perception (Samaha & Postle, 2015). Accordingly, Dugué and VanRullen (2017) have proposed that the occipi-tal cortex takes perceptual snapshots at its natural frequency, that is, the alpha rhythm (Rosanova et al., 2009).
Another type of rhythm has been found in studies on covert attention, i.e., selective visual processing in the ab-sence of eye movements (Carrasco, 2011). Numerous stud-ies have investigated this “blinking spotlight of attention” (VanRullen et al., 2007) using a psychophysical dense- sampling approach, in which a hypothetical ongoing brain rhythm is reset by a visual event (e.g., a visual cue; Lakatos et al., 2009) and performance is probed with a target stimulus at some delay following the resetting. Densely sampling per-formance across many delays with fine temporal resolution makes it possible to submit the resulting performance time course to a spectral analysis, e.g., a fast Fourier transform (FFT). With this approach, theta rhythmic (4– 7 Hz) reori-enting of spatial attention has been demonstrated in difficult search tasks (Dugué et al., 2015, 2017), forced choice tasks with two horizontally distributed target locations (Dugué et al., 2016; Landau & Fries, 2012; Senoussi et al., 2019; Song et al., 2014) and even in paradigms evoking sustained attention (Fiebelkorn et al., 2013). Helfrich et al. (2018) and Fiebelkorn et al. (2018) have suggested that this attentional theta rhythm originates from the fronto- parietal attentional network.
How might perceptual and attentional rhythms cooperate? Dugué and VanRullen (2017) have proposed that the occip-ital cortex samples visual information at its natural alpha frequency while receiving theta rhythmic feedback from higher order (attentional) brain regions whenever attention is deployed. This feedback may then reset the occipital alpha rhythm, which in turn results in phase- coupling of theta and alpha rhythms and superimposes a theta rhythm in perceptual performance. Fiebelkorn and Kastner (2019) proposed that
the attentional theta rhythm reflects moments of sampling at the attended location and moments of suppressed sam-pling, providing moments of opportunity for shifting covert or overt attention to a new location. Furthermore, they sug-gested other rhythms to be nested within the theta rhythm, such that its sampling- phase is associated with gamma and beta oscillations, while its shifting- phase is associated with alpha oscillations.
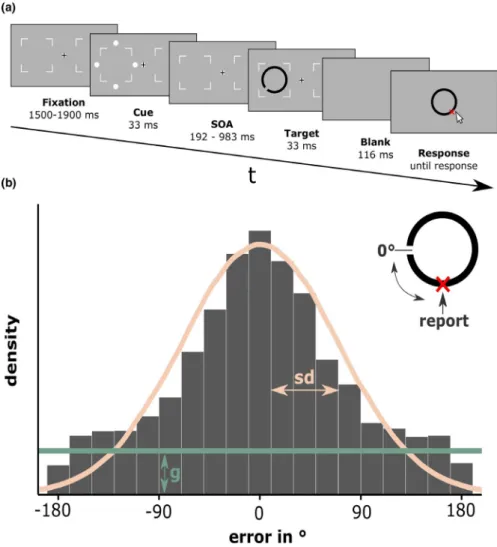
Interpretations of such rhythms in perceptual performance have often focused on the rhythm's favorable phase, as illus-trated by terms like “sampling” or “perceptual snapshots”. By contrast, the nature of the unfavorable phases has received much less attention. The “perception as snapshots” metaphor implies that no information is processed during unfavorable moments in between two snapshots, just like no image is rep-resented on film in between two movie frames, leaving the observer virtually blind. If a stimulus occurs during such a blind gap, the observer would have to guess. Alternatively, perceptual rhythms may constitute fluctuations in precision (e.g., spatial resolution), such that unfavorable phases rep-resent moments when precision is insufficient for the task at hand. Notably, in a conventional forced- choice detection or discrimination task with a single level of difficulty, even per-formance "at chance level" can either result from a stimulus representation with insufficient precision for that particular difficulty, or from the absence of any stimulus representation. By contrast, using a continuous report task allows estimating the contribution of precision and guessing (i.e., the absence of any stimulus representation) across the full range of diffi-culty levels (Suchow et al., 2013). In brief, participants are instructed to observe a critical stimulus feature (e.g., orien-tation of the gap in a Landolt ring), and then reproduce that feature as accurately as possible. Across trials, the distribu-tion of reproducdistribu-tion errors is well described by a mixture of two independent processes: a circular- Gaussian distribution around the stimulus’ true feature value whose standard devi-ation indicates the (im)precision of the observer's representa-tion, and a uniform distribution indicating the probability of not having any representation at all, i.e., guessing (Figure 1). For example, Asplund et al. (2014) demonstrated that the at-tentional blink impairs performance specifically by reducing the probability of representing the target, but not by reduc-ing perceptual precision. By contrast, Harrison et al. (2016) showed that visual masking mostly degraded the precision of stimulus representations rather than reducing the probability of having any representation.
The present study made use of this mixture modeling approach to investigate whether rhythms in perceptual per-formance indicate fluctuations in spatial resolution or in guess-ing. To this end, we used a continuous report task and asked participants to report the orientation of the gap of a Landolt ring, which has been demonstrated as a useful stimulus for testing spatial resolution (Anton- Erxleben & Carrasco, 2013;
Gobell & Carrasco, 2005; Yeshurun & Carrasco, 1999). Prior to the target ring, we presented an uninformative exogenous cue in order to capture automatic (involuntary) attention and to reset ongoing perceptual and attentional rhythms, and sampled participants’ performance across 20 densely spaced cue- target stimulus onset asynchronies (SOAs, see Landau & Fries, 2012, for a similar paradigm).
Given that the cue was uninformative about the target's lo-cation, we predicted a rhythmic reorienting of the attentional spotlight. Specifically, we expected to find a theta rhythm in the time course of either the precision or the guessing pa-rameter of the mixture models across SOAs in both valid and invalid trials. Moreover, we expected this rhythm to be in anti- phase for valid and invalid trials, indicating that the spot-light of attention moves back and forth between locations,
thereby improving performance only at one position at a time. Importantly, we reasoned that such a rhythm in the time course of the guessing parameter would indicate a succession of perceptual snapshots and blind gaps, whereas a rhythm in the precision parameter would indicate a succession of mo-ments with varying spatial resolution.
2
|
METHODS
This study comprises a pilot experiment and the main study. The purpose of the pilot was to determine the earliest cue- target SOA with a robust validity effect (i.e., higher perfor-mance at the cued location; see below), which is indicative of the shortest latency of attentional deployment. This SOA
FIGURE 1 Method. (a) Trial Sequence (proportions modified for illustration). After a fixation interval, an exogenous cue (four dots) was
briefly flashed around either the left or right target location. After one of 20 SOAs (ranging from 192 to 983 ms in steps of 41.65 ms), a target Landolt ring was briefly flashed either at the cued (valid) or uncued (invalid) location. The gap of the Landolt ring appeared at a randomly drawn position (0 to 360°). The target was followed by a short blank interval before a gray ring appeared around the fixation position. Participants reported the position of the gap via mouse- click on the matching position on the ring. (b) For each continuous report, the deviation from the correct gap position was calculated. For each SOA and validity condition, the resulting error distribution (ranging from −180° to 180°) was then modeled as a combination of a gaussian whose standard deviation represents a participant's precision (sd; pink line) and a uniform distribution representing the amount of guessing (g; green line). sd and g parameter estimates were obtained with a standard mixture model (Suchow et al., 2013).
then served as the shortest SOA in the main study. Apparatus and procedures were identical in both experiments unless stated otherwise.
Design and sample size of the main study were preregis-tered (see Data Availability Statement). Any deviations from the preregistration and unregistered, exploratory analyses are explicitly indicated as such.
Both studies were conducted in accordance with the eth-ical standards laid down in the World Medeth-ical Association Declaration of Helsinki (World Medical Association, 2013) and were approved by the ethics committee of the faculty of psychology and sports science, University of Muenster (#2018- 36- RM).
2.1
|
Participants
Fourteen participants, including the first author, participated in the pilot study (10 women, all right- handed, 5 right- eye dominant, aged 19– 30 years, Mage = 24.2, SDage = 3.4). An
additional participant was not able to perform the task and quit the experiment early.
Fourteen participants participated in the main study (10 women, 13 right- handed, 11 right- eye dominant, aged 18– 28 years, Mage = 21.4, SDage = 2.6). An additional
partic-ipant did not complete the preregistered minimum number of sessions and was therefore excluded. One participant had previously participated in the pilot experiment. The sample size was determined a priori based on similar studies using a dense sampling approach (Dugué et al., 2015; Dugué et al., 2017; Fiebelkorn et al., 2013; Landau & Fries, 2012; Senoussi et al., 2019).
All participants in both studies were recruited at the University of Muenster, had normal or corrected- to- normal vision, provided written informed consent, and were compen-sated with course credits or 8€/h.
2.2
|
Apparatus
Participants performed the experiment in a dimmed room, seated in a fixed chair in front of a calibrated 24” Viewpixx/ EEG LCD Monitor (120 Hz refresh rate, 1 ms pixel re-sponse time, 95% luminance uniformity, 1,920*1,080 pixels resolution; www.vpixx.com). A chin rest was used to stabilize the head position and keep the distance to the screen at approximately 86 cm. A stationary eye- tracker (EyeLink 1,000+; www.sr- resea rch.com) was used for monocular tracking of the participant's dominant eye at 1,000 Hz sampling rate. Calibration of the eye- tracker was carried out using the default nine- point calibration grid. Calibration took place at the beginning of each session and, if necessary, in experiment breaks or when participants
broke fixation in three consecutive trials. Responses were given with a Logitech RX250 optical USB mouse (www. logi.com). The experiment was presented using Matlab R2018b (www.mathw orks.com) and the Psychophysics Toolbox (Brainard, 1997) on a Linux system (Intel Core i5– 3330 CPU, a 2 GB Nvidia GeForce GTX 760 GPU, and 8 GB RAM).
Millisecond precision of the stimulus presentation timing was ascertained by means of a photodiode test prior to the ex-periment, following recommendations outlined in De Clercq et al. (2003). For all critical events, expected on- screen time differed from measured on- screen time by less than 0.6 ms on average (see Supporting Information, Figure S1 for details).
2.3
|
Stimuli
For an overview of the stimulus arrangement, see Figure 1a. All stimuli were presented on a medium gray background (52.2 cd/m2). Two placeholders indicating target locations
(thin square outlines, size = 2.8° visual angle, 102.3 cd/m2)
were positioned at 3.5° to the left and right of the central fixa-tion marker (diameter = 0.7°, black and white, 0.2 cd/m2 and
102.3 cd/m2; see Thaler et al., 2013). The cue consisted of
four white dots (102.3 cd/m2, diameter = 0.21°) surrounding
one of the two target locations (0.6° distance to the imaginary outline of the target location boundary and 1.26° distance to the edge of the upcoming target). The Landolt ring (diame-ter = 1.4°, thickness = 0.175°) was centered at one of the two target locations and had a gap (size = 0.05°) at a randomly drawn position (0 to 360°). The Landolt ring's gray tone was individually determined for each participant and was adjusted by means of a staircase algorithm (see below) throughout the whole experiment (M = 43.99 cd/m2, SD = 1.32 cd/m2). For
the response, a closed dark gray ring (diameter = 2.8°, thick-ness = 0.35°, 36.1 cd/m2) was presented at the center of the
screen.
2.4
|
Procedure
The procedures were similar for the pilot experiment and the main study, except for the number of sessions and the range of SOAs tested.
The pilot experiment comprised a single recording session of 480 trials. Prior to those test trials, participants performed between 12 and 36 easy practice trials with higher contrast to familiarize with the task and 84 test- like trials for finding an appropriate starting contrast for the staircase procedure (see below). Only three SOAs were probed: 128, 159, and 192 ms. These SOAs were chosen to cover the time interval in which the earliest facilitatory effects of exogenous cueing have been reported (cf. Carrasco, 2011).
The main study comprised nine recording sessions of approximately 1 hr- duration each to collect a total of 3,840 trials per participant. The first session (480 trials) served as a practice session to familiarize the participant with the task and to give the staircase a sufficient number of trials for finding an appropriate target contrast for the remaining 8 test sessions. Each test session consisted of 16 practice trials and 480 test trials. During practice trials, participants received feedback about the correct gap position, the po-sition they reported and the error in degrees. Each session was divided into 30 blocks of 16 trials separated by small breaks (self- paced, but at least 15 s). A total of 20 SOAs ranging from 192 to 983 ms in steps of 41.65 ms were tested, leading to 96 trials per SOA and validity condition (see below).
The trial sequence is illustrated in Figure 1a. Every trial started with a fixation cross and two placeholders for target locations for 1,500 to 1,900 ms (randomized across trials), followed by a non- informative visual cue that was flashed for 33.3 ms around one of the two potential target locations. After a variable SOA following the cue (see above), the target was flashed for 33.3 ms at either the previously cued loca-tion (valid, 50%) or at the opposite localoca-tion (invalid, 50%). Target offset was followed by a brief blank screen for 116 ms. Finally, a gray ring was presented at the center of the screen and participants reported the position of the gap in the tar-get Landolt ring. Participants were asked to deliver their re-sponse with a mouse click as accurately as possible within 5 s. Trials with too slow responses were aborted and repeated at the end of the respective session. After response, an inter- trial- interval with a blank screen was presented for a random duration from 300 to 600 ms. Cue and target positions were counterbalanced within each block; SOAs were counterbal-anced within each session.
To ensure that the task was challenging, but not too dif-ficult, and to reduce the variability between participants, we used an adaptive staircase procedure (QUEST; Watson & Pelli, 1983), which adjusted the target's contrast to keep accuracy pinned at 70% (for mean and standard deviations of presented luminances; see Stimuli). On each trial, a target contrast was selected based on the data from the 100 pre-ceding trials. To this end, accuracy was operationalized by artificially dichotomizing the continuous reports and consid-ering all responses within ±90° from the correct gap position a “hit”.
2.5
|
Fixation monitoring
Participants were required to keep fixating the central fixa-tion marker during the interval from 800 ms before cue onset until target offset. Online fixation monitoring auto-matically aborted trials in which fixation was broken to
repeat them at the end of the respective session. Broken fixations were defined as eye movements >1.4° away from the center of the fixation cross or blinks (percentage of aborted trials due to broken fixations across partici-pants in pilot study: M = 5.72%, SD = 5.24%; main study:
M = 6.91%, SD = 4.55%). Note that this criterion for a
broken fixation is more conservative than the preregistered value of 2°, which would have allowed participants to even fixate the border of the target locations.
3
|
ANALYSIS
The analysis was performed using R (Version 3.6.1) and RStudio (Version 1.2.1335) with the circular package (Agostinelli & Lund, 2017). Mixture models were estimated using the MemToolbox (Suchow et al., 2013) under Matlab R2020a (www.mathw orks.com). All scripts are publicly available (see Data Availability Statement).
The error for each trial was defined as the shortest angular distance between the reported and the true gap position, rang-ing from −180° to 180° with 0° indicatrang-ing a perfect match (see Figure 1b). Separately for each participant, SOA and va-lidity condition, the resulting error distribution was modeled using a standard mixture model with parameters sd (preci-sion) and g (guessing; see Figure 1b).
To test for a validity effect (indicating a facilitation at the cued position), paired t tests were performed to compare g and sd between valid and invalid trials. For the pilot exper-iment, we investigated validity differences in an exploratory manner by means of two- tailed t tests separately for each SOA using a Bonferroni correction leading to an adjusted alpha level αcorr = 0.05/3. For the main study, we aimed to
replicate the effect of the pilot by means of a one- tailed t test for the first SOA (192 ms) and on data averaged across the first three SOAs (192 ms to 275 ms).
3.1
|
Spectral analysis
The time courses of model parameters sampled across SOAs in the main study were obtained separately for each participant and validity condition. These time courses were then averaged across participants and detrended (e.g., Fiebelkorn et al., 2013, 2018; Huang & Luo, 2020; Huang et al., 2015; Re et al., 2019; Song et al., 2014) to elimi-nate both the DC component and slow trends which would otherwise dominate the first frequency bin (note that the observed amplitude peaks were also present without de-trending as can be seen in Figure S5 in the Supporting Information). Because g values are numerically smaller than sd values, each linearly detrended time course was z- scaled by subtracting the mean and dividing by the
standard deviation across time points (i.e., SOAs) to adjust for these general differences in numerical magnitudes. As a result, spectral amplitudes provided by the FFT are com-parable for g and sd estimates. We subsequently analyzed the resulting time courses with an FFT yielding amplitude values for 10 frequencies ranging from 1.2 to 12 Hz with a frequency resolution of 1.2 Hz.
We also conducted an exploratory analysis in which valid and invalid trials were collapsed before mixture modeling and subsequent spectral analysis, leading to 192 instead of 96 trials per mixture model.
For statistical testing, we performed permutation tests to generate a spectral amplitude distribution under the null hy-pothesis that there is no temporal structure (within or across validity conditions, respectively). A total of 10,000 permuted datasets were created by shuffling the SOA labels in the origi-nal dataset at the single trial level within participants and valid-ity conditions (or collapsed across validvalid-ity for the exploratory analysis). Subsequently, using the same procedures as for the original data, mixture model parameters were estimated for each participant, averaged across participants, preprocessed, and then analyzed with an FFT. We repeated this procedure for each permuted dataset, resulting in a probability distribu-tion of spectral amplitudes under the null hypothesis. To test for significant rhythms, the observed amplitude in each fre-quency bin was then compared to this probability distribution. To correct for multiple comparisons, a Bonferroni cor-rection of the alpha level was applied to control for the 10 tests across frequencies in the preregistered analysis and the exploratory analysis, leading to a corrected alpha level of αcorr = 0.05/10 = 0.005. Thus, the observed amplitudes were
compared to the 0.995- Quantile of the distribution obtained from the permuted data.
For significant amplitude peaks, an additional phase anal-ysis was conducted to test if the phase at that frequency was consistent across participants. Unlike the analysis of spectral amplitude, which was based on an FFT of the grand- averaged parameter time courses, the analysis of phase was based on FFTs computed separately for each single participant's de-trended and z- scaled time course. A Rayleigh- test was used to test for significant phase concentration against the null hy-pothesis of a uniform phase distribution (Pewsey et al., 2013; Watson & Williams, 1956).
4
|
RESULTS
Data and analysis scripts are publicly available (see Data Availability Statement). The analysis is focused on the mixture model parameters g and sd. Corresponding time courses and spectral analyses of mean absolute errors are displayed in Figures S2 and S4 in the Supporting Information.
4.1
|
Pilot experiment
Mixture model parameters g and sd are displayed in the Supporting Information, Figure S3. The guessing pa-rameter g was lower in the valid than in the invalid con-dition. Two- tailed paired t tests corrected for multiple comparisons showed a significant difference only for 192 ms, that is, the longest cue- target SOA tested (125 ms:
t(13) = −1.45, p = .17; 158 ms: t(13) = −0.27, p = .80;
192 ms: t(13) = −3.90, p = .002). For the precision pa-rameter sd, none of the SOAs showed a significant differ-ence (125 ms: t(13) = 1.28, p = .22; 158 ms: t(13) = 0.69,
p = .50; 192 ms: t(13) = 1.50, p = .16).
Based on these results, 192 ms was selected as the shortest SOA for the main study.
4.2
|
Main study
4.2.1
|
Guessing parameter g
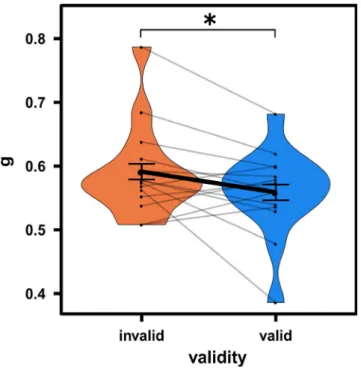
The guessing parameter g at the 192 ms SOA only showed a tendency of being lower in valid compared to invalid tri-als (one- tailed t test: t(13) = −1.46, p = .08). When merg-ing the first three SOAs covermerg-ing a time window of 83 ms from 192 to 275 ms after cue onset, we found a significantly lower g in valid compared to invalid trials (one- tailed t test:
t(13) = −1.86, p = .04, see Figure 2).
In the exploratory analysis, an FFT of the g time course, col-lapsed across validity conditions, revealed a peak in the ampli-tude spectrum at 4.8 Hz (p = .0009, maintained after Bonferroni correction; Figure 3b). At this frequency, a Rayleigh- test showed marginally significant phase- consistency across partic-ipants (R = 0.46, p = .051; Figure 3d).
In the preregistered analysis, an FFT of the g time courses (Figure 3a), computed separately for valid and invalid trials, also revealed a peak in the amplitude spectrum at 4.8 Hz in the invalid condition (p = .018; Figure 3b). However, this peak was not maintained after Bonferroni correction (i.e., corrected alpha level of α = 0.005; Figure 3b). A Rayleigh- test found significant phase- consistency across partici-pants for the 4.8 Hz bin in the invalid condition (R = 0.46,
p = .047).
4.2.2
|
Precision parameter sd
Precision sd was not significantly lower in valid than in in-valid trials, neither at the first SOA (192 ms; one- tailed t test:
t(13) = 0.26, p = .60), nor when the first three SOAs (192 to
275 ms) were merged (one- tailed t test: t(13) = 0.03, p = .51). In the exploratory analysis, an FFT of the sd time course, collapsed across validity conditions, did not yield any
significant amplitude peaks (but note the peak at 9.6 Hz in Figure 4b).
In the preregistered analysis, an FFT of the sd time courses (Figure 4a), computed separately for valid and in-valid trials, revealed significant peaks in the amplitude spec-trum at 9.6 Hz in the invalid condition (p = .002, maintained after Bonferroni correction) and at 10.8 Hz in the valid con-dition (p = .038, not maintained after Bonferroni correction; Figure 4b). For both peaks, Rayleigh- tests found significant phase- consistency across participants (9.6 Hz in invalid con-dition: R = 0.47, p = .045; see Figure 4d; 10.8 Hz in valid condition: R = 0.46, p = .047).
5
|
DISCUSSION
We tested the hypothesis that perceptual and attentional rhythms are better characterized as oscillations in spatial res-olution than as an alternating succession of perception during "perceptual snapshots" and guessing during "blind gaps." To this end, we used an exogenous cueing task and dense sam-pling of cue- target SOAs (similar to Landau & Fries, 2012). Importantly, participants reported the position of a small gap in a Landolt ring in a continuous report task, allowing us to estimate their precision separately from guessing (Suchow et al., 2013). We expected either precision or guessing to
oscillate at a frequency in the theta range, and in counter- phase for valid and invalid cues. Instead, we found a theta rhythm (4.8 Hz) for the guessing parameter for data collapsed across both cueing conditions, which was readily evident for data collapsed across both cueing conditions but was also present in invalid trials in particular, and an alpha rhythm (9.6 Hz) for the precision parameter, mostly for invalid trials.
5.1
|
Exogenous cueing of spatial attention
In order to induce covert shifts of spatial attention, we used a cueing procedure with exogenous, uninformative cues (i.e., 50% validity). Using such a cue, numerous studies have dem-onstrated improved performance for valid compared to inva-lid trials at short SOAs, indicating a transient and automatic shift of attention (Carrasco, 2011). Indeed, we found a similar validity effect in the form of reduced guessing at early SOAs between 192 ms in the pilot study to 275 ms in the main study. The validity effect might have been delayed in the main study because the minimal SOA was longer and SOAs were much longer on average compared to the pilot. Several studies have demonstrated that the range of tested SOAs can affect participants’ temporal expectations, which in turn can affect the latency even of "automatic," exogenous cueing ef-fects (Lamy, 2005; Milliken et al., 2003). Importantly, while the validity effect itself was only transient, as expected with exogenous cues, the cue's main purpose was a temporal and spatial reset of the ongoing attentional rhythm. Thus, while the transient validity effect demonstrates the cue's effective-ness, we were most interested in sustained rhythmicities in performance following this reset.
5.2
|
Attentional theta rhythm
As predicted, we found a strong rhythmic fluctuation across SOAs in performance with a frequency of 4.8 Hz (Figure 3). A theta rhythm in behavioral performance has been attrib-uted to a rhythm in the deployment of attention (Dugué & VanRullen, 2017; VanRullen, 2016) resulting from the suc-cession of moments of sampling at the attended location and moments of suppressed sampling, providing windows of opportunity for shifting covert or overt attention to a new location. According to the “Rhythmic Theory of Attention” (Fiebelkorn & Kastner, 2019), the purpose of this temporal organization is to resolve potential conflicts between sensory and (oculo- )motor functions.
We found this theta rhythm only for the guessing parame-ter and, contrary to our expectation, the rhythm was strongest when data from valid and invalid trials were collapsed. The latter finding indicates that the theta rhythm was not in anti- phase at valid and invalid locations, in which case the two
FIGURE 2 Main study; validity effect across the first three
SOAs for guessing parameter g. Error bars indicate standard errors according to Morey (2008). Asterisk indicates p < .05. Small black dots indicate single participant means. Gray lines connect dots of the same participants across validity conditions. Colored distributions indicate g distribution within conditions.
rhythms should have canceled out when collapsed. This is particularly surprising given that Landau and Fries (2012), using a similar exogenous cueing procedure, found antipha-sic performance rhythms for valid and invalid trials, indicat-ing rhythmic attentional reorientindicat-ing between both locations. However, while we could not confirm this antiphasic pattern, tentative evidence for reorienting was provided by the finding that the theta rhythm was stronger in invalid than in valid trials. While only the analysis of both conditions combined yielded a rhythm strong enough to survive the severe cor-rection for multiple (i.e., 10- fold) tests, the invalid condition also showed a pronounced rhythm (p = .018, uncorrected) and phase- concentration, while the valid condition clearly did not. This result is, in fact, in line with previous findings: performance on invalid trials critically requires reorient-ing attention away from the cued to the non- cued location, whereas no such reorienting is required in valid trials (Dugué et al., 2016; Senoussi et al., 2019). As such reorienting is only possible during the windows of opportunity provided by certain phases of the attentional theta rhythm (Fiebelkorn & Kastner, 2019), performance is phase- locked to this clock-ing rhythm. Thereby, when sampled across many trials, this phase- locking is expected to yield a rhythmic fluctuation of performance, stronger in the invalid condition. Hence, we argue that our data are indicative of a periodic reorienting of spatial attention.
5.3
|
Perceptual alpha rhythm
In addition to the theta rhythm, we found a significant rhythm in the precision parameter at a frequency of 9.6 Hz for invalid trials (Figure 4). Such an alpha rhythm is frequently found in behavioral studies as well as in studies on the impact of ongo-ing brain rhythms on perceptual performance and has been in-terpreted as a perceptual rather than as an attentional rhythm (see VanRullen, 2016, for a review). Dugué and VanRullen (2017) have proposed that it reflects the occipital cortex’ “nat-ural” sampling rhythm, meaning that the rhythm persists even in the absence of direct sensory stimulation and without at-tentional requirements (Rosanova et al., 2009). Furthermore, they have proposed that the alpha rhythm can exist alongside
with the attentional theta rhythm in tasks that do require de-ployment of attention. Specifically, they assume that theta- rhythmic feedback from higher order (attentional) areas to the occipital cortex resets the occipital alpha rhythm, thereby inducing a theta rhythm in this area as well. Consequently, the occipital theta and alpha rhythms are expected to be phase- coupled. This reasoning explains not only why we found evi-dence for both rhythms, but also the prevalence of the alpha rhythm in invalid trials: if attentional reorienting required in invalid trials is phase- locked to the attentional theta rhythm (Fiebelkorn & Kastner, 2019), and if the perceptual alpha rhythm in turn is reset by and hence phase- coupled to the theta rhythm, performance in invalid trials is expected to fluc-tuate at an alpha frequency (Senoussi et al., 2019).
While previous theories on perceptual rhythms (VanRullen, 2016) have related rhythmic fluctuations in behavioral performance to fluctuations of a perceptual threshold, the nature of this threshold has not been clearly specified: does it imply a succession of perceptual snap-shots and blind gaps, or a succession of moments with varying precision, i.e., spatial resolution? This question would have been difficult to answer with conventional forced- choice discrimination tasks, where both mecha-nisms could yield the same performance. By contrast, the continuous report task in combination with a stimulus that specifically taxes spatial resolution (Anton- Erxleben & Carrasco, 2013; Gobell & Carrasco, 2005; Yeshurun & Carrasco, 1999) makes it possible to compare guessing and precision parameters as proxies for either mechanism. Our finding of an alpha rhythm in the precision parame-ter, but not in the guessing parameparame-ter, supports the idea of a fluctuation in spatial resolution. Only when tested in a forced- choice task, such a gradual variation in resolution gives rise to a dichotomous pattern of correct and incorrect responses, depending on whenever the current resolution is sufficient or insufficient for the task at hand. Thus, while numerous studies have demonstrated rhythms in forced- choice detection (Dugué, McLelland, et al., 2015; Dugué & VanRullen, 2014; Dugué Xue & Carrasco, 2017; Fiebelkorn et al., 2013; Landau & Fries, 2012) and discrimination per-formance (Dugué et al., 2016; Senoussi et al., 2019), we provide first evidence for the underlying mechanism.
FIGURE 3 Main study; results for guessing parameter g. Note that colored lines show analysis results split by validity while gray lines
show results collapsed across validity. Error bars indicate standard errors according to Morey (2008). (a) time course of g across SOAs. (b) FFT amplitude spectra. Dark shaded area indicates the 0.95- Quantile of the permutation test, corresponding to an uncorrected alpha level of 0.05. Light shaded areas indicate the Bonferroni- corrected alpha level. Asterisk indicates the 4.8 Hz peak, significant after Bonferroni correction. (c) Histogram of the amplitude distribution for the significant 4.8 Hz bin obtained by repeating all analyses steps on 10,000 permuted datasets (SOA labels were shuffled within participants). Dark gray dashed line indicates the uncorrected alpha level, light dashed line indicates the Bonferroni- corrected alpha level. The black solid line indicates the observed amplitude value. (d) Polar plot for single participant FFT results for the 4.8 Hz bin (collapsed across validity). Black arrows indicate single participant's amplitude (length of the vector) and phase (direction of the vector). Note that single participant data were preprocessed in the same way as the grand average time courses. (e) Detrended grand average time course collapsed across validity (gray line). The black line represents a sinusoidal fit with a fixed frequency of 4.8 Hz (R2 = 0.56).
Our interpretation assumes that the attentional spotlight was anchored at the target positions, rhythmically alternating only between them, but not exploring the space around the target locations. We argue that this interpretation is the most plausible given our specific stimulus configuration, which in-volved no spatial uncertainty (e.g., due to the placeholders for the target positions and the absence of distractors), because eliminating spatial uncertainty has been shown to narrow the attentional focus compared to setups with high spatial uncer-tainty (Herrmann et al., 2010). Nonetheless, we cannot rule out the possibility that alpha- rhythmic fluctuations of preci-sion resulted from a rhythmic exploration of the space sur-rounding the target positions. This alternative interpretation would be consistent with studies demonstrating electrophysi-ological indicators of dynamic attentional exploration in ma-caques (Di Bello et al., 2020; Gaillard & Ben Hamed, 2020; Gaillard et al., 2020). Future studies need to clarify whether rhythmicities in precision or in the instantaneous position of the attentional spotlight are responsible for the observed rhythmic fluctuations in the precision parameter.
5.4
|
Distinct contributions of
alpha and theta rhythms to visual sampling
The current finding that the attentional theta and perceptual alpha rhythm coexist and concurrently shape our perceptual performance is also supported by other theories (Fiebelkorn & Kastner, 2019), neuronal studies (Fiebelkorn et al., 2018), and behavioral studies (Senoussi et al., 2019; Tomassini et al., 2017). Dugué and VanRullen (2017) have proposed that the occipital cortex samples the environment at an alpha frequency (i.e., the perceptual rhythm), while the deploy-ment of attention superimposes a theta rhythm through pe-riodic feedback (i.e., the attentional rhythm) leading to a phase- coupling of both rhythms. While our current study cannot provide evidence for the phase- coupling aspect of this theory, it can still shed light on the distinct contributions of the two rhythms: first, alpha- rhythmic perceptual sampling reflects fluctuations in spatial resolution (see Figure 5a, left column). Second, when attention is deployed, the at-tentional theta rhythm (Figure 5a, center column) provides
periodic enhancement of spatial resolution that is superim-posed on and phase- coupled to the alpha rhythm (Dugué & VanRullen, 2017). Such an attention- induced improvement of spatial resolution has indeed been demonstrated by nu-merous studies (Anton- Erxleben & Carrasco, 2013; Gobell & Carrasco, 2005; Yeshurun & Carrasco, 1999), albeit with-out testing for rhythmicities in this improvement. We specu-late that the resulting compound rhythm comprises favorable phases with maximal spatial resolution (Figure 5a, right col-umn, shaded regions), specifically when the favorable phases of the theta and alpha rhythms coincide. Depending on the task demands for spatial resolution, unfavorable phases may render spatial resolution insufficient for performing the task, requiring the observer to guess. In sum, our results are able to characterize the two rhythms proposed by Dugué and VanRullen (2017), indicating that both rhythms concurrently contribute to environmental sampling characterized by fluc-tuations in spatial resolution, arguing against a strict succes-sion of perceptual snapshots and blind gaps.
Accordingly, our account implies that different task de-mands can give rise to different patterns of performance. If a task makes low demands for spatial resolution and thus at-tentional enhancement is not necessary for performing the task (Figure 5b, left column), spatial resolution is expected to fluctuate predominantly at an alpha rhythm. However, when demands for spatial resolution are so high that addi-tional theta- rhythmic attenaddi-tional enhancement is necessary (Figure 5b, right column), guessing is expected to fluctuate predominantly at a theta rhythm. For the kind of task used in the present study, which makes intermediate demands for spatial resolution (Figure 5b, middle column), both an alpha rhythm in spatial resolution and a theta rhythm in guessing are expected. Thus, task demands might be a critical factor that determines which of either rhythm will be predominant.
These predictions are supported by Dugué et al. (2017), who found a theta behavioral rhythm for a difficult conjunc-tion search and an alpha rhythm for the easier feature search task. Likewise, Chen et al. (2017) observed a shift from lower to higher frequency oscillations with decreasing task demands. Importantly, the predicted effect of task demands on the predominant frequency can be found across numer-ous studies using a great variety of tasks. Specifically, studies
FIGURE 4 Main study; results for precision parameter sd. Note that colored lines show analysis results split by validity while gray lines
show results collapsed across validity. Error bars indicate standard errors according to Morey (2008). (a) time course of sd across SOAs. (b) FFT amplitude spectra. Dark shaded area indicates the 0.95- Quantile of the permutation test, corresponding to an uncorrected alpha level of 0.05. Light shaded areas indicate the Bonferroni- corrected alpha level. Asterisk indicates the 9.6 Hz peak, significant after Bonferroni correction. (c) Histogram of the amplitude distribution for the 9.6 Hz bin in the invalid condition obtained by repeating all analyses steps on 10,000 permuted datasets (SOA labels were shuffled within participants and validity condition). Dark gray dashed line indicates the uncorrected alpha level, light dashed line indicates the Bonferroni- corrected alpha level. The orange solid line indicates the observed amplitude value. (d) Polar plot for single participant FFT results for the 9.6 Hz bin in the invalid condition. Black arrows indicate single participant's amplitude (length of the vector) and phase (direction of the vector). Note that single participant data were preprocessed in the same way as the grand average time courses. (e) Detrended grand average time course for the invalid condition (orange line). The black line illustrates a sinusoidal fit with a fixed frequency of 9.6 Hz (R2 = 0.52).
using difficult tasks, as indicated by low accuracy (50 to 70%), have reported mostly theta- rhythmic fluctuations of perfor-mance (Drewes et al., 2015; Dugué et al., 2017; Fiebelkorn et al., 2013; Hogendoorn, 2016; Landau & Fries, 2012; Re
et al., 2019). Studies using tasks with intermediate difficulty (70 to 80% accuracy) have been less consistent, with some reporting only an alpha rhythm (Dugué & VanRullen, 2014), only a theta rhythm (Benedetto et al., 2016; Chen et al., 2017;
FIGURE 5 Tentative model of theta- rhythmic attentional enhancement of the perceptual alpha rhythm, integrating the present findings and
the model of rhythmic attentional exploration by Dugué and VanRullen (2017). (a) The attentional theta rhythm (middle) continuously modulates the perceptual alpha rhythm (right) through rhythmic enhancement. This modulation results in a compound rhythm (right) which then benefits from favorable moments with enhanced spatial resolution (purple- shaded areas). (b) The spatial resolution provided by this compound rhythm yields different patterns of behavioral performance depending on task demands for spatial resolution (left column: Easy; center column: Intermediate; right column: Difficult). Top row: Fluctuations in spatial resolution under three different task demands (horizontal line). Dark shaded regions indicate moments with sufficient resolution; light shaded regions indicate moments with insufficient resolution in which observers need to guess. Middle row: this interaction of the compound rhythm and task demands leads to different rhythmicities in accuracy time courses. Bottom row: Spectral analysis performed on these time courses will yield different spectral peaks: A predominant alpha rhythm under low task demands (left), no clear dominance of either rhythm for intermediate task demands (center), and a predominant theta rhythm under high task demands (right).
Dugué et al., 2015, 2016; Fiebelkorn et al., 2018; Tomassini et al., 2015), and some reporting both rhythms (Senoussi et al., 2019; Tomassini et al., 2017). By contrast, studies using easy tasks (accuracy > 80%), have reported mostly alpha- rhythmic fluctuations of performance (Chen et al., 2017; Dugué et al., 2017; Song et al., 2014). Thus, both the present findings and extant literature strongly suggest that the impact of the theta and alpha rhythms on behavioral performance is determined by task demands.
5.5
|
Outlook for future studies
Our elaboration on the model of rhythmic attentional explora-tion (Dugué & VanRullen, 2017) predicts that task demands determine which rhythm will be dominant in behavioral per-formance: alpha will be dominant under low demands for spatial resolution, while theta will be dominant under high demands (Figure 5). While a manipulation of task demands was beyond the scope of the present study, a systematic ma-nipulation of task demands in future studies would make it possible to test this prediction directly.
The current study is limited in that neuronal rhythms are inferred from the time course of behavioral performance rather than from neural activity. Thus, converging evidence from EEG/MEG studies using the same continuous report task as used here could help substantiating our findings, specifically by localizing the sources of these rhythms (see Dugué & VanRullen, 2017; Fiebelkorn et al., 2018; Helfrich et al., 2018, for candidate areas) and providing evidence for cross- frequency phase- coupling between the alpha and theta rhythm (e.g., see Gomez- Ramirez et al., 2011; Wilson & Foxe, 2020). Furthermore, application of TMS or tACS could provide evidence for a causal link between neuronal rhythms and spatial resolution (Dugué et al., 2011, 2019).
Furthermore, while the present study was designed for an FFT- based spectral analysis, it lacked the temporal resolution necessary for a time- resolved analysis (see Song et al., 2014). In future studies, it would be valuable to adapt this design to shed light on the temporal evolution of the observed alpha and theta rhythms. Moreover, it would be interesting to inves-tigate trial- by- trial dependencies and whether the observed oscillations in mixture model parameters only occur in cases where preceding trials contained a target at the same target location (Ho et al., 2019).
6
|
CONCLUSION
We were able to further characterize the distinct roles of the two most frequently reported visual sampling rhythms, i.e., the attentional theta and the perceptual alpha rhythm (Dugué & VanRullen, 2017; Fiebelkorn & Kastner, 2019). Specifically,
the model by Dugué and VanRullen (2017) suggests that our results can be interpreted as evidence that the perceptual alpha rhythm reflects fluctuations in spatial resolution, while the at-tentional theta rhythm provides periodic enhancement of this resolution. Both rhythms support environmental sampling through fluctuating spatial resolution, speaking against a strict succession of perceptual snapshots and blind gaps.
ACKNOWLEDGEMENTS
This study was supported by an ANR- DFG grant to Niko Busch (BU 2400/8- 1) and Laura Dugué (J18P08ANR00). We would like to thank Teresa Berther, Davina Hahn, Louisa Henkels, Annika Herbst, and Johanna Rehder for help with data acquisition.
CONFLICT OF INTEREST
The authors declare no competing financial interests.
AUTHOR CONTRIBUTIONS
RM conceived and designed the experiments, performed the experiments, analyzed the data, prepared figures and/or ta-bles, authored or reviewed drafts of the paper, and approved the final draft. NAB conceived and designed the experiments, authored or reviewed drafts of the paper, and approved the final draft. LD conceived and designed the experiments, au-thored or reviewed drafts of the paper, and approved the final draft.
PEER REVIEW
The peer review history for this article is available at https:// publo ns.com/publo n/10.1111/ejn.15154.
DATA AVAILABILITY STATEMENT
The preregistration can be found at aspredicted.org (#24120 available at https://aspre dicted.org/v37gr.pdf). Data are available through an Open Science Framework repository (https://osf.io/de4bu). Scripts to reproduce all reported anal-yses and figures are available through a Github repository (http://www.github.com/remic hel/RAPsc ripts).
ORCID
René Michel https://orcid.org/0000-0002-8238-8613
Laura Dugué https://orcid.org/0000-0003-3085-1458
Niko A. Busch https://orcid.org/0000-0003-4837-0345
REFERENCES
Agostinelli, C., & Lund, U. (2017). R package circular: Circular sta-tistics (version 0.4- 93). Department of Environmental Sciences, Informatics and Statistics, Ca'Foscari University, Department of Statistics, California Polytechnic State University.
Anton- Erxleben, K., & Carrasco, M. (2013). Attentional enhancement of spatial resolution: Linking behavioural and neurophysiological evidence. Nature Reviews Neuroscience, 14(3), 188– 200.
Asplund, C. L., Fougnie, D., Zughni, S., Martin, J. W., & Marois, R. (2014). The attentional blink reveals the probabilistic nature of discrete conscious perception. Psychological Science, 25(3), 824– 831.
Benedetto, A., Spinelli, D., & Morrone, M. C. (2016). Rhythmic modulation of visual contrast discrimination triggered by action.
Proceedings of the Royal Society B: Biological Sciences, 283(1831),
20160692.
Bergson, H. (1911). Creative evolution. Bolt.
Brainard, D. H. (1997). The psychophysics toolbox. Spatial Vision,
10(4), 433– 436.
Busch, N. A., Dubois, J., & VanRullen, R. (2009). The phase of on-going EEG oscillations predicts visual perception. The Journal of
Neuroscience, 29(24), 7869– 7876.
Carrasco, M. (2011). Visual attention: The past 25 years. Vision
Research, 51(13), 1484– 1525.
Chen, A., Wang, A., Wang, T., Tang, X., & Zhang, M. (2017). Behavioral oscillations in visual attention modulated by Task diffi-culty. Frontiers in Psychology, 8(SEP):1– 9.
De Clercq, A., Crombez, G., Buysse, A., & Roeyers, H. (2003). A sim-ple and sensitive method to measure timing accuracy. Behavior
Research Methods, Instruments, and Computers, 35(1), 109– 115.
Di Bello, F., Hassen, B. H., Astrand, S., & Ben Hamed, S. (2020). Selection and suppression of visual informa-tion in the macaque prefrontal cortex. bioRxiv. https://doi. org/10.1101/2020.03.25.007922
Drewes, J., Zhu, W., Wutz, A., & Melcher, D. (2015). Dense sam-pling reveals behavioral oscillations in rapid visual categorization.
Scientific Reports, 5, 16290.
Dugué, L., Beck, A. A., Marque, P., & VanRullen, R. (2019). Contribution of FEF to attentional periodicity during visual search. A TMS study. Eneuro, 6(3), 1– 10.
Dugué, L., Marque, P., & VanRullen, R. (2011). The phase of ongo-ing oscillations mediates the causal relation between brain exci-tation and visual perception. The Journal of Neuroscience, 31(33), 11889– 11893.
Dugué, L., Marque, P., & VanRullen, R. (2015). Theta oscillations modulate attentional search performance periodically. Journal of
Cognitive Neuroscience, 27(5), 945– 958.
Dugué, L., McLelland, D., Lajous, M., & VanRullen, R. (2015). Attention searches nonuniformly in space and in time. Proceedings
of the National Academy of Sciences of the United States of America, 112(49), 15214– 15219.
Dugué, L., Roberts, M., & Carrasco, M. (2016). Attention reorients pe-riodically. Current Biology, 26(12), 1595– 1601.
Dugué, L., & VanRullen, R. (2014). The dynamics of attentional sam-pling during visual search revealed by Fourier analysis of periodic noise interference. Journal of Vision, 14(2), 1– 15.
Dugué, L., & VanRullen, R. (2017). Transcranial magnetic stimulation reveals intrinsic perceptual and attentional rhythms. Frontiers in
Neuroscience, 11, 154.
Dugué, L., Xue, A. M., & Carrasco, M. (2017). Distinct perceptual rhythms for feature and conjunction searches. Journal of Vision,
17(3), 1– 15.
Fiebelkorn, I. C., & Kastner, S. (2019). A rhythmic theory of attention.
Trends in Cognitive Sciences, 23(2), 87– 101.
Fiebelkorn, I. C., Pinsk, M. A., & Kastner, S. (2018). A Dynamic in-terplay within the frontoparietal network underlies rhythmic spatial attention. Neuron, 99(4), 842– 853.
Fiebelkorn, I. C., Saalmann, Y. B., & Kastner, S. (2013). Rhythmic sampling within and between objects despite sustained attention at a cued location. Current Biology, 23(24), 2553– 2558.
Gaillard, C., & Ben Hamed, S. (2020). The neural bases of spatial at-tention and perceptual rhythms. European Journal of Neuroscience, 1– 15. https://doi.org/10.1111/ejn.15044
Gaillard, C., Hassen, B. H. S., Di Bello, F., Bihan- Poudec, Y., VanRullen, R., & Ben Hamed, S. (2020). Prefrontal attentional saccades explore space rhythmically. Nature Communications, 11(1), 1– 13.
Gobell, J., & Carrasco, M. (2005). Attention alters the appearance of spatial frequency and gap size. Psychological Science, 16(8), 644– 651.
Gomez- Ramirez, M., Kelly, S. P., Molholm, S., Sehatpour, P., Schwartz, T. H., & Foxe, J. J. (2011). Oscillatory sensory selection mecha-nisms during intersensory attention to rhythmic auditory and visual inputs: A human electrocorticographic investigation. Journal of
Neuroscience, 31(50), 18556– 18567.
Harrison, G. W., Rajsic, J., & Wilson, D. E. (2016). Object- substitution masking degrades the quality of conscious object representations.
Psychonomic Bulletin and Review, 23(1), 180– 186.
Helfrich, R. F., Fiebelkorn, I. C., Szczepanski, S. M., Lin, J. J., Parvizi, J., Knight, R. T., & Kastner, S. (2018). Neural mechanisms of sus-tained attention are rhythmic. Neuron, 99(4), 854– 865.
Herrmann, K., Montaser- Kouhsari, L., Carrasco, M., & Heeger, D. J. (2010). When size matters: Attention affects performance by con-trast or response gain. Nature Neuroscience, 13(12), 1554– 1561. Ho, H. T., Burr, D. C., Alais, D., & Morrone, M. C. (2019). Auditory
perceptual history is propagated through alpha oscillations. Current
Biology, 29(24), 4208– 4217.e3.
Hogendoorn, H. (2016). Voluntary saccadic eye movements ride the at-tentional rhythm. Journal of Cognitive Neuroscience, 28(10), 1625– 1635. https://doi.org/10.1162/jocn_a_00986
Huang, Q., & Luo, H. (2020). Saliency- based rhythmic coordination of perceptual predictions. Journal of Cognitive Neuroscience, 32(2), 201– 211.
Huang, Y., Chen, L., & Luo, H. (2015). Behavioral oscillation in prim-ing: Competing perceptual predictions conveyed in alternating theta- band rhythms. The Journal of Neuroscience, 35(6), 2830– 2837. Lakatos, P., O'Connell, M. N., Barczak, A., Mills, A., Javitt, D. C., &
Schroeder, C. E. (2009). The leading sense: Supramodal control of neurophysiological context by attention. Neuron, 64(3), 419– 430. Lamy, D. (2005). Temporal expectations modulate attentional capture.
Psychonomic Bulletin and Review, 12(6), 1112– 1119.
Landau, A. N., & Fries, P. (2012). Attention samples stimuli rhythmi-cally. Current Biology, 22(11), 1000– 1004.
Mathewson, K. E., Gratton, G., Fabiani, M., Beck, D. M., & Ro, T. (2009). To see or not to see: Prestimulus α phase predicts visual awareness. The Journal of Neuroscience, 29(9), 2725– 2732. Milliken, B., Lupiáñez, J., Roberts, M., & Stevanovski, B. (2003).
Orienting in space and time: Joint contributions to exogenous spatial cuing effects. Psychonomic Bulletin and Review, 10(4), 877– 883. Morey, R. D. (2008). Confidence intervals from normalized data: A
cor-rection to Cousineau (2005). Tutorials in Quantitative Methods for
Psychology, 4(2), 61– 64.
Pewsey, A., Neuhäuser, M., & Ruxton, G. D. (2013). Circular statistics
in R, (1st ed.). Oxford University Press.
Re, D., Inbar, M., Richter, C. G., & Landau, A. N. (2019). Feature- based attention samples stimuli rhythmically. Current Biology, 29(4), 693– 699.e4.
Rosanova, M., Casali, A., Bellina, V., Resta, F., Mariotti, M., & Massimini, M. (2009). Natural frequencies of human corticotha-lamic circuits. The Journal of Neuroscience, 29(24), 7679– 7685. Samaha, J., & Postle, B. R. (2015). The speed of alpha- band
oscilla-tions predicts the temporal resolution of visual perception. Current
Biology, 25(22), 2985– 2990.
Senoussi, M., Moreland, J. C., Busch, N. A., & Dugué, L. (2019). Attention explores space periodically at the theta frequency. Journal
of Vision, 19(5), 1– 17.
Song, K., Meng, M., Lin, C., Zhou, K., & Luo, H. (2014). Behavioral os-cillations in attention: Rhythmic α pulses mediated through θ band.
The Journal of Neuroscience, 34(14), 4837– 4844.
Suchow, J. W., Brady, T. F., Fougnie, D., & Alvarez, G. A. (2013). Modeling visual working memory with the MemToolbox. Journal
of Vision, 13(10), 1– 8.
Thaler, L., Schütz, A. C., Goodale, M. A., & Gegenfurtner, K. R. (2013). What is the best fixation target? The effect of target shape on stability of fixational eye movements. Vision Research, 76, 31– 42.
Tomassini, A., Ambrogioni, L., Medendorp, W. P., & Maris, E. (2017). Theta oscillations locked to intended actions rhythmically modulate perception. eLife, 6, 1– 18.
Tomassini, A., Spinelli, D., Jacono, M., Sandini, G., & Morrone, M. C. (2015). Rhythmic oscillations of visual contrast sensitivity synchro-nized with action. The Journal of Neuroscience, 35(18), 7019– 7029. VanRullen, R. (2016). Perceptual cycles. Trends in Cognitive Sciences,
20(10), 723– 735.
VanRullen, R., Carlson, T., & Cavanagh, P. (2007). The blinking spot-light of attention. Proceedings of the National Academy of Sciences
of the United States of America, 104(49), 19204– 19209.
VanRullen, R., & Koch, C. (2003). Is perception discrete or contin-uous? Trends in Cognitive Sciences, 7(5), 207– 213. https://doi. org/10.1016/S1364 - 6613(03)00095 - 0
Watson, A. B., & Pelli, D. G. (1983). Quest: A Bayesian adaptive psy-chometric method. Perception & Psychophysics, 33(2), 113– 120. Watson, G. S., & Williams, E. J. (1956). On the construction of
sig-nificance tests on the circle and the sphere. Biometrika, 43(3/4), 344– 352.
Wilson, T. J., & Foxe, J. J. (2020). Cross- frequency coupling of alpha oscillatory power to the entrainment rhythm of a spatially attended input stream. Cognitive Neuroscience, 11(1– 2), 71– 91.
World Medical Association. (2013). Declaration of Helsinki. Ethical principles for medical research involving human subjects.64th WMA General Assembly, , October 2013.
Yeshurun, Y., & Carrasco, M. (1999). Spatial attention improves perfor-mance in spatial resolution tasks. Vision Research, 39(2), 293– 306.
SUPPORTING INFORMATION
Additional supporting information may be found online in the Supporting Information section.
How to cite this article: Michel R, Dugué L, Busch
NA. Distinct contributions of alpha and theta rhythms to perceptual and attentional sampling. Eur J
Neurosci. 2021;00:1– 15. https://doi.org/10.1111/