1
Supplementary Information
Engineering an in vitro air-blood barrier by 3D bioprinting
Lenke Horváth
1, Yuki Umehara
1, Corinne Jud
1,3, Fabian Blank
2, Alke Petri-
Fink
1, Barbara Rothen-Rutishauser
1*
1 Adolphe Merkle Institute, University of Fribourg, Chemin des Verdiers 4, CH-1700
Fribourg, Switzerland.
2 Department of Respiratory Medicine, Bern University Hospital, CH-3010 Bern,
Switzerland.
3 Current address: Agroscope, Institute for Livestock Sciences ILS, Rte de la Tioleyre 4,
CP 64, CH-1725 Posieux, Switzerland.
Figure S1. Qualitative analysis of cell proliferation following manual seeding and printing of
cells. Representative photomicrographs of A549 epithelial (top panel) and EA.hy926 endothelial cells
(bottom panel) after manual seeding following 10 min and 2 h (first and second column) and printing (2 h; third column). Scale bars are 100 µm.
3
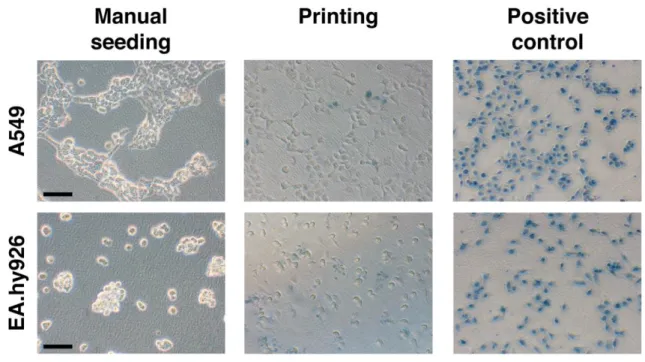
Figure S2. Trypan Blue exclusion test of cell viability. Representative phase contrast micrographs
of epithelial (top panel) and endothelial cells (bottom panel) seeded manually or printed after 24 h in culture. Cells were stained with Trypan Blue for 5 min, and visually examined to determine whether cells take up or exclude the dye. Live cells with intact cell membranes exclude this dye, while dead cells do not. In manual samples cells stained with the dye were rarely observed. Some of printed epithelial cells have taken up the dye. Among printed endothelial cells the amount of dead cells was higher than in the case of epithelial cells. Positive controls (100% dead cells) were prepared by 30 min incubation in 70% ethanol and subsequent staining with Trypan Blue. Scale bars are 100 µm.
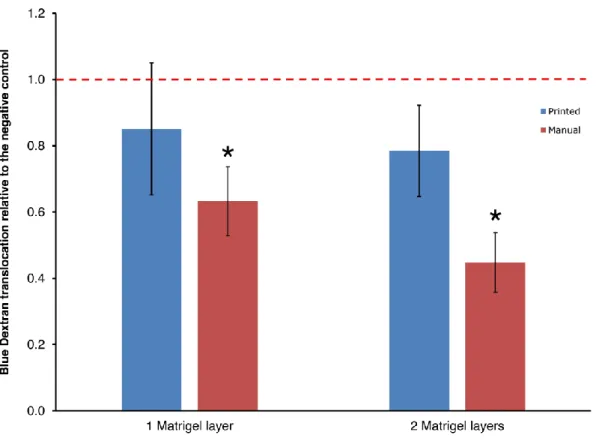
Figure S3. Evaluation of Blue Dextran translocation rate in acellular system. Translocation of
Blue Dextran was assessed on microporous membranes overprinted (
■
) and manually dispersed (■
) with MatrigelTM after 3 days of incubation. The values are shown as fold increase related to thenegative control (insert only; dashed red line). All results are expressed as the mean ± standard deviation (*p < 0.05 in comparison to negative control).
5
Positional repeatability and accuracy of BioFactory
®. In order to get an insight into the
spatial accuracy of the bioprinter (Fig. 1a-b), a multi-layered construct consisting of
alternating horizontal and vertical lines arranged in a circular grid was printed from Nivea
cream on a glass slide. The square shaped pores created at the interception of the lines were
filled with droplets of red food dye (Supplementary Fig. S4a). The cell printer was able to
return to the same coordinates and the dispensed droplets during previous cycles were
overprinted with high (< 5
µm) spatial accuracy. We further printed a higher complexity
multilayer pattern, i.e. the logo of the Adolphe Merkle Institute (Supplementary Fig. S4b). Our
results provide evidence that the BioFactory
®is capable of printing complex patterns without
drifting in either x or y directions.
Figure S4. Digital image of a printed circular scaffold and the logo of Adolphe Merkle Institute
(AMI). (a) A 10 mm diameter circular scaffold was designed in BioCAD software, which was
transformed to a g-code file and was finally printed from Nivea cream and a red food dye on a glass slide. (b) AMI logo was printed in a layer-by-layer fashion from Nivea cream on a glass slide. Scale bars are 2 mm.
7
Movie S1. Time-lapse experiment showing the proliferation of manually seeded endothelial cells
for 72 h. EA.hy926 cells were manually seeded on manually dispersed Matrigel layer. Following cell
adhesion cell confluence was monitored in a cell culture observation device, BioStation CT, starting from the 8th hour up to 72 h cultivation time with image acquisition every 2 hours.
Movie S2. Time-lapse experiment showing the proliferation of bioprinted endothelial cells for
72 h. EA.hy926 cells were printed on a pre-printed layer of Matrigel ECM. Following cell adhesion cell
confluence was monitored in a cell culture observation device, BioStation CT, starting from the 8th hour
up to 72 h cultivation time with image acquisition every 2 hours.
Movie S3. Time-lapse experiment showing the proliferation of manually seeded epithelial cells
for 72 h. A549 cells were manually seeded on manually dispersed Matrigel layer. Following cell
adhesion cell confluence was monitored in a cell culture observation device, BioStation CT, starting from the 8th hour up to 72 h cultivation time with image acquisition every 2 hours.
Movie S4. Time-lapse experiment showing the proliferation of bioprinted epithelial cells for 72 h.
A549 cells were printed on a pre-printed layer of Matrigel ECM. Following cell adhesion cell confluence was monitored in a cell culture observation device, BioStation CT, starting from the 8th hour up to 72 h
cultivation time with image acquisition every 2 hours.
Movie S5. Time-lapse experiment showing the proliferation of manually assembled co-culture of
endothelial and epithelial cells for 72 h. Cells were seeded according to the procedure described in
Methods. Following the co-culture assembly, the cell confluence was monitored in a cell culture observation device, BioStation CT, starting from the 8th hour up to 72 h cultivation time with image
acquisition every 4 hours. The movie was assembled from merged images of phase contrast and fluorescence micrographs. Green fluorescent epithelial cells can be distinguished from the underlying endothelial cell layer (phase contrast).
Movie S6. Time-lapse experiment showing the proliferation of printed co-culture of endothelial
and epithelial cells for 72 h. Cells were seeded according to the printing procedure described in
Methods. Following the co-culture assembly, the cell confluence was monitored in a cell culture observation device, BioStation CT, starting from the 8th hour up to 72 h cultivation time with image
acquisition every 4 hours. The movie was assembled from merged images of phase contrast and fluorescence micrographs. Green fluorescent epithelial cells can be distinguished from the underlying endothelial cell layer (phase contrast).