HAL Id: hal-03115298
https://hal.archives-ouvertes.fr/hal-03115298
Submitted on 20 Jan 2021
HAL is a multi-disciplinary open access archive for the deposit and dissemination of sci-entific research documents, whether they are pub-lished or not. The documents may come from teaching and research institutions in France or abroad, or from public or private research centers.
L’archive ouverte pluridisciplinaire HAL, est destinée au dépôt et à la diffusion de documents scientifiques de niveau recherche, publiés ou non, émanant des établissements d’enseignement et de recherche français ou étrangers, des laboratoires publics ou privés.
microbial food web in spring in the southern Yellow Sea,
China
Yuan Zhao, Yi Dong, Haibo Li, Shiquan Lin, Lingfeng Huang, Tian Xiao,
Gérald Grégori, Li Zhao, Wuchang Zhang
To cite this version:
Yuan Zhao, Yi Dong, Haibo Li, Shiquan Lin, Lingfeng Huang, et al.. Grazing by microzooplankton and copepods on the microbial food web in spring in the southern Yellow Sea, China. Marine Life Science & Technology, 2020, 2 (4), pp.442-455. �10.1007/s42995-020-00047-x�. �hal-03115298�
https://doi.org/10.1007/s42995-020-00047-x RESEARCH PAPER
Grazing by microzooplankton and copepods on the microbial food
web in spring in the southern Yellow Sea, China
Yuan Zhao1,2,7 · Yi Dong1,2,7 · Haibo Li1,2,7 · Shiquan Lin3 · Lingfeng Huang4,5 · Tian Xiao1,2,7 · Gerald Gregori6 ·
Li Zhao1,2,7 · Wuchang Zhang1,2,7
Received: 6 March 2020 / Accepted: 6 May 2020 / Published online: 28 July 2020 © The Author(s) 2020
Abstract
Assessment of microzooplankton and copepods grazing pressure on picoplankton is a key requirement for resolving the microbial food web efficiency. Although microzooplankton grazing on picoplankton has been extensively studied, the impact of microzooplankton on different groups of picoplankton, i.e., heterotrophic bacteria, Synechococcus and picoeukaryotes have rarely been compared. Furthermore, in the very few existing studies there is no consistent evidence of an enhancing or restraining effect of copepods on picoplankton. More studies are needed to improve our understanding of the influence of microzooplankton and copepod on picoplankton. Dilution incubations and copepod addition incubations were performed during a cruise to the southern Yellow Sea on May 16–29, 2007. The bulk grazing of microzooplankton and the calanoid copepod Calanus sinicus on phytoplankton, flagellates and picoplankton was estimated. Stations were divided into either eutrophic or oligotrophic according to the nutrient and biological parameters. Picoplankton comprised a large part of the diet of microzooplankton in the central oligotrophic area, while phytoplankton was the main food of microzooplankton in the coastal eutrophic area. In the central oligotrophic area, microzooplankton preferred grazing on Synechococcus. After copepod addition, ciliate abundance decreased while Synechococcus abundance increased (382%, 64% and 64% at three experimental stations, respectively), indicating strong grazing pressure of microzooplankton on Synechococcus. Our results suggest that Synechococcus might be an essential carbon source the planktonic food web in the oligotrophic waters of southern Yellow Sea.
Keywords Microzooplankton · Dilution incubations · Copepod addition incubations · Ciliate · Picoplankton · Yellow Sea
Introduction
The planktonic microbial food web is composed of microzooplankton, phytoplankton, including flagellates, microphytoplankton, cyanobacteria and picoeukaryotes, heterotrophic prokaryotes (bacteria and archaea, here-after referred to “bacteria”) and virioplankton (Azam et al. 1983; Ducklow 1983). There are complex trophic relationships between these microorganisms (Sherr and Sherr 2008). Planktonic ciliates are often the dominant
microzooplankton (Pierce and Turner 1992) and are well recognized as a key component of many plankton food web models (Baretta et al. 1995; Kishi et al. 2007). Microzoo-plankton can affect picoMicrozoo-plankton either directly by ing or indirectly by feeding on other picoplankton graz-ers, such as heterotrophic nanoflagellates. These grazing activities demonstrate that microzooplankton are critical trophic intermediates in carbon transfer along the trophic pathway and in remineralization processes (Sherr and Sherr 1994). Over the past 30 years, microzooplankton grazing on picoplankton, i.e., heterotrophic bacteria (HB), cyanobacteria Synechococcus (Syn) and photosynthetic picoeukaryotes (PicoE) has been extensively studied (e.g., Callieri et al. 2002; Chen and Liu 2010; Mukhanov et al.
2016; Reckermann and Veldhuis 1997; Šimek et al. 1995; Worden and Binder 2003). However, there are only a few studies that have compared the impact of microzooplank-ton on different groups of picoplankmicrozooplank-ton. When compared
Edited by Chengchao Chen. * Li Zhao
zhaoli@qdio.ac.cn * Wuchang Zhang
wuchangzhang@qdio.ac.cn
with the fluorescently labelled food item method (Livanou et al. 2019), dilution incubations have been more com-monly used to study the bulk grazing of microzooplank-ton on HB, Syn and PicoE (Anderson and Harvey 2019; Brown et al. 1999; Calbet et al. 2008; Kimmance et al.
2007; Morison et al. 2019; Sakka et al. 2000). However, only a few studies using dilution incubations have esti-mated and compared the grazing impact of microzooplank-ton on these groups. Copepods are the dominant meso-zooplankton in most marine pelagic ecosystems (Verity and Paffenhofer 1996). Copepods cannot efficiently graze on the particles smaller than 5 μm and prefer to graze on ciliates, which will consequently indirectly influence pico-plankton and flagellates abundance (Irigoien et al. 2000; Stoecker and Capuzzo 1990; Yang et al. 2019). No con-sistent enhancing or restraining effect of copepod on pico-plankton have been found in the very few existing studies (Böttjer et al. 2010; Burns and Schallenberg 1996; Liu et al. 2005a; Nakamura et al. 1997; Sommer and Sommer
2006; Wetz et al. 2011). Additional studies are therefore needed to improve our understanding of the influence of copepods on picoplankton.
The Yellow Sea (YS) is a temperate marginal sea with a mean depth of 44 m in the northwest Pacific Ocean. The central part of the Yellow Sea is oligotrophic (Zou et al. 2000) and contains a deep trough (maximum depth 87 m). There is a marked seasonal change in the vertical structure of the water column in the YS. Yellow Sea Cold Bottom Water (YSCBW) is formed in the central deep part (> 60 m) during summer due to water column stratification (Hur et al. 1999; Su and Weng 1994; Zhang et al. 2008). The dominant copepod species in YS is Calanus sinicus, which over-summer in the YSCBW (Li et al. 2004; Wang et al. 2003).
Most of the historic and current interest in the YS micro-bial ecosystem has focused on characterizing the dynamics and standing stocks of picoplankton, protozoa and mesozoo-plankton, as well as the factors regulating their variation (Li et al. 2006; Lin et al. 2013; Zhao et al. 2011, 2013). Dilu-tion incubaDilu-tions have been used to study the microzooplank-ton grazing rates on bulk phytoplankmicrozooplank-ton (Sun et al. 2013; Zhang et al. 2002). However, not much is known about the principal prey being consumed by microzooplankton in YS. Assessment of the microzooplankton and copepods grazing pressure on picoplankton is a key point to resolve the micro-bial food web functioning and carbon transfer efficiency. In this paper, we examined the contribution of different pico-plankton groups to the microzoopico-plankton diet, as well as the impact of the dominant copepod, Calanus sinicus, on picoplankton in the southern YS.
Results
Hydrographical conditions and microbial abundances
Temperature and salinity profiles (Fig. 1) indicate higher temperature and lower salinity in surface waters than in deep waters at all sampling stations. There was very small dif-ference (< 2°C) between temperatures at the surface and at 10 m layer, which justified the use of surface water for tem-perature control in the incubation experiments.
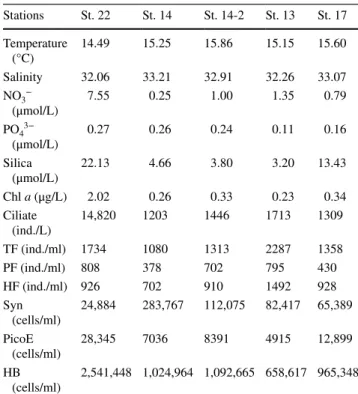
Nutrient and microbial abundance data (Table 1) divided the stations into two categories. Station 22, with higher nutrients (NO3− and Silica) and Chl a
concentra-tions, was considered a eutrophic station. All other sta-tions (13, 14, 14-2 and 17), located at the central YS, were oligotrophic. In general, the eutrophic station had higher numbers of ciliates, HB, PicoE and a lower amount of Syn as compared to the oligotrophic stations (Table 1). At St. 22, ciliate abundance was 14,820 ind./L and was domi-nated by the tintinnid Tintinnopsis beroidea. At the oligo-trophic stations the ciliate composition was characterized by long, conical shaped aloricate forms. The abundance of TF ranged from 1080 ind./ml at oligotrophic station St. 14, to 2287 ind./ml at eutrophic station St. 13. HF was more abundant than PF (Table 1). HB was the most abundant picoplankton at all stations. In eutrophic water, the HB and PicoE were about two- to threefold more abundant than those at oligotrophic stations. Syn abundance was much lower, with only 1/3–1/10 the abundance of that in oligotrophic waters.
Microzooplankton grazing on phytoplankton, flagellates and picoplankton
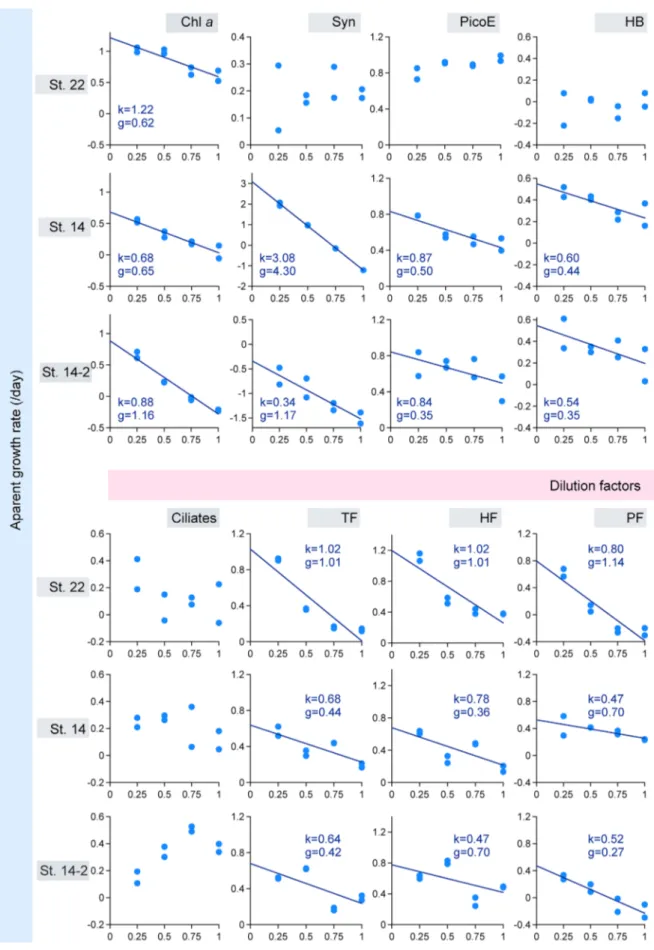
Phytoplankton apparent growth rates estimated from Chl a in dilution incubations had good linear regressions (R2 > 0.8)
with dilution factors (Fig. 2). At eutrophic St. 22, phyto-plankton grew faster than the microzoophyto-plankton grazing (k = 1.22/day, g = 0.62/day), resulting in a Pp value of 0.66
(Table 2); about 2/3 of the phytoplankton production being grazed by microzooplankton. For flagellates, the k and g values of TF were 1.02 and 1.01/day, respectively (Fig. 2), indicating about 99% of TF potential production was being grazed by microzooplankton (Table 2, Pp = 0.99 for TF at St.
22). There was no correlation between picoplankton abun-dance and dilution factor, meaning no microzooplankton grazing rate on picoplankton could be calculated at this sta-tion (Fig. 2). These results indicate that phytoplankton and TF were the main microzooplankton food items in eutrophic water of YS. Grazing pressure on standing stock per day (Pi) was 46% of phytoplankton and 64% of TF. However,
with a much higher biomass being grazed, phytoplankton could account for up to 96.54% of the food intake of ciliates and only 3.46% of food resources was contributed by TF in eutrophic water of YS.
At the oligotrophic stations St. 14 and St. 14-2, almost all the phytoplankton production (97–117%) was grazed
per day (Table 2). For TF, the growth rates (0.64-0.68/day) were higher than grazing (0.42–0.44/day). Only 72–73% of the TF potential production was grazed by microzooplankton (Table 2). Microzooplankton grazing rate on Syn (1.17–4.30/ day) was much higher than on HB (0.35–0.44/day) and PicoE (0.35–0.50/day). Picoplankton played an important role in food intake by microzooplankton. This grazed biomass was largely contributed by Syn (44.4–72.4%). Furthermore, 4.4–9.2% and 23.2–46.5% of the food was PicoE and HB, respectively.
Influence of C. sinicus on phytoplankton, flagellate and picoplankton
At the end of the C. sinicus addition incubation, ciliate abun-dances decreased by 35%, 30% and 54% compared to the con-trol bottles at St. 13, St. 14 and St. 17, respectively (Fig. 3). Chl a concentration increased by 63%, 13% and 23%, respec-tively. HF abundance increased by 22% at St. 13, decreased (7% and 3%) at St. 14 and St. 17, respectively. With respect to picoplankton, Syn abundances showed a consistent increase (382%, 64% and 64% at St. 13, St. 14 and St. 17, respectively) in the copepod containing bottles. However, PicoE and HB abundances showed systematic change (in the range of ± 15%, except for PicoE which increased by 74% at St. 17, Fig. 3).
Discussion
The question of which are the principal preys being con-sumed by microzooplankton was first proposed by Rivkin et al. (1999). Microzooplankton plays a significant role in structuring the microbial food web through its ability of selecting food and displaying rapid responses to changes in food availability. The determination of the relative
Fig. 1 Vertical profiles of temperature (°C), salinity and Chl a concentration (μg/L) at the experimenting stations
Table 1 Initial physical, chemical and biological conditions of 10 m
depth waters
TF total flagellates, PF pigmented flagellates, HF heterotrophic
flag-ellates, Syn Synechococcus, PicoE picoeukaryotes, HB heterotrophic bacteria Stations St. 22 St. 14 St. 14-2 St. 13 St. 17 Temperature (°C) 14.49 15.25 15.86 15.15 15.60 Salinity 32.06 33.21 32.91 32.26 33.07 NO3− (μmol/L) 7.55 0.25 1.00 1.35 0.79 PO43− (μmol/L) 0.27 0.26 0.24 0.11 0.16 Silica (μmol/L) 22.13 4.66 3.80 3.20 13.43 Chl a (μg/L) 2.02 0.26 0.33 0.23 0.34 Ciliate (ind./L) 14,820 1203 1446 1713 1309 TF (ind./ml) 1734 1080 1313 2287 1358 PF (ind./ml) 808 378 702 795 430 HF (ind./ml) 926 702 910 1492 928 Syn (cells/ml) 24,884 283,767 112,075 82,417 65,389 PicoE (cells/ml) 28,345 7036 8391 4915 12,899 HB (cells/ml) 2,541,448 1,024,964 1,092,665 658,617 965,348
grazing rates of microzooplankton is critical for under-standing the patterns of carbon flow through the pelagic food web. Dilution incubation has been used to estimate microzooplankton grazing on HB, Syn and PicoE in previ-ous studies (see Table 3), although most of these studies only focused on particular parts of the picoplankton. The growth and grazing rates obtained in this study were in the range of those previously found in the literature, however, the growth and grazing rate results of Syn presented here are by one of the highest values.
The interactions of microzooplankton grazers with their prey can be summarized in three situations (Umani and Beran 2003; Zoccarato et al. 2016): (a) strong reduction in microphytoplankton and nanoplankton, with no detectable grazing on picoplankton; (b) partial reduction in microphy-toplankton and nanoplankton biomass, with partial grazing impact on picoplankton and (c) microzooplankton directly feed on picoplankton. In the research presented here, the grazing impact of microzooplankton on picoplankton was different under the different trophic environments identi-fied during the cruise. At the YS eutrophic station, micro-zooplankton chose microphytoplankton as their main food source, i.e., situation (a). At the YS oligotrophic stations, microzooplankton could prey on microphytoplankton,
nanoplankton and picoplankton at the same time, i.e., situ-ation (b), but sometimes, the importance of picoplankton could exceed phytoplankton, as reflected by the biomass being grazed (Table 2). The impact of the trophic environ-ment on microzooplankton grazing was also detected in the Mediterranean Sea (Zoccarato et al. 2016). There, in oligotrophic and mesotrophic conditions, microzooplank-ton mostly preyed on heterotrophic prokaryotes (56.7% and 60.6%, respectively), which was different from the data presented here. In an analysis of the global impact of microplanktonic grazers on marine phytoplankton, microzooplankton consumption was found to be the main source of phytoplankton mortality, accounting for up to 67% of the daily phytoplankton growth for the full dataset. Under eutrophicated conditions, the potential production of microphytoplankton exceeded the ingestion rate, while under meso- and eutrophic conditions, the ingestion rate on autotrophic prokaryotes exceeded the potential production (Calbet and Landry 2004).
Among the picoplankton groups, the direct impact of microzooplankton was most pronounced on Syn at oligo-trophic stations, accounting for about 44.4–72.4% of total biomass being grazed. Syn might thus be the fundamental component of the carbon budget in the oligotrophic water
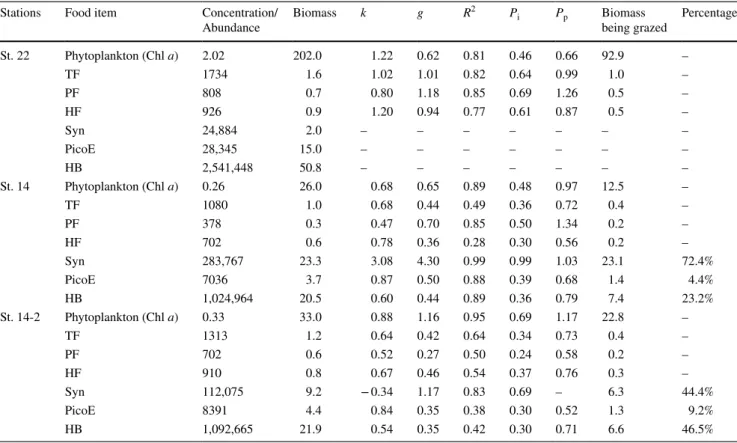
Table 2 Results of dilution incubations
Chl a μg/L, TF total flagellates, PF pigmented flagellates, HF heterotrophic flagellates, abundance: ind./ml, Biomass: μgC/L; Syn Synechococ-cus, PicoE Picoeukaryotes, HB Heterotrophic bacteria, abundance: cells/ml, Biomass: μgC/L; k potential growth rates, /day; g grazing rate by
grazers, /day, Pi grazing pressure on standing stock per day, Pp grazing pressure on primary production per day
Stations Food item Concentration/
Abundance Biomass k g R
2 P
i Pp Biomass
being grazed Percentage St. 22 Phytoplankton (Chl a) 2.02 202.0 1.22 0.62 0.81 0.46 0.66 92.9 – TF 1734 1.6 1.02 1.01 0.82 0.64 0.99 1.0 – PF 808 0.7 0.80 1.18 0.85 0.69 1.26 0.5 – HF 926 0.9 1.20 0.94 0.77 0.61 0.87 0.5 – Syn 24,884 2.0 – – – – – – – PicoE 28,345 15.0 – – – – – – – HB 2,541,448 50.8 – – – – – – – St. 14 Phytoplankton (Chl a) 0.26 26.0 0.68 0.65 0.89 0.48 0.97 12.5 – TF 1080 1.0 0.68 0.44 0.49 0.36 0.72 0.4 – PF 378 0.3 0.47 0.70 0.85 0.50 1.34 0.2 – HF 702 0.6 0.78 0.36 0.28 0.30 0.56 0.2 – Syn 283,767 23.3 3.08 4.30 0.99 0.99 1.03 23.1 72.4% PicoE 7036 3.7 0.87 0.50 0.88 0.39 0.68 1.4 4.4% HB 1,024,964 20.5 0.60 0.44 0.89 0.36 0.79 7.4 23.2% St. 14-2 Phytoplankton (Chl a) 0.33 33.0 0.88 1.16 0.95 0.69 1.17 22.8 – TF 1313 1.2 0.64 0.42 0.64 0.34 0.73 0.4 – PF 702 0.6 0.52 0.27 0.50 0.24 0.58 0.2 – HF 910 0.8 0.67 0.46 0.54 0.37 0.76 0.3 – Syn 112,075 9.2 − 0.34 1.17 0.83 0.69 – 6.3 44.4% PicoE 8391 4.4 0.84 0.35 0.38 0.30 0.52 1.3 9.2% HB 1,092,665 21.9 0.54 0.35 0.42 0.30 0.71 6.6 46.5%
in YS and its variation could affect the carrying capacity of the pelagic food webs.
Data presented here show that microzooplankton did not graze on picoplankton in the eutrophic coastal station and preferred to graze on cyanobacteria in the deep oligotrophic stations. This is the only study to measure microzooplank-ton grazing rates in all groups of picoplankmicrozooplank-ton. Sakka et al. (2000), using the dilution method, found that grazing rates for HB and PicoE were similar to those reported herein, but
the grazing rate for Syn was much lower (Table 3). In a study of grazing rate on HB and Syn in northern Red Sea, micro-zooplankton were found to prefer grazing on HB (Sommer et al. 2002). In a study examining grazing rates on PicoE and Syn in Southern California Bight, microzooplankton were found to prefer grazing on PicoE (Worden and Binder 2003). Therefore, for the first time, data presented in this research demonstrate that microzooplankton have a greater preference for Syn than other picoplankton groups.
Fig. 3 Variation of Chl a concentration and abundances of ciliates, flagellates and picoplankton of the copepod addition experiments.
Chl a Chlorophyll a, μg/L, C ciliates, ind./L, TF total flagellates, ind./
ml, PF pigmented flagellates, ind./ml, HF heterotrophic flagellates,
ind./ml, Syn Synechococcus, cell/ml, PicoE picoeukaryotes, ×10 cell/ ml, HB heterotrophic bacteria, ×10−1 cell/ml. B before incubations,
CA control bottle after incubations, TA copepod addition bottles after
At St. 14, an oligotrophic site, the percentage of the pico-plankton primary production grazed was 103%, 68% and 79% for Syn, PicoE and HB, respectively (Table 2). This suggests a close predator/prey relationship between pico-plankton and microzoopico-plankton in oligotrophic waters and that microzooplankton grazing was potentially a key
controlling factor for the picoplankton biomass. A similar situation was also found in subtropical and sub-Antarctic waters to the east of New Zealand, where picophytoplank-ton (i.e., PicoE and cyanobacteria) were heavily grazed (86–118%) by microzooplankton (Hall et al. 2004).
Table 3 Growth rate (k) and grazing rate (g) of marine picoplankton in various oceanic regions obtained in dilution incubation
– no information, HB Heterotrophic bacteria, PicoE Picoeukaryotes, Syn Synechococcus Region Incubation
time (h) HBk/day g/day Synk/day g/day Pico Ek/day g/day References Kaneohe Bay,
Hawaii 24 1.2-1.9 0.5-1.1 1.98 0.14 – – Landry et al. (1984) Celtic Sea and
North Sea >20-30 0.48-3.12 0.48–5.52 – – – – Geider (1989) Northeast Subarctic Pacific 48 0.16-0.57 0.32–0.43 0.12–0.73 0.19–0.42 – – Rivkin et al. (1999) Takapoto Atoll, French Polynesia 24 ~0.90 0.25 0.50 0.30 0.80 0.40 Sakka et al. (2000) The northern
Red Sea 36 0.61-0.72 0.73-0.89 – < 0.19 – – Sommer et al. (2002) Gulf of
Aquaba 0.86–1.30 0.75–1.06 Mississippi
River plume 24 0.8 0.5 – 0.2–3.0 – – Jochem (2003)
Western
Ara-bian Sea – – – 0.18–0.90 0.06–0.73 0.31–0.92 0.18–1.78 Reckermann and Veldhuis (1997) Northwestern
Sargasso Sea – – – 0.54–0.87 0.20–0.33 – – Lessard and Murrell (1998) Subtropical
northeast Atlantic (oligotrophic region)
– – – 0.44 (average) 0.33 – – Quevedo and
Anadón (2001) Sargasso Sea and Califor-nia Current – – – 0.37–0.67 0.13–0.51 – – Worden and Binder (2003) Southern
Cali-fornia Bight – – – 0.52–0.86 0.14–0.39 0.71–1.29 0.17–1.09 Worden et al. (2004) Western
Eng-lish Channel – – – 0.13–0.50 0.22–0.67 0.34–1.14 0.01–0.81 Kimmance et al. (2007) Indian Ocean west off Australia – – – − 0.12 to 1.34 0–0.45 − 0.03 to 0.24 − 0.06 to 0.22 Paterson et al. (2007) Uwa Sea,
Japan – – – 0–1.39 0–1.54 − 0.60 to 0.92 0.45–0.94 Hirose et al. (2008) North part of
South China Sea
– – – − 0.04 to 2.39 0.25–2.44 0.84–2.34 0.37–2.18 Chen and Liu (2010) Mesotrophic
region of Yellow Sea
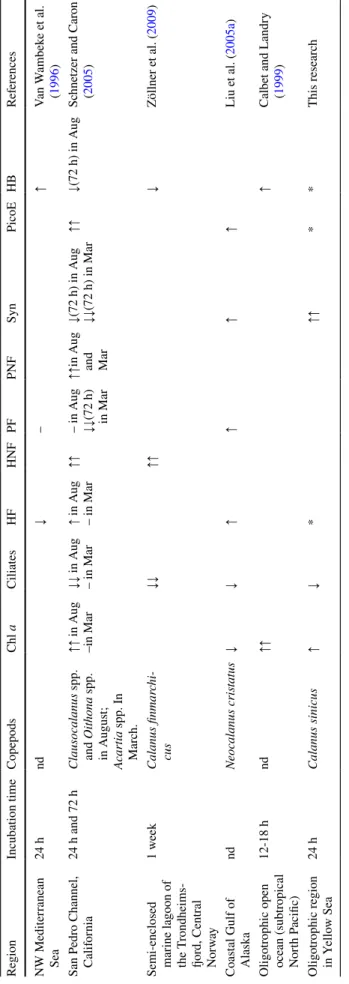
Copepods grazing on ciliates has been well studied in many previous studies, with a consensus result that copep-ods prefer ciliates as their primary food source. There are fewer reports with less consistent results on the influence of copepod on other components of the microbial food web (Table 4). A strong copepod–ciliate–flagellate trophic cascade in the copepod addition incubations in the oligo-trophic waters was not found in this study. Copepod addi-tions reduced ciliate abundance. However, a corresponding increase in flagellates abundance was not observed, thus demonstrating a feeding preference of copepods on ciliates rather than flagellates. This weak cascade result is consist-ent with the previous studies (Sipura et al. 2003). There are several possible explanations of this weak cascade: (1) cross-linkage between flagellates and their predators (cope-pods, ciliates and flagellate-preying flagellates); (2) HF were regulated mainly by resources, with mortality being only a minor influencing factor; (3) disappearance of the ciliates is a slow process. As a result, the release from ciliate grazing is not obvious in such a short incubation time. HF also needs time to respond. Removal of flagellate predators caused no quick (< 1 day) indirect response (Calbet and Landry 1999; Samuelsson and Andersson 2003) explaining that larger con-sumers, such as mesozooplankton, exert little net influence on the dynamics at the base of the food web.
Both Chl a concentration and Syn abundances showed a consistent increase in the copepod-added bottles while flag-ellate abundance remained stable. This might indicate that ciliates were in general the main grazers of phytoplankton and Syn in particular. Some indirect evidence supports cili-ates being the main grazers of Syn. For example, in waters of the North Pacific, more than two-thirds of the grazing mor-tality of Syn could be due to > 10 μm heterotrophs (mostly ciliates) (Kudoh et al. 1990). Along the WOCE SR3 line between Tasmania and Antarctica, small ciliates may have a preference for, or may be more competitive grazers of pico-phytoplankton when prokaryotic picopico-phytoplankton domi-nates (Safi et al. 2007). Active grazing by ciliates on Syn was also found in lab experiments, although Syn might not be a high-quality food for ciliates (Christaki et al. 1999).
In our results, HB abundance decreased slightly after incubation, which is consistent with Liu et al. (2005b), where HB abundance increased with the increase of ciliates. In another study, the composition and activity of bacterial assemblages was not only a reflection of the substrate sup-ply, but it was also mediated by strong food web interactions (Zöllner et al. 2009).
Although this was a small study with only five stations (one eutrophic and four oligotrophic stations), differences between trophic states were strong and hence our inferences are robust. Clearly future studies should include more sta-tions so statistical differences can be quantified.
Conclusion
In the southern Yellow Sea, picoplankton comprised a large part of the microzooplankton food source in the central oli-gotrophic area while phytoplankton was the main food of microzooplankton in the coastal eutrophic area. In the cen-tral oligotrophic area, of the three groups of picoplankton (Syn, HB and PicoE), microzooplankton preferred grazing on Syn. A strong copepod–ciliate–flagellate trophic cascade was not found in the copepod addition incubations in the oli-gotrophic waters. After copepod addition incubations, cili-ate abundance decreased while Syn abundance increased, indicating a strong grazing pressure by microzooplankton on Syn. These results suggest that Syn might be a fundamental food source for the carbon budget in the oligotrophic water in YS and its variation could affect the carrying capacity of the pelagic food webs.
Materials and methods
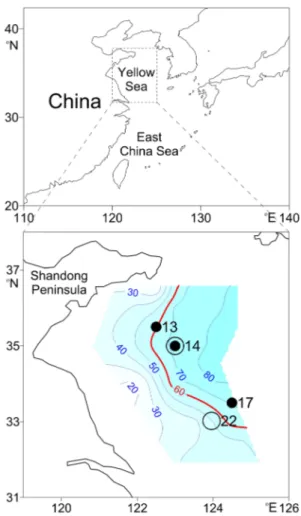
Dilution incubations and copepod addition incubations were performed during a cruise to the Yellow Sea (Fig. 4) onboard
RV Beidou on May 16–29, 2007. One station (St. 14) was
visited twice. The second visit was labelled as St. 14 -2. Dilution incubations were carried out at St. 22, St. 14 and St.14-2. Copepod addition incubations were carried out at St. 13, St. 14 and St. 17 (Table 1). At each station, tem-perature and salinity vertical profiles were measured using a Seabird CTD system (SBE-25). For the determination of Chlorophyll a (Chl a) concentration, seawater samples were taken at different depths by Niskin bottles mounted on a Rossette water sampler.
At all the stations, a thermocline was observed at 10–30 m depth. Seawater for dilution incubations and copepod addi-tion incubaaddi-tions was collected at 10 m depth, just above the thermocline, with a 60 L large volume water sampler. Fil-tered seawater (FSW) was made by filtering seawater through Whatman GF/F filters and was assumed to be free of preda-tors (micro- and mesozooplankton). The 200 μm filtered seawater (200 FSW) was made by gravity filtration through a 200 μm pore size mesh. A 100-ml sample was taken to determine nutrients concentrations. Experimental items (25-L polycarbonate carboys, 1.35-L polycarbonate incuba-tion bottles, glass filter bottles, etc.) previously soaked in 10% HCl were rinsed with large amounts of seawater before use.
Dilution incubation
Dilution incubations were carried out according to the pro-tocols described in the literature (Calbet et al. 2008; Landry and Hassett 1982). Samples were taken for the determination
Table 4 Pr evious published r esults in t he r esear ch of copepod addition e xper iments nd no dat a, ↑ incr eased, ↑↑ significantl y incr eased, ↓ decr eased, ↓↓ significantl y decr ease; * div erse c hang e, HF he ter otr ophic flag ellates, HNF he ter otr ophic nanoflag ellates, PF pigmented flag -ellates, PNF pigmented nanoflag ellates, Syn Synec hococcus , PicoE Picoeuk ar yo tes, HB He ter otr ophic bacter ia Region Incubation time Copepods Chl a Ciliates HF HNF PF PNF Syn PicoE HB Ref er ences NW Mediter ranean Sea 24 h nd ↓ – ↑ Van W ambek e e t al. ( 1996 ) San P edr o Channel, Calif or nia 24 h and 72 h Clausocalanus spp. and Oit hona spp. in A ugus t; Acar tia spp. In Mar ch. ↑↑ in A ug –in Mar ↓↓ in A ug – in Mar ↑ in A ug – in Mar ↑↑ – in A ug ↓↓ (72 h) in Mar ↑↑ in A ug and Mar ↓(72 h) in A ug ↓↓ (72 h) in Mar ↑↑ ↓(72 h) in A ug Sc hne
tzer and Car
on ( 2005 ) Semi-enclosed mar ine lagoon of the T rondheims -fjor d, Centr al No rwa y 1 w eek Calanus finmar chi -cus ↓↓ ↑↑ ↓ Zöllner e t al. ( 2009 ) Coas tal Gulf of Alask a nd Neocalanus cr ist atus ↓ ↓ ↑ ↑ ↑ ↑ Liu e t al. ( 2005a ) Oligo trophic open ocean (subtr opical Nor th P acific) 12-18 h nd ↑↑ ↑ Calbe t and Landr y ( 1999 ) Oligo trophic r egion in Y ello w Sea 24 h Calanus sinicus ↑ ↓ * ↑↑ * * This r esear ch
of initial conditions P0, including total Chl a concentration, flagellates, ciliates and picoplankton abundances.
200 µm FSW was poured into four 4-L polycarbonate bot-tles. FSW was then added to create treatments of 100%, 75%, 50% and 25% 200 FSW (dilution factor, c). After mixing, water from the 4-L polycarbonate bottles was transferred into duplicate 1.35-L polycarbonate bottles. The 1.35-L polycarbonate bottles were then incubated in a surface water flow-water-incubator on the deck for 24 h. A neutral plastic mesh was used to dim natural sunlight so that the irradiance of the incubation was similar to that at a depth of 10 m, normally about 30–50% of the irradiance at the surface. After incubation, subsamples were taken for determination of final conditions Pt (Chl a concentration, flagellate, ciliate
and picoplankton abundances).
Copepod addition incubation
The calanoid copepod, Calanus sinicus were collected by vertically towing a plankton net (mesh size 500 μm) from
2 m above the seabed to the surface. Contents of the cod-end were carefully poured into a container filled with 200 FSW.
Copepod addition incubation was carried out using two 1.35-L polycarbonate bottles filled with well-mixed 200 µm FSW. Ten healthy active adult females of C. sinicus were pipetted into each bottle and sealed without bubbles. Two control bottles without copepods were set up simultaneously. Nutrients (10 μmol/L NaNO3, 10 μmol/L Na2SiO3 and 1 μmol/L NaH2PO4) were added to each bottle. These four bottles were incubated in surface water flow-water-incuba-tor on deck for 24 h. During the incubation, these bottles were inverted gently about every 4 h. After incubation, the
C. sinicus were checked and no deaths were found. Before
and after copepod addition incubation, subsamples were taken to determine Chl a concentration, flagellate, ciliate and picoplankton abundances as in the dilution incubation experiment.
Sample collection and analysis
To determine the nutrient concentrations in the dilution incubations, 100 ml samples were filtered through 0.45 μm filters. The filtrates were poisoned with saturated HgCl2.
NO3−, PO
43− and dissolved silica concentrations were
determined photometrically (Grasshoff et al. 1999) using an autoanalyzer (Model: Skalar SANplus) with a precision
of < 5–10% in the lab.
For total Chl a concentration determination, seawater samples of 250 ml were filtered onto GF/F filters. The filters were frozen at − 20 °C until laboratory analysis. Chlorophyll was extracted with 90% acetone at − 20°C in the dark for 24 h. The concentrations were determined using a Turner Designs (Model II) fluorometer calibrated with a pure Chl
a standard material (Sigma) (Strickland and Parsons 1972). Total phytoplankton carbon biomass per unit volume was estimated from Chl a concentration assuming a constant C: Chl a ratio of 100 (mg: mg) (Gasol et al. 1997).
For flagellate abundances, 40–100 ml samples were pre-served in a glutaraldehyde solution (1% final concentration), filtered onto 2 μm pore-size black polycarbonate membrane filters and stained with DAPI (5 μg/ml final concentration) for 5 min. The filters were examined under an epifluores-cence microscope (Leica DM4500). At least 200 cells were counted and classified as either pigmented flagellates (PF) or heterotrophic flagellates (HF), according to the presence or absence of red fluorescence induced by the chlorophyll. Total flagellate (TF) abundances were defined as the sum of PF and HF. To estimate the biovolume, cell dimensions of flagellate were measured with Leica DM4500 self-carried software and transformed to biovolume by analogy to geo-metrical forms (Sun and Liu 2003). Conversion to carbon biomass was made using a factor of 220 fg C/μm3 for
flagel-lates (Børsheim and Bratbak 1987).
Fig. 4 Study area and experimenting stations. White circle: dilution incubation stations; black circle: copepod addition incubation sta-tions; contour shows the bottom depth (m)
To determine ciliate abundances, 150 ml samples were fixed with 1% acidic Lugol’s solution and stored in the dark at 4 °C until processing in the laboratory. The samples were settled for at least 24 h and the upper water was slowly siphoned out to leave a 20 ml aliquot. The concentrated sam-ples were then settled in 20 ml Utermöhl chambers. The whole chamber was counted under an Olympus CKX41 inverted microscope at 100× or 200× magnification fol-lowing the Utermöhl method (Utermöhl 1958). The volume of each cell was determined by measuring cell dimensions with an ocular micrometer, assuming appropriate geomet-ric shapes (ellipsoid, cone, cylinder, ball, semi-ellipsoid and their combinations). The carbon content of each cell was then obtained using the carbon to volume conversion factor 190 fg C/μm3 for ciliates (Putt and Stoecker 1989).
Picoplankton samples (5 ml) were fixed with paraform-aldehyde (final concentration 1%), immediately frozen in liquid nitrogen until analysis with a FACSVantage SE (Becton–Dickinson, USA) flow cytometer in the laboratory. Fluorescent beads (2 μm Fluoresbrite microspheres, Poly-sciences) were used as internal standard for the instrument set-up and enumeration of picoplankton cells (Olson et al.
1993). Syn and PicoE were characterized according to their scatter, red and orange florescence intensities. To determine HB abundance, samples were diluted 5-fold with TE buffer (Tris–EDTA, 100 mmol/L Tris–Cl, 10 mmol/L EDTA, pH 8.0, Sigma), incubated for 20 min with the SYBR Green I nucleic acid dye (Molecular Probes, final dilution 10−4)
in the dark, at room temperature. HB were resolved on the basis of their green fluorescence vs. sideward scatter sig-nals (Marie et al. 2000a, b). Picoplankton abundances were expressed in terms of carbon biomass by using conversion factors from the literature, i.e. 82 fg C/cell, 530 fg C/cell (Worden et al. 2004) and 20 fg C/cell (Lee and Fuhrman
1987), for Syn, PicoE and HB, respectively.
Data elaboration
Apparent growth rate (u, /day) of Chl a, picoplankton and flagellates in the dilution incubations were calculated using the equation u = ln(Pt/P0)/t (Landry and Hassett 1982) where
t was incubation time (day), P0 and Pt were the density of
Chl a, picoplankton and flagellates at the beginning and after the end of the incubation, respectively. According to Landry and Hassett (1982), u is the net result of grazing (g, /day) and growth rates (k, /day):
Values of k and g were determined from linear regres-sion of the apparent growth rates against dilution factors (c).
u = k − c × g.
Here, we considered only the results with significant linear regression for the preys considered (R2 > 0.8).
Microzooplankton grazing pressure on standing stock (Pi)
and primary production (Pp) were calculated according to Verity et al. (1993):
Acknowledgements We thank the crew of RV Beidou for their help and cooperation in the field work. Our colleague Peng Ji collected all the seawater used in the incubations. Dr. Chaolun Li provided hydro-graphical and nutrients data. This study was supported by National Key Research and Development Program of China (2017YFA0603204), the National Natural Science Foundation of China (Nos. 41706192, 91751202), the CNRS-NSFC Joint Research Projects Program (NSFC 41711530149) and 2017-2019 Sino-French Cai Yuanpei Programme.
Author contributions WZ, LZ and YZ designed this program and
supervised the entire project. WZ, YZ, LZ, YD, HL, SL and LH con-ducted the shipboard experiments and analyses. YZ and YD integrated all the data, finalized the figures and wrote the original draft of the manuscript. GG reviewed and edited the manuscript. The final manu-script was approved by all the authors.
Compliance with ethical standards
Conflicts of interest All the authors declare that they have no conflict of interest
Animal and human rights statement This article does not contain any studies with human participants or animals performed by any of the authors.
Open Access This article is licensed under a Creative Commons Attri-bution 4.0 International License, which permits use, sharing, adapta-tion, distribution and reproduction in any medium or format, as long as you give appropriate credit to the original author(s) and the source, provide a link to the Creative Commons licence, and indicate if changes were made. The images or other third party material in this article are included in the article’s Creative Commons licence, unless indicated otherwise in a credit line to the material. If material is not included in the article’s Creative Commons licence and your intended use is not permitted by statutory regulation or exceeds the permitted use, you will need to obtain permission directly from the copyright holder. To view a copy of this licence, visit http://creat iveco mmons .org/licen ses/by/4.0/.
References
Anderson SR, Harvey EL (2019) Seasonal variability and drivers of microzooplankton grazing and phytoplankton growth in a sub-tropical estuary. Front Mar Sci 6:174
Azam F, Fenchel T, Field JG, Gray J, Meyer-Reil L, Thingstad F (1983) The ecological role of water-column microbes in the sea. Mar Ecol Prog Ser 10:257–263
Pi= 1 − e−gt× 100%
Pp = e
kt− e(k−g)t
Baretta J, Ebenhöh W, Ruardij P (1995) The European regional seas ecosystem model, a complex marine ecosystem model. Neth J Sea Res 33:233–246
Børsheim KY, Bratbak G (1987) Cell volume to cell carbon conversion factors for a bacterivorous Monas sp. enriched from seawater. Mar Ecol Prog Ser 36:171–175
Böttjer D, Morales CE, Bathmann U (2010) Trophic role of small cyclopoid copepod nauplii in the microbial food web: a case study in the coastal upwelling system off central Chile. Mar Biol 157:689–705
Brown SL, Landry MR, Barber RT, Campbell L, Garrison DL, Gowing MM (1999) Picophytoplankton dynamics and production in the Arabian Sea during the 1995 Southwest Monsoon. Deep Sea Res Part II Top Stud Oceanogr 46:1745–1768
Burns CW, Schallenberg M (1996) Relative impacts of copepods, clad-ocerans and nutrients on the microbial food web of a mesotrophic lake. J Plankton Res 18:683–714
Calbet A, Landry MR (1999) Mesozooplankton influences on the microbial food web: direct and indirect trophic interactions in the oligotrophic open ocean. Limnol Oceanogr 44:1370–1380 Calbet A, Landry MR (2004) Phytoplankton growth, microzooplankton
grazing, and carbon cycling in marine systems. Limnol Oceanogr 49:51–57
Calbet A, Trepat I, Almeda R, Saló V, Saiz E, Movilla JI, Alcaraz M, Yebra L, Simó R (2008) Impact of micro-and nanograzers on phytoplankton assessed by standard and size-fractionated dilution grazing experiments. Aquat Microb Ecol 50:145–156
Callieri C, Karjalainen SM, Passoni S (2002) Grazing by ciliates and heterotrophic nanoflagellates on picocyanobacteria in Lago Mag-giore, Italy. J Plankton Res 24:785–796
Chen B, Liu H (2010) Trophic linkages between grazers and ultra-plankton within the microbial food web in subtropical coastal waters. Mar Ecol Prog Ser 407:43–53
Christaki U, Van Wambeke F, Dolan JR (1999) Nanoflagellates (mixo-trophs, heterotrophs and autotrophs) in the oligotrophic eastern Mediterranean: standing stocks, bacterivory and relationships with bacterial production. Mar Ecol Prog Ser 181:297–307 Ducklow HW (1983) Production and fate of bacteria in the oceans.
Bioscience 33:494–501
Gasol JM, del Giorgio PA, Duarte CM (1997) Biomass distribution in marine planktonic communities. Limnol Oceanogr 42:1353–1363 Geider RJ (1989) Use of radiolabeled tracers in dilution grazing experi-ments to estimate bacterial growth and loss rates. Microb Ecol 17:77–87
Grasshoff K, Kremling K, Ehrhardt M (1999) Methods of seawater analysis, 3rd edn. Wiley-VCH, Weinheim
Hall J, Safi K, Cumming A (2004) Role of microzooplankton graz-ers in the subtropical and subantarctic watgraz-ers to the east of New Zealand. N Z J Mar Freshw Res 38:91–101
Hirose M, Katano T, Nakano S-I (2008) Growth and grazing mor-tality rates of Prochlorococcus, Synechococcus and eukaryotic picophytoplankton in a bay of the Uwa Sea, Japan. J Plankton Res 30:241–250
Hur H, Jacobs G, Teague W (1999) Monthly variations of water masses in the Yellow and East China Seas. J Oceanogr 56:359–359 Irigoien X, Head R, Harris R, Cummings D, Harbour D, Meyer-Harms
B (2000) Feeding selectivity and egg production of Calanus
hel-golandicus in the English Channel. Limnol Oceanogr 45:44–54
Jochem FJ (2003) Photo-and heterotrophic pico-and nanoplankton in the Mississippi River plume: distribution and grazing activity. J Plankton Res 25:1201–1214
Kimmance SA, Wilson WH, Archer SD (2007) Modified dilution tech-nique to estimate viral versus grazing mortality of phytoplankton: limitations associated with method sensitivity in natural waters. Aquat Microb Ecol 49:207–222
Kishi MJ, Kashiwai M, Ware DM, Megrey BA, Eslinger DL, Werner FE, Noguchi-Aita M, Azumaya T, Fujii M, Hashimoto S, Huang D, Iizumi H, Ishida Y, Kang S, Kantakov GA, Kim H, Komatsu K, Navrotsky VV, Smith SL, Tadokoro K et al. (2007) NEMURO—a lower trophic level model for the North Pacific marine ecosystem. Ecol Model 202:12–25
Kudoh S, Kanda J, Takahashi M (1990) Specific growth rates and grazing mortality of chroococcoid cyanobacteria Synechococcus spp. in pelagic surface waters in the sea. J Exp Mar Biol Ecol 142:201–212
Landry M, Hassett R (1982) Estimating the grazing impact of marine micro-zooplankton. Mar Biol 67:283–288
Landry M, Haas L, Fagerness V (1984) Dynamics of microbial plank-ton communities: experiments in Kaneohe Bay, Hawaii. Mar Ecol Prog Ser 16:127–133
Lee S, Fuhrman JA (1987) Relationships between biovolume and bio-mass of naturally derived marine bacterioplankton. Appl Environ Microbiol 53:1298–1303
Lessard EJ, Murrell MC (1998) Microzooplankton herbivory and phytoplankton growth in the northwestern Sargasso Sea. Aquat Microb Ecol 16:173–188
Li C, Sun S, Wang R, Wang X (2004) Feeding and respiration rates of a planktonic copepod (Calanus sinicus) oversummering in Yellow Sea Cold Bottom Waters. Mar Biol 145:149–157
Li H, Xiao T, Ding T, Lü R (2006) Effect of the Yellow Sea Cold Water Mass (YSCWM) on distribution of bacterioplankton. Acta Ecol Sin 26:1012–1019
Lin S, Huang L, Zhu Z, Jia X (2013) Changes in size and trophic structure of the nanoflagellate assemblage in response to a spring phytoplankton bloom in the central Yellow Sea. Deep-Sea Res PT II 97:93–100
Liu H, Dagg MJ, Strom S (2005a) Grazing by the calanoid copepod
Neocalanus cristatus on the microbial food web in the coastal
Gulf of Alaska. J Plankton Res 27:647–662
Liu H, Dagg MJ, Wu C-J, Chiang K-P (2005b) Mesozooplankton consumption of microplankton in the Mississippi River plume, with special emphasis on planktonic ciliates. Mar Ecol Prog Ser 286:133–144
Livanou E, Lagaria A, Santi I, Mandalakis M, Pavlidou A, Lika K, Psarra S (2019) Pigmented and heterotrophic nanoflagellates: abundance and grazing on prokaryotic picoplankton in the ultra-oligotrophic Eastern Mediterranean Sea. Deep Sea Res Part II Top Stud Oceanogr 164:100–111
Marie D, Simon N, Guillou L, Partensky F, Vaulot D (2000a) DNA/ RNA analysis of phytoplankton by flow cytometry. Current Pro-tocols in Cytometry 11:11.12.1-11.12.14
Marie D, Simon N, Guillou L, Partensky F, Vaulot D (2000b) Flow cytometry analysis of marine picoplankton. In: Diamond RA, DeMaggio S (eds) In Living Color: Protocols in Flow Cytometry and Cell Sorting. Springer-Verlag, Berlin Heidelberg, New York, NY, pp 421–454
Morison F, Harvey E, Franzè G, Menden-Deuer S (2019) Storm-induced predator-prey decoupling promotes springtime accumu-lation of North Atlantic phytoplankton. Front Mar Sci 6:608 Mukhanov VS, Rylkova OA, Churilova TY, Sakhon EG, Pimenov
NV (2016) Structure and seasonal trophodynamics of picophyto-plankton in sevastopol bay and adjacent waters (the Black Sea). Microbiology 85:553–561
Nakamura Y, Suzuki K, Suzuki S-y, Hiromi J (1997) Production of
Oikopleura dioica (Appendicularia) following a picoplankton
‘bloom’in a eutrophic coastal area. J Plankton Res 19:113–124 Olson RJ, Zettler ER, DuRand MD (1993) Phytoplankton analysis
using low cytometry. In: Kemp PF, Cole JJ, Sherr BF, Sherr EB (eds) Handbook of methods in aquatic microbial ecology. Lewis Publishers, Boca Raton, FL, pp 175–186
Paterson HL, Knott B, Waite AM (2007) Microzooplankton community structure and grazing on phytoplankton, in an eddy pair in the Indian Ocean off Western Australia. Deep Sea Res Part II Top Stud Oceanogr 54:1076–1093
Pierce RW, Turner JT (1992) Ecology of planktonic ciliates in marine food webs. Rev Aquat Sci 6:139–181
Putt M, Stoecker DK (1989) An experimentally determined carbon: volume ratio for marine “oligotrichous” ciliates from estuarine and coastal waters. Limnol Oceanogr 34:1097–1103
Quevedo M, Anadón R (2001) Protist control of phytoplankton growth in the subtropical north-east Atlantic. Mar Ecol Prog Ser 221:29–38
Reckermann M, Veldhuis MJ (1997) Trophic interactions between picophytoplankton and micro-and nanozooplankton in the west-ern Arabian Sea during the NE monsoon 1993. Aquat Microb Ecol 12:263–273
Rivkin RB, Putland JN, Anderson MR, Deibel D (1999) Microzoo-plankton bacterivory and herbivory in the NE subarctic Pacific. Deep Sea Res Part II Top Stud Oceanogr 46:2579–2618 Safi KA, Griffiths FB, Hall JA (2007) Microzooplankton composition,
biomass and grazing rates along the WOCE SR3 line between Tasmania and Antarctica. Deep-Sea Res Part I Oceanogr Res Pap 54:1025–1041
Sakka A, Legendre L, Gosselin M, Delesalle B (2000) Structure of the oligotrophic planktonic food web under low grazing of het-erotrophic bacteria: Takapoto Atoll, French Polynesia. Mar Ecol Prog Ser 197:1–17
Samuelsson K, Andersson A (2003) Predation limitation in the pelagic microbial food web in an oligotrophic aquatic system. Aquat Microb Ecol 30:239–250
Schnetzer A, Caron DA (2005) Copepod grazing impact on the trophic structure of the microbial assemblage of the San Pedro Channel, California. J Plankton Res 27:959–971
Sherr E, Sherr B (1994) Bacterivory and herbivory: key roles of phago-trophic protists in pelagic food webs. Microb Ecol 28:223–235 Sherr E, Sherr B (2008) Understanding roles of microbes in marine
pelagic food webs: a brief history. Microbial Ecology of the Oceans, 2nd edn. Wiley-Liss, New York, pp 27–44
Šimek K, Bobková J, Macek M, Nedoma J, Psenner R (1995) Ciliate grazing on picoplankton in a eutrophic reservoir during the sum-mer phytoplankton maximum: a study at the species and com-munity level. Limnol Oceanogr 40:1077–1090
Sipura J, Lores E, Snyder R (2003) Effect of copepods on estuarine microbial plankton in short-term microcosms. Aquat Microb Ecol 33:181–190
Sommer U, Sommer F (2006) Cladocerans versus copepods: the cause of contrasting top–down controls on freshwater and marine phy-toplankton. Oecologia 147:183–194
Sommer U, Berninger UG, Böttger-Schnack R, Hansen T, Stibor H, Schnack-Schiel S, Cornils A, Hagen W, Wickham S, Al-Najjar T (2002) Grazing during the spring bloom in the Gulf of Aquaba and the Northern Red Sea. Mar Ecol Prog Ser 239:251–261 Stoecker DK, Capuzzo JM (1990) Predation on protozoa: its
impor-tance to zooplankton. J Plankton Res 12:891–908
Strickland JD, Parsons TR (1972) A practical handbook of seawater analysis. Fisheries Research Board of Canada, Ottawa
Su YS, Weng XC (1994) Water masses in China seas. In: Zhou D, Liang Y-B, Zeng C-K (eds) Oceanology of China Seas, vol 1. Springer Netherlands, Dordrecht, pp 3–16
Sun J, Liu D (2003) Geometric models for calculating cell biovolume and surface area for phytoplankton. J Plankton Res 25:1331–1346
Sun J, Feng Y, Zhou F, Song S, Jiang Y, Ding C (2013) Top-down con-trol of spring surface phytoplankton blooms by microzooplankton in the Central Yellow Sea, China. Deep Sea Res Part II Top Stud Oceanogr 97:51–60
Umani SF, Beran A (2003) Seasonal variations in the dynamics of microbial plankton communities: first estimates from experiments in the Gulf of Trieste, Northern Adriatic Sea. Mar Ecol Prog Ser 247:1–16
Utermöhl H (1958) Zur vervollkommnung der quantitativen phyto-plankton-methodik. Mitteilingen der Internationalen Vereinigung fur Theoretische und Angewandte. Limnologie 9:1–38
Van Wambeke F, Christaki U, Gaudy R (1996) Carbon fluxes from the microbial food web to mesozooplankton. An approach in the sur-face layer of a pelagic area (NW Mediterranean Sea). Oceanolog Acta 19:57–66
Verity P, Paffenhofer G-A (1996) On assessment of prey ingestion by copepods. J Plankton Res 18:1767–1779
Verity PG, Stoecker DK, Sieracki ME, Nelson JR (1993) Grazing, growth and mortality of microzooplankton during the 1989 North Atlantic spring bloom at 47°N, 18°W. Deep-Sea Res Part I Ocean-ogr Res Pap 40:1793–1814
Wang R, Zuo T, Wang K (2003) The Yellow Sea cold bottom water— an oversummering site for Calanus sinicus (Copepoda, Crusta-cea). J Plankton Res 25:169–183
Wetz MS, Paerl HW, Taylor JC, Leonard JA (2011) Environmental con-trols upon picophytoplankton growth and biomass in a eutrophic estuary. Aquat Microb Ecol 63:133–143
Worden AZ, Binder BJ (2003) Application of dilution experiments for measuring growth and mortality rates among
Prochlorococ-cus and SynechococProchlorococ-cus populations in oligotrophic environments.
Aquat Microb Ecol 30:159–174
Worden AZ, Nolan JK, Palenik B (2004) Assessing the dynamics and ecology of marine picophytoplankton: the importance of the eukaryotic component. Limnol Oceanogr 49:168–179
Yang EJ, Lee Y, Lee S (2019) Trophic interactions of micro-and meso-zooplankton in the Amundsen Sea polynya and adjacent sea ice zone during austral late summer. Prog Oceanogr 174:117–130 Zhang W, Xu K, Wan R, Zhang G, Meng T, Xiao T, Wang R, Sun S,
Choi JK (2002) Spatial distribution of ciliates, copepod nauplii and eggs, Engraulis japonicus post-larvae and microzooplankton herbivorous activity in the Yellow Sea, China. Aquat Microb Ecol 27:249–259
Zhang S, Wang Q, Lü Y, Cui H, Yuan Y (2008) Observation of the sea-sonal evolution of the Yellow Sea Cold Water Mass in 1996–1998. Cont Shelf Res 28:442–457
Zhao Y, Zhao L, Xiao T, Zhao S, Xuan J, Li C, Ning X (2011) Spatial and temporal variation of picoplankton distribution in the Yellow Sea, China. Chin J Oceanol Limnol 29:150–162
Zhao Y, Zhao L, Xiao T, Liu C, Sun J, Zhou F, Liu S, Huang L (2013) Temporal variation of picoplankton in the spring bloom of Yellow Sea, China. Deep Sea Res Part II Top Stud Oceanogr 97:72–84 Zoccarato L, Malusà A, Umani SF (2016) Major contribution of
prokaryotes to carbon fluxes in the pelagic microbial food webs of the Mediterranean Sea. Adv Oceanogr Limnol 7:51–66 Zöllner E, Hoppe H-G, Sommer U, Jürgens K (2009) Effect of
zoo-plankton-mediated trophic cascades on marine microbial food web components (bacteria, nanoflagellates, ciliates). Limnol Oceanogr 54:262–275
Zou L, Chen H, Zhang J (2000) Experimental examination of the effects of atmospheric wet deposition on primary production in the Yellow Sea. J Exp Mar Biol Ecol 249:111–121
Affiliations
Yuan Zhao1,2,7 · Yi Dong1,2,7 · Haibo Li1,2,7 · Shiquan Lin3 · Lingfeng Huang4,5 · Tian Xiao1,2,7 · Gerald Gregori6 ·
Li Zhao1,2,7 · Wuchang Zhang1,2,7
1 CAS Key Laboratory of Marine Ecology and Environmental
Sciences, Institute of Oceanology, Chinese Academy of Sciences, Qingdao 266071, China
2 Laboratory for Marine Ecology and Environmental
Science, Pilot National Laboratory for Marine Science and Technology (Qingdao), Qingdao 266071, China
3 Key Laboratory of Marine Ecosystem Dynamics, Second
Institute of Oceanography, Ministry of Natural Resources, Hangzhou 310012, China
4 Key Laboratory of the Ministry of Education for Coastal
and Wetland Ecosystems, College of the Environment and Ecology, Xiamen University, Xiamen 361005, China
5 Fujian Provincial Key Laboratory of Coastal Ecology
and Environmental Studies, Xiamen University, Xiamen 361102, China
6 Aix-Marseille University, Toulon University, CNRS,
IRD, Mediterranean Institute of Oceanography UM110, 13288 Marseille, France
7 Center for Ocean Mega-Science, Chinese Academy