HAL Id: hal-02462075
https://hal.umontpellier.fr/hal-02462075v2
Submitted on 9 Dec 2020HAL is a multi-disciplinary open access archive for the deposit and dissemination of sci-entific research documents, whether they are pub-lished or not. The documents may come from teaching and research institutions in France or abroad, or from public or private research centers.
L’archive ouverte pluridisciplinaire HAL, est destinée au dépôt et à la diffusion de documents scientifiques de niveau recherche, publiés ou non, émanant des établissements d’enseignement et de recherche français ou étrangers, des laboratoires publics ou privés.
Characterization of Diblock Copolymers by Capillary
Electrophoresis: From Electrophoretic Mobility
Distribution to Distribution of Composition
Anthony Phimphachanh, Joseph Chamieh, Laurent Leclercq, Simon
Harrisson, Mathias Destarac, Patrick Lacroix-Desmazes, Corine Gerardin,
Martin In, Hervé Cottet
To cite this version:
Anthony Phimphachanh, Joseph Chamieh, Laurent Leclercq, Simon Harrisson, Mathias Destarac, et al.. Characterization of Diblock Copolymers by Capillary Electrophoresis: From Electrophoretic Mobility Distribution to Distribution of Composition. Macromolecules, American Chemical Society, 2020, 53 (1), pp.334-345. �10.1021/acs.macromol.9b01978�. �hal-02462075v2�
Characterization of diblock copolymers by capillary electrophoresis: From
1
electrophoretic mobility distribution to distribution of composition
2
Anthony Phimphachanh1,3, Joseph Chamieh2, Laurent Leclercq2, Simon Harrisson4, Mathias Destarac4,
3
Patrick Lacroix-Desmazes3, Corine Gérardin3, Martin In1*, Hervé Cottet2*
4
1L2C, Univ Montpellier, CNRS, Montpellier, France
5
2IBMM, Univ Montpellier, CNRS, ENSCM, Montpellier, France
6
3ICGM, Univ Montpellier, CNRS, ENSCM, Montpellier, France
7
4IMRCP, University of Toulouse, CNRS UMR5623, Toulouse, France
8
* Corresponding authors: herve.cottet@umontpellier.fr & martin.in@umontpellier.fr
9
Abstract 10
Free solution capillary-electrophoresis (CE) is a powerful separation technique for the 11
characterization of diblock copolymers. In this work, four series of double-hydrophilic anionic and 12
cationic block copolymers, namely, poly(acrylamide)-block-poly(acrylic acid) (PAM-b-PAA), 13
poly(acrylamide)-block- poly((3-acrylamidopropyl)trimethylammonium chloride) (PAM-b-PAPTAC), 14
poly(ethylene oxide)-block-poly(acrylic acid) (PEO-b-PAA) and poly(poly(ethylene glycol) methyl 15
ether acrylate)-block-poly(acrylic acid) (P(PEGA)-b-PAA), were synthesized by reversible addition-16
fragmentation chain transfer (RAFT) polymerization and characterized by CE. The electrophoretic 17
mobility distributions of the copolymers were transformed into distributions of composition ratio by 18
introducing a retardation parameter, Xexp,, that represents the hydrodynamic drag retardation due to the
19
neutral block of the copolymer. A linear correlation between Xexp and the ratio of the degrees of
20
polymerization of each blocks was experimentally established and was consistent with the model of 21
electrophoretic mobility of composite macromolecules with hydrodynamic coupling. Finally, the 22
comparison of the distributions between the different copolymer families was significantly improved by 23
considering the distributions in composition ratio compared to the electrophoretic mobility distributions, 24
since it takes into account the differences in solvation, expansion and drag force according to the 25
chemical nature of the blocks. 26
1 Introduction 27
The characterization of diblock copolymers by separation techniques is challenging but of 28
primary importance to check their purity and to characterize their distributions in size and in chemical 29
composition.1 Block copolymers prepared by reversible deactivation radical polymerization frequently
30
contain homopolymer impurities.2, 3 These include dead chains from termination reactions during
31
polymerization of the first block, as well as the products of side-reactions such as chain transfer to 32
solvent or monomer during polymerization of the second block. The growth of the second block in 33
copolymer synthesis is often evidenced by a decrease of the elution time in size-exclusion 34
chromatography (SEC) as a result of the increased hydrodynamic radius4, 5. However, this only holds if
35
the second block contributes significantly to the hydrodynamic radius of the diblock copolymer. Getting 36
more quantitative information can be challenging especially in aqueous SEC. Different solvation 37
properties between the blocks of a block copolymer can lead to coelution of polymers of different mass 38
in SEC, resulting in inaccuracy in the obtained molar masses.6 Additionally, interactions with the
39
stationary phase3 may lead to HPLC-type elution which is dependent on the chemical composition of
40
the polymer as well as its size. For diblock copolymer SEC, particular elution conditions are generally 41
required and size distributions should be expressed in terms of hydrodynamic radius (and not molar 42
mass) due to the difference in chemical composition / solvation of the two blocks6. The proportion of
43
each monomer in a copolymer can be obtained by liquid chromatography under critical conditions 44
LCCC, also known as LC-PEAT, for the point of exclusion-adsorption transition for neutral blocks7, 8.
45
The critical conditions for LCCC (or LC-PEAT) are usually difficult to find and are very sensitive to 46
small changes in mobile phase composition and/or temperature. 47
An alternative separation technique for charged copolymers is free solution capillary 48
electrophoresis (CE) 2, 3, 7-9. The electrophoretic separation of charged homopolymers from diblock
49
copolymers is generally easily obtained in free solution CE. Moreover, for self-assembling diblock 50
copolymers, CE can also separate micelles from unimers 2, 7, 8 and allows studying the impact of added
51
surfactant on the copolymer micelles2, 7. In the presence of cationic blocks, experimental difficulties
arise from polymer adsorption onto the wall of silica based capillaries. The characterization of cationic 53
diblock copolymers requires the use of a neutrally coated3, or positively charged capillary10.
54
Another challenging issue in the characterization of diblock copolymers by CE is to extract the 55
distribution in composition of the copolymers from the electropherogram. Raw electropherograms can 56
be transformed into distributions of effective mobility, or of any other related parameter, provided that 57
the relationship between effective mobility and the considered parameter is known11. The determination
58
of polymer dispersity via the variance of the chemical composition distribution11 or via the calculation
59
of the ratio of moments of the distribution has also been studied1. A key point to achieve such
60
electropherogram transformation is to have a reliable relation between the effective mobility of the 61
diblock copolymer and the degrees of polymerization of each block and thus, to the chemical 62
composition of the copolymer3. The electrophoretic mobility of a diblock copolymer is generally
63
expressed as a weighted average of the mobilities of different subunits constituting the copolymer12. The
64
choice of the subunits and the corresponding weights have been described in the literature as depending 65
on the conformations of each block and on the hydrodynamic coupling regime between the two blocks 66
12-15. More recently, Chubynsky and Slater studied in more detail the “end-effect” (i.e. the fact that the
67
ends of the copolymer chain are more hydrodynamically exposed to the solvent)16 and the effect of
68
polymer stiffness on the electrophoretic modeling17. The electrophoretic models of composite objects12,
69
13 which are relevant for diblock copolymers, were also applied to end-labeled free solution
70
electrophoresis (ELFSE)14, 15, which consists in attaching a monodisperse neutral block (drag-tag) to a
71
polydisperse biopolyelectrolyte (for instance, for DNA sequencing in free solution15, 18), or conversely,
72
in attaching a monodisperse polyelectrolyte to a polydisperse neutral polymer (for instance, for size-73
based neutral polymer characterization14). In this way, the dependence of electrophoretic mobility with
74
the molar mass of the end-labelled composite object is obtained in free solution due to the variation of 75
the charge-to-friction ratio. 76
Double-hydrophilic block copolymers (DHBC) are block copolymers containing two hydrophilic 77
segments. DHBCs on their own are completely soluble in water and do not self-assemble in dilute 78
conditions. DHBCs can still retain an amphiphilic character and this can lead to self-organization at the 79
meso-scale in concentrated conditions19. They can undergo morphological transitions induced by
external stimuli20 in dilute solution. The great development of reversible deactivation radical
81
polymerization21-24 in the last two decades allows tailoring the stimuli-responsiveness (e.g. to changes
82
in pH, temperature, ionic strength, or light) of these polymers by controlling both the nature of 83
monomers and the degree of polymerization of the blocks. When one block is a polyelectrolyte, DHBCs 84
can undergo micellization by electrostatic complexation in the presence of an oppositely charged 85
polyelectrolyte. These properties lead to a wide range of applications such as control of crystallization 86
of inorganic compounds25, drug delivery26 or template for ordered mesoporous materials27. For this last
87
application of DHBC, the asymmetry ratio, defined as the ratio of degrees of polymerization of both 88
blocks, is of crucial interest since it determines the structure of the DHBC-templated mesoporous 89
materials. 90
It is the aim of the present work to characterize the composition of DHBC by CE, with particular 91
attention to the asymmetry ratio. The approach has been applied to series of anionic and cationic 92
DHBCs, namely, poly(acrylic acid) (PAM-b-PAA), poly(acrylamide)-block-93
poly((3-acrylamidopropyl)trimethylammonium chloride) (PAM-b-PAPTAC), poly(ethylene oxide)-94
block-poly(acrylic acid) (PEO-b-PAA) and poly(poly(ethylene glycol) methyl ether
acrylate)-block-95
poly(acrylic acid) (P(PEGA)-b-PAA). These DHBC have been synthesized in aqueous medium by 96
reversible addition-fragmentation transfer (RAFT) polymerization. 97
In the next section, different models for the electrophoretic mobility of composite objects such as block 98
copolymers are briefly reviewed. In the third section, the synthesis of the copolymers and the 99
experimental conditions of their characterization by CE are reported. The results of this work are 100
presented in section 4, where we describe a method to transform the distribution of electrophoretic 101
mobility into a distribution of the ratio of degree of polymerization of both blocks. 102
2 Mobility of diblock copolymers constituted of a polyelectrolyte and a neutral block 103
In this section, we present different possible electrophoretic mobility models that are relevant 104
for diblock copolymers composed of a polyelectrolyte part attached to a neutral polymer coil. These 105
theoretical models were developed by Desruisseaux et al28, building on previous work by Long et al.12,
106
13 Figure 1 shows the different possible conformations that can be encountered for DHBC, corresponding
107
to the different models presented below. 108
2.1 Model 1: hydrodynamic coupling 109
In Model 1, hydrodynamic coupling between the polyelectrolyte part and the neutral coil is taken 110
into account. The polyelectrolyte block of the DHBC is composed of Nblob equivalent blobs of a size
111
equivalent to the hydrodynamic radius of the neutral coil Rhneutral. If Rhneutral is larger or equal to the 112
Debye length, Long et al.29 demonstrated that the electrophoretic mobility of the DHBC composite
113
object composed of Nblob +1 subunits of equal size, is given by the number-average of the electrophoretic
114
mobilities calculated on all the equivalent blobs constituting the object. The electrophoretic mobility of 115
the DHBC, µepdiblock,1 , is thus given by28:
116
Figure 1. Representation of possible conformations of a double hydrophilic block copolymer composed of a
neutral Gaussian coil (in red) linked to a polyelectrolyte block (in blue). In model 1, the polyelectrolyte chain is a coil in hydrodynamic interaction with the neutral Gaussian coil. In model 2, the polyelectrolyte and the neutral polymer separate into two coils. In model 3, the polyelectrolyte is fully stretched and has no hydrodynamic coupling with the neutral coil. Adapted from28
0 0 0 ,1 0 1 1 1 blob N i neutral ep blob ep ep ep diblock i ep blob blob N N N DP
(1) 117where
epi is the effective mobility of the ith entity (or blob) constituting the DHBC, 0DP is the degree 118
of polymerization of the polyelectrolyte block, is the number of charged monomers per blob,
ep0 is 119the effective electrophoretic mobility of the polyelectrolyte part (alone) and
epneutralis the electrophoretic 120mobility of the neutral part (
epneutral 0). The number of equivalent blobs in the polyelectrolyte chain 121is given by blob 0
DP N
. Note that Nblob (and ,1 diblock ep
µ ) depends on the polyelectrolyte persistence 122
length, and thus, on the ionic strength. Equation (1) neglects the so-called end-effect16. Please note that
123
subscript and superscript 0 refer to the polyelectrolyte block, for consistency with ref 28. 124
2.2 Models without hydrodynamic coupling 125
2.2.1 Model 2: polyelectrolyte chain in coil conformation 126
Model 2 in Figure 1 corresponds to the segregation of the neutral polymer coil from the 127
polyelectrolyte coil. In the absence of hydrodynamic coupling between the two parts, and if the 128
polyelectrolyte chain does not stretch during electrophoresis (i.e. at sufficiently low electric field), the 129
electrophoretic mobility of the DHBC,
epdiblock,2 , is given by the average electrophoretic mobility of the 130two parts weighted by their hydrodynamic friction coefficient12. Using Stokes equation for spherical
131
objects,
epdiblock,2 is expressed as13, 28:132 1 0 0 ,2 1 0 0 1 i i ep ep diblock i ep neutral h i i h R R (2) 133
where
i is the friction coefficient of the ith part constituting the DHBC, neutralh
R is the hydrodynamic 134
radius of the neutral coil, R is the hydrodynamic radius of the polyelectrolyte block. h0
2.2.2 Model 3: polyelectrolyte chain in fully stretched conformation 136
When the polyelectrolyte coil is stretched under the concomitant influence of the electric field 137
and the opposed drag force due to the presence of the neutral coil, it can reach a fully extended 138
conformation as depicted in Figure 1 (Model 3). Stokes law is no longer appropriate for the frictional 139
coefficient of the polyelectrolyte chain, and the electrophoretic mobility of the DHBC,
epdiblock,3 , is given 140 by27 : 141 1 0 0 ,3 1 0 0 0 0 2 1 h ln i i ep ep diblock i ep neutral i i R DP b DP (3) 142where b0 is the size of a charged monomer in the polyelectrolyte chain. Equation (3) assumes that the
143
friction coefficient γrod of the stretched polyelectrolyte cylinder is averaged on all orientations relative
144
to the flow direction, and is given by: 145 0 0 rod 0 3π b DP γ ln(DP ) (4) 146
where is the viscosity of the solvent. 147
Even if the electrical field is not strong enough to stretch the polyelectrolyte block (hydrodynamic 148
segregation), the polyelectrolyte contour length may still be shorter than the persistence length of the 149
polyelectrolyte. In this situation, the segregation between the neutral and the polyelectrolyte parts is 150
sterically obtained, but the electrophoretic mobility is still described by equation (3)27
.
1513 Experimental 152
3.1 Chemicals 153
Ammonium persulfate (APS, 98%) and sodium formaldehyde sulfoxylate dehydrate (NaFS, 98%)were 154
purchased from Acros organics. Poly(ethylene glycol) methyl ether acrylate (Mn = 480 g/mol, 8.5 EO
155
units on average) and (3-acrylamidoprpyl)trimethylammonium chloride (APTAC) aqueous solution (75 156
wt.%) were purchased from Sigma Aldrich (Saint-Quentin-Fallavier, France) and used as received. 157
Acrylic acid from the same suppliers was distilled under vacuum at room temperature. PEO Mn=5000
158
g.mol-1, Ð = 1.04 was purchased from. 4,4’-azobiscyanopentanoic acid (ACPA, Aldrich, 98%) and
2,2-159
Azobis(isobutyramidine) dihydrochloride (AIBA, Sigma-Aldrich, 97%) were used as received. 160
161
For EC experiments, background electrolytes were prepared in ultra-pure water purified on a Millipore 162
system (Molsheim, France) from tris(hydroxymethyl)aminomethane (TRIS, 99,9%, Merck), 4-163
Morpholinoethanesulphonic acid (MES, >99%, Acros Organics), and 2-[Bis(2-hydroxyethyl)amino]-2-164
(hydroxymethyl)propane-1,3-diol (BIS-TRIS, >99%, Acros Organics). Anisic acid (99,5%), ammediol 165
(99,5%) used as markers for detection were purchased from Sigma-Aldrich. 166
167
3.2 Double-hydrophilic block copolymer synthesis 168
This section describes the synthesis of the copolymers. The synthetic pathway, the size exclusion 169
chromatograms and the 1H NMR spectra are given in SI as well as the temporal electropherograms.
170
3.2.1 Synthesis of poly(acrylamide)-b-poly(acrylic acid) 171
Aqueous RAFT/MADIX polymerization of AA 172
Polyacrylamide macro RAFT/MADIX agent (PAM-Xa, Mn= 5000 g.mol-1) was synthesized according
173
the procedure described by Layrac et al..30 Synthesis of PAM
70-b-PAA20 was performed as follows31:
174
PAM-based chain transfer agent (PAM-Xa,) (15.76 g, 3.029 mmol), acrylic acid (4.24 g; 58.77 mmol), 175
AIBA (0.0821 g, 0,3 mmol) and water (42 g) (solids = 30.6%) were introduced in a round bottom flask. 176
The mixture was degassed with argon at room temperature for 30 min and then placed in a thermostated 177
oil bath at 65°C under argon for 2 hours. Conversion was quantitative, acrylic acid traces were 178
eliminated by dialysis (MWCO 1000 Da) and pH-metric monitoring. The polymer solution was then 179
freeze dried and a white powder was obtained. Four DHBC were synthesized according to this 180
procedure: PAM70-b-PAA20, PAM140-b-PAA40, PAM140-b-PAA60 and PAM140-b-PAA80 (see Table 1).
3.2.2 Synthesis of poly(acrylamide)-b-poly((3-acrylamidopropyl)trimethylammonium chloride) 182
Aqueous redox RAFT/MADIX polymerization of APTAC 183
Synthesis of PAM70-b-PAPTAC30 was performed as follows: two aqueous solutions of NaFS (5%w)
184
(1.23 g of solution, 0.4 mmol) and NaPS (5%w) (2.37 mg of solution, 0.5 mmol) were prepared. PAM-185
Xa macroxanthate (9.97 g, 1.99 mmol), APTAC monomer (13.3 g of solution, 0.057 mmol), and water 186
(50 g) (solids = 25.4%) were introduced in a round bottom flask. The pH of the mixture was first adjusted 187
at 2 with hydrochloric solution 1M. Then the mixture was degassed with argon at room temperature for 188
30 min and placed in a thermostated oil bath at 25°C under argon. Both solution of NaFS and NaPS 189
were introduced in the round bottom flask and the reaction mixture was stirred for 3 hours. Monomer 190
traces were eliminated with dialysis (MWCO 1000 Da) and conductivity monitoring. The polymer 191
solution was then lyophilized and a white powder was obtained. This redox process at 25°C was 192
developed after the paper of Sutton et al.9 to minimize the formation of dead chains. Four DHBC were
193
synthesized according to this procedure: PAM70-b-PAPTAC30, PAM70-b-PAPTAC60, PAM140
-b-194
PAPTAC60 and PAM140-b-PAPTAC120 (see Table 1).
195
3.2.3 Synthesis of poly(ethylene oxide)-b-poly(acrylic acid) 196
Aqueous RAFT polymerization of AA 197
Synthesis of PEO105-b-PAA20 was performed as follows: PEO105-CTA (poly(ethylene oxide)-chain
198
transfer agent) macro RAFT agent was obtained following the procedure published by Bathfield et al32.
199
PEO105-CTA, (10.53 g, 2.19 mmol), ACPA (0.123 mg, 0,439 mmol), acrylic acid (5.5 g, 76 mmol) and
200
deionized water (29.5 mL) (solids=35.4%) were introduced in a Schlenk tube equipped with a magnetic 201
stirrer. The mixture was degassed by five freeze-evacuate-thaw cycles and then heated for 42 hours at 202
75°C under nitrogen in a thermostated oil bath. Final conversion = 72%. Monomer conversion was 203
determined by 1H NMR spectroscopy, using a Bruker 400MHZ spectrometer. Samples for analysis by
204
NMR were prepared by adding 0.6 mL of D2O to 0.1 mL of polymerization medium. Once the reaction
205
was complete, the solvent was evaporated, and then the DHBC was dissolved in a minimum amount of 206
dichloromethane before being precipitated twice in a large volume of cold diethyl ether. It was then 207
recovered by filtration, and finally dried under vacuum overnight before analysis by SEC and 1H-NMR.
208
SEC was performed in DMF-LiBr after methylation33 with trimethylsilyldiazomethane. Four DHBC
were synthesized according to this procedure: PEO105-b-PAA20, PEO105-b-PAA30, PEO210-b-PAA40 and
210
PEO210-b-PAA50 (see Table 1). The degrees of polymerization of the commercial starting PEO have
211
been determined by 1H NMR32 and are presented in Table 1.
212
3.2.4 Synthesis of poly(acrylic acid)-b-poly(poly(ethylene glycol) methyl ether acrylate) 213
Aqueous RAFT polymerization of AA and PEGA 214
5,7-dithia-6-thio-4-methyl-4-cyanodecanoic acid (CTPPA) was obtained by reaction of ACPA 215
with bis(propylsulfanylthiocarbonyl) disulfide according to literature.34 Synthesis of PAA 21
-b-216
P(PEGA)12 was performed as follows: PAA-CTPPA chain transfer agent was synthesized according to
217
the process described in literature35: in a round bottom flask, CTPPA (0.8 g, 2.57 mmol, purity=89%),
218
acrylic acid (3.9g, 54.1 mmol), ACPA (0,072 g, 0.26 mmol) and half of the amount of water (7.5 g) are 219
stirred until dissolution of CTPPA. The remaining water (7.5 g) was introduced and the mixture was 220
degassed with argon for 40 min. The mixture was then heated in an oil bath at 70°C for 5.5 h. For the 221
synthesis of PAA-b-P(PEGA), ACPA (0.0715 g; 0.26 mmol) and poly(ethylene glycol) methyl ether 222
acrylate (12.8 g, 26.4 mmol) were added to the PAA-CTPPA reaction medium and the mixture was 223
degassed with argon for 40 min. The mixture was then heated in an oil bath at 70°C for 5 h. Conversion 224
was followed by 1H NMR. At the end of the polymerization, water was evaporated under reduced
225
pressure and the polymer washed with diethyl ether. NMR sample preparation: 0.6 mL of D2O was
226
added to 0.1 mL of polymerization medium and quenched in liquid nitrogen. Two DHBC were 227
synthesized according to this procedure: P(PEGA)12-b-PAA21 and P(PEGA)22-b-PAA45 (see Table 1).
228
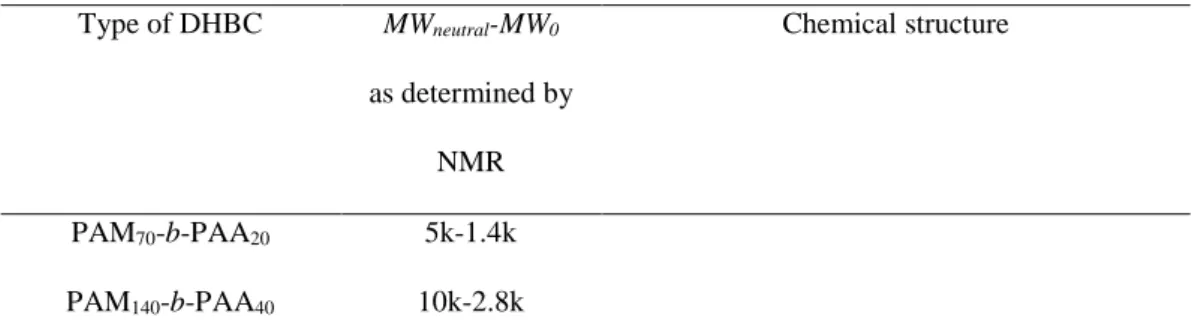
Table 1: Presentation of the chemical structure and the different DHBC samples synthesized and studied in this
229
work. The subscripts in the names correspond to the degree of polymerization of each block. MWneutral and MW0
230
are the molar masses of the neutral and of the polyelectrolyte block respectively. 231 Type of DHBC MWneutral-MW0 as determined by NMR Chemical structure PAM70-b-PAA20 5k-1.4k PAM140-b-PAA40 10k-2.8k
PAM140-b-PAA60 10k-4.4k PAM140-b-PAA80 10k-5.6k PEO105-b-PAA20 5k-1.4k PEO105-b-PAA30 5k-2.2k PEO210-b-PAA40 10k-2.8k PEO210-b-PAA50 10k-3.6k PAM70-b-PAPTAC30 5k-5k PAM70-b-PAPTAC60 5k-10k PAM140-b-PAPTAC60 10k-10k PAM140-b-PAPTAC120 10k-20k P(PEGA)12-b-PAA21 5.7k-1.5k P(PEGA)22-b-PAA45 10.6k-3.2k 3.3 Capillary electrophoresis 232
Instrumentation and method
233
Capillary electrophoresis experiments were performed on an Agilent 7100 capillary electrophoresis 234
instrument with a diode array UV detector. Fused silica capillaries of 50/375 µm I.D./O.D. with 235
polyimide outer coating (cat. no. TSP050375) were from Polymicro Technologies (Phoenix, AZ, USA). 236
Capillary dimensions were 38.5 cm long (30 cm to detection window). New capillaries were conditioned 237
by performing the following washes at 1 bar: 1M NaOH for 30 min and water for 15 min. The 238
temperature of the capillary cartridge was set at 25 °C. 239
In the case of PAM-b-PAA, an electrolyte consisting of 20 mM MES and 14 mM ammediol pH 6.5 was 240
used. 0.1 g/L anisic acid was added in the sample as a mobility marker. The same background electrolyte 241
was used for PAM-b-PAPTAC, but with a different mobility marker (imidazole 0.1 g/L). In the case of 242
PEO-b-PAA and P(PEGA)-b-PAA, an electrolyte constituted of 6 mM anisic acid and 12 mM BIS-243
TRIS, pH 6.5 was used as buffer, with MES at 0.5 g/L as mobility marker in the case of P(PEGA)-b-244
PAA. 245
All copolymers were dissolved in water at a concentration of 5 g/L. Samples were injected 246
hydrodynamically on the inlet side of the capillary by applying 30 mbar for 5 s. Separations were carried 247
out by applying a +20 kV voltage. For PAA, PEO-b-PAA and P(PEGA)-b-PAA and PAM-b-248
PAPTAC, detection was realized at 192 +/- 2 nm (reference off). 249
For PAM-b-PAA, PEO-b-PAA and P(PEGA)-b-PAA, the capillary was rinsed between each run by 250
flushing the capillary for 2 min with the background electrolyte, 2 min with 0.1 M NaOH, 2 min with 251
ultra-pure water and 2 min with background electrolyte. For the analysis of the cationic polymer PAM-252
b-PAPTAC, and in order to reduce the adsorption on the capillary wall, surface of the capillary was
253
modified using UltraTrol™ LN (Target Discovery, Inc., Palo Alto, CA), which is a commercial neutral 254
semi-permanent coating based on polyacrylamide derivatives. The coating procedure was performed 255
using the following successive flushes: methanol for 2 min at 1 bar, water for 2 min at 3 bar, 1 M NaOH 256
for 2 min at 3 bar, 0.1 M NaOH for 2 min at 1 bar, 1 M HCl for 5 min at 1 bar, water for 5 min at 1 bar, 257
UltraTrol™ LN solution for 5 min at 1 bar, wait for 5 min, water for 2 min at 1 bar. Prior to each analysis 258
of PAM-b-PAPTAC, the capillary was rinsed with the background electrolyte for 2 min at 1 bar. 259
260
Electropherogram data treatment 261
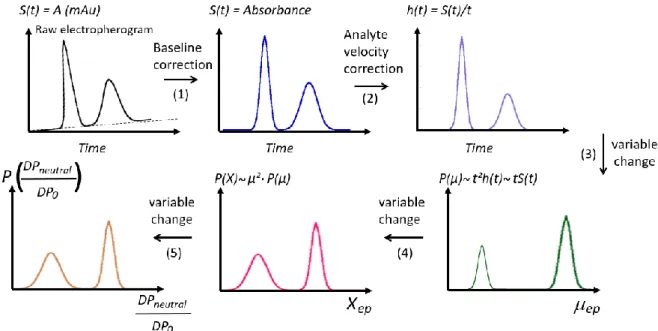
Scale transformations. In this section, the transformations of the electropherograms into distributions
262
of the parameter of interest are described following a previously published protocol11. Briefly,
263
experimental raw time-scale electropherograms, were first corrected from any baseline shift using 264
Origin (Origin 2016, OriginLab, USA) as depicted in step 1, Figure 2. For quantitative purpose, the 265
absorbance signal S(t) was next divided by the migration time (t) to correct the differences in analyte 266
Figure 2. General scheme for changing a time-scale electropherogram into a mobility-scale and Xexp-scale
distributions. The raw electropherogram is first corrected from baseline shift (1). The time-scale electropherogram is then corrected from the differences in analyte velocities (2). The time-corrected electropherogram is converted into the effective mobility-scale distribution (3). The mobility-scale
electropherogram is changed into a Xexp-scale distribution (4) and finally to a compositional 0 neutral D P
D P
ratio (5).
S(t) is the UV absorbance signal (in mAU). h(t) is the time-corrected UV absorbance. P(µep) is the effective
mobility distribution. P(Xexp) is the distribution in Xexp (see section 4.2) and P(
0 neutral D P D P ) is the distribution in 0 neutral D P D P
velocity (Figure 2, step 2)11. Next, the time-corrected electropherogram h(t) was changed into an
267
effective mobility distribution 𝑃(𝜇𝑒𝑝) = 𝑡 × 𝑆(𝑡) (Figure 2, step 3)11, which requires the 268
transformations of both the x and y axis11 . Note that µ
ep is obtained by equation (5): 269 1 1 ( ) ep eo lL µ V t t (5) 270
where l is the effective capillary length, L is the total capillary length, t is the migration time, teo is the
271
EOF marker migration time and V is the separation voltage. 272
Moments of the electrophoretic mobility distribution The average effective mobility of the diblock
273
copolymer µepdiblock was obtained by integration of the peak of the copolymer in the effective mobility 274
scale according to: 275 , , , 1 , , , 1 , ( ) ( ) ( ) ( ) ( )( ) ep i ep i ep i ep i ep ep ep diblock i ep ep ep ep i ep i ep i i P µ µ µ µ P µ µ dµ µ P µ dµ P µ µ µ
(6) 276where integration is carried out over the peak. In practice the integration is done numerically and the i 277
index represents the digitized experimental data points. The summation is carried out over values 278
of 𝑃(𝜇𝑒𝑝,𝑖) greater than the median of the base line added to its standard deviation. Calculation of 279
diblock ep
µ was performed using Excel 2016 (Microsoft, USA), following the discrete form of equation (6). 280
Variance of the diblock electrophoretic mobility was obtained by the following equation: 281
2 2 , , , 1 , 2 , , 1 , ( )( ) ( ) ( ) ( ) ( )( ) diblock diblock ep i ep i ep ep i ep i ep ep ep ep i µ ep ep ep i ep i ep i i P µ µ µ µ µ P µ µ µ dµ P µ dµ P µ µ µ
(7) 282 2834. Results and discussion 284
4.1. Electrophoretic separation of the DHBC 285
The main goal of the CE characterization is to provide information about the chemical composition 286
distribution of the DHBC and about the purity of the DHBC in terms of possible presence of 287
homopolymers. The separation of the DHBC by CE requires an appropriate background electrolyte, 288
depending on the nature of the copolymer. For copolymers absorbing in UV (i.e. those with a PAM 289
neutral block), direct UV detection was possible and a background electrolyte based on 20 mM MES 290
and 14 mM ammediol at pH 6.5 was used, with a UV detection at 192 nm. For DHBC copolymers that 291
do not absorb UV enough to ensure sensitivity (i.e. PEO-b-PAA or P(PEGA)-b-PAA), an indirect 292
detection mode based on a 6 mM anisic acid and 12 mM BIS TRIS at pH 6.5 was used. At this pH about 293
60% of the carboxylic acid groups of the PAA are ionized, and this ensures appropriate selectivity of 294
separation between PAA homopolyelectrolyte and the DHBC. Uncoated fused silica capillary was used 295
for the characterization of all anionic DHBC. Semi-permanent UltraTrolLN neutral coating was used 296
for the characterization of the cationic PAM-b-PAPTAC DHBC, to avoid any copolymer adsorption on 297
the capillary surface. To correct the apparent mobility from the electroosmotic mobility, a mobility 298
marker (anisic acid for PAA, MES for P(PEGA)-b-PAA, and imidazolium for PAM-b-299
PAPTAC) of known effective mobility (µep, MES = - 28 TU (where TU, Tiselius Unit, stands for 10-9 m²V
-300
1s-1) and µ
ep, imidazolium = 52 TU) was co-injected. For POE-b-PAA, the electroosmotic mobility was
301
estimated from the electroosmotic flow (EOF) peak. The distributions of effective mobility (DEM) of 302
PAM-b-PAA, PEO-b-PAA, P(PEGA)-b-PAA and PAM-b-PAPTAC are displayed in Figure 3. 303 -40 -35 -30 -25 -20 -15 -10 -5 0 PAM 70-b-PAA2 0 PAM 140-b-PAA40 PAM 140-b-PAA60 PAM 140-b-PAA78 P( ep ) ep (10 -9 m²V-1s-1) (1) (2) (3) (A) -50 -40 -30 -20 -10 0 PEO 105-b-PAA20 PEO 105-b-PAA30 PEO 210-b-PAA40 PEO 210-b-PAA50 P( ep ) ep (10 -9 m²V-1s-1) (1) (B) (2) (3) 304
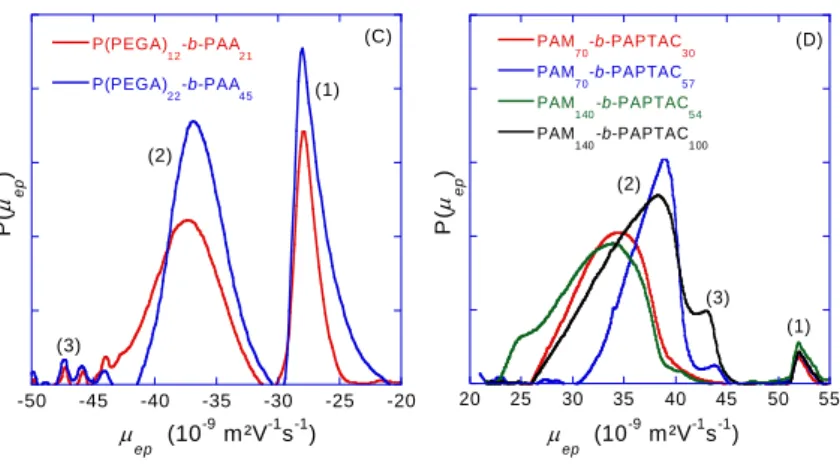
305 -50 -45 -40 -35 -30 -25 -20 P(PEGA) 12-b-PAA21 P(PEGA) 22-b-PAA45 P( ep ) ep (10 -9 m²V-1s-1) (1) (2) (3) (C) 20 25 30 35 40 45 50 55 PAM 70-b-PAPTAC30 PAM 70-b-PAPTAC57 PAM 140-b-PAPTAC54 PAM 140-b-PAPTAC100 P( ep ) ep (10 -9 m²V-1s-1) (2) (1) (3) (D) 306
Figure 3.: Distributions of effective electrophoretic mobility obtained for PAM-b-PAA (A), PEO-b-307
PAA (B), P(PEGA)-b-PAA (C), and PAM-b-PAPTAC (D).-Electrophoretic conditions: fused silica 308
capillary (A, B, C) or coated with UltraTrolLNTM (D), 50 µm I.D. × 38.5 cm (effective length, 30 cm).
309
Electrolytes: 20 mM MES, 14 mM ammediol, pH 6.5 (A, D); 6 mM anisic acid, 12 mM BIS TRIS, pH 310
6.5 (B, C). Applied voltage: +20 kV. Hydrodynamic injection: 30 mbar, 5 s. Direct (A, D) or indirect 311
(B, C) UV detection at 192+/- 2 nm. Temperature: 25 °C. Samples: 5 g/L DHBC. Assignment of the 312
peaks: PAM-b-PAA (A): anisic acid (1), DHBC (2), PAM homopolymer (3); PEO-b-PAA (B): system 313
peak (1), DHBC (2), PAA oligomers (3); P(PEGA)-b-PAA (C): MES (1), DHBC (2), PAA oligomers 314
(3); PAM-b-PAPTAC (D): Imidazolium (1), DHBC (2), PAPTAC (3). The degree of polymerization of 315
each block is specified on the graph. 316
The DEM in the series PAM-b-PAA (Figure 3A) show three peaks, two sharp at -29 TU (peak 1) and -2 317
TU (peak 3) and one broad (peak 2) between -7 and -37.5 TU, the latter being assigned to the copolymer 318
of interest. The peak at -29 TU is assigned to anisic acid (electrophoretic mobility marker) and the one 319
at -2 TU corresponds to homopolymer of PAM. The non-zero electrophoretic mobility of the PAM 320
homopolymer is explained by the incorporation of the negatively charged initiator 4,4'-azobis(4-321
cyanopentanoic) acid. The mass proportion of this PAM population of dead chains has been quantified 322
by external calibration based on time-corrected peak areas using direct injections of PAM solutions of 323
known concentration in the same condition as the DHBC. The proportion of PAM homopolymer 324
amounts to 21wt% in the solid form polymer sample for PAM70-b-PAA20, 15% for PAM140-b-PAA40
and PAM140-b-PAA60 and 8% for PAM140-b-PAA78. The copolymer peak is broad and, as expected, the
326
DEM shifts further from zero as the proportion of charged monomer increases in the composition of the 327
copolymers. This can be verified by comparing the average electrophoretic mobility value µepdiblock (given 328
in Table 2) which varies between -19.5 TU and -24.1 TU from PAM140-b-PAA40.to PAM140-b-PAA78.
329
The greater the average molar mass of the polymer, the more dispersed its electrophoretic mobility, as 330
demonstrated by the standard deviationµ which varies from 3.9 TU for PAM-b-PAA 70-20, to 6.2 TU 331
for PAM-b-PAA 140-60. 332
The DEM of PEO based copolymers are presented in Figure 3B for linear PEO and Figure 3C for PEO 333
grafted polyacrylates (P(PEGA)). Three populations are observed in both series: several small peaks 334
associated with large electrophoretic mobility at -45TU are assigned to short oligomers of PAA, the 335
weight percent of which is estimated to be lower than 10%. The sensitivity of the UV detection is too 336
low to conclude about the presence / absence of PEO or P(PEGA) in the DHBC. The least mobile species 337
at -28TU in Figure 3C corresponds to the MES used as mobility marker. The peak at intermediate values 338
of mobility corresponds to the DHBC. The electrophoretic mobility of PEO-b-PAA (µepdiblock ranging 339
from -28 to -33 TU, Table 2) is significantly closer to zero than that of P(PEGA)-b-PAA copolymers ( 340
diblock ep
µ ranging from -36 to-38 TU, Table 2), although the molar masses are close. This is because 341
P(PEGA), a comb-like polymer, is more compact than linear PEO of the same molar mass. As a 342
consequence, the drag force due to the neutral block is lower for P(PEGA) than for PEO. 343
As for PAM-b-PAPTAC copolymer, PAPTAC homopolymer was detected at about +43TU, as a 344
shoulder merged in the copolymer distribution, only for the DPneutral/DP0 equal to 140/100 and 70/57
345
samples. Figure 3D displays DEM ranged between +22 and +41 TU, with higher effective mobilities 346
for the DHBC of highest charge. Comparison of PAM-b-PAA series with PAM-b-PAPTAC series 347
illustrates the importance of the nature of the blocks on the drag effect of the neutral block. This effect 348
is discussed in more detail in section 4.2. 349
As a general trend, electrophoretic mobilities of DHBC are always closer to zero than those of the 350
homopolyelectrolyte which are: PAA= -42 TU; PAPTAC= +44 TU, and the electrophoretic mobility of
351
the DHBC increases as the proportion of charged monomers in the DHBC increases (see Figure SI 20). 352
In terms of EM dispersion, the least dispersed series is the P(PEGA)-b-PAA, with relative standard 353
deviation of EM µ/µepdiblock between 6.5% to 9%, followed by the PEO-b-PAA (µ /µepdiblock ~5% to 354
16%) and the most disperse series is the PAM-b-PAA series with 20% to 30% relative standard deviation 355
of the electrophoretic mobility. This dispersion in mobility results from both the level of control of the 356
polymerization, and from the spatial extension of the polymer in the solvent. It can be explained by the 357
chemistry of the RAFT polymerization (chain transfer agent R-SC(S)Z where Z is the activating group 358
and R is the leaving group), for which the polymerization of acrylates is better controlled by 359
dithiobenzoates (Z: -SC(S)Ph) (Ð < 1.2) than by ethyl xanthate (Z: -SC(S)OEt) (Ð > 1.3). Besides, the 360
2-phenylacetate ester of PEO is a better homolytic leaving group than PAM.36 Furthermore, the synthesis
361
of PAM-b-PAA cumulates two successive RAFT/MADIX polymerizations of AM and AA, whereas the 362
synthesis of PEO-b-PAA starts from a narrow PEO-CTA (Ð = 1.04) (PEO obtained by anionic 363
polymerization) to perform a single RAFT polymerization of AA. This is consistent with the higher 364
dispersity of PAM-b-PAA compared to PEO-b-PAA31. In addition, in reversible-deactivation radical
365
polymerization37, at full conversion, the dispersity as defined by the ratio of the weight average molar
366
mass over the number average molar mass, decreases when the DP increases38:
367 1 1 1 ex Ð DP C (8) 368
where DP is the targeted polymerization degree and Cex is the degenerative chain transfer constant
369
between dormant and active chains39, 40, which is consistent with a higher dispersity for a shorter
370
poly(acrylic acid) block in PEO-b-PAA. 371
To get a better description of the copolymer distribution, it would be interesting to get a distribution of 372
a new parameter which is directly related to the chemical composition of the copolymer instead of the 373
electrophoretic mobility, which is not linearly dependent on the copolymer composition. This is the 374
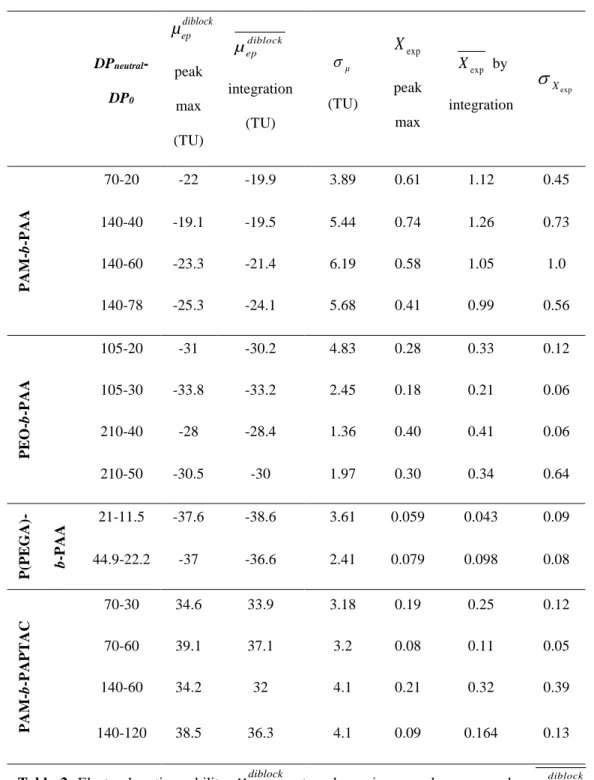
purpose of the two following sections. 375 376 DPneutral -DP0 diblock ep
µ
peak max (TU) diblock ep µ integration (TU) µ (TU) exp X peak max exp X by integration exp X
P AM -b -P AA 70-20 -22 -19.9 3.89 0.61 1.12 0.45 140-40 -19.1 -19.5 5.44 0.74 1.26 0.73 140-60 -23.3 -21.4 6.19 0.58 1.05 1.0 140-78 -25.3 -24.1 5.68 0.41 0.99 0.56 P E O -b -P AA 105-20 -31 -30.2 4.83 0.28 0.33 0.12 105-30 -33.8 -33.2 2.45 0.18 0.21 0.06 210-40 -28 -28.4 1.36 0.40 0.41 0.06 210-50 -30.5 -30 1.97 0.30 0.34 0.64 P (P E G A) -b -P AA 21-11.5 -37.6 -38.6 3.61 0.059 0.043 0.09 44.9-22.2 -37 -36.6 2.41 0.079 0.098 0.08 P AM -b -P AP T AC 70-30 34.6 33.9 3.18 0.19 0.25 0.12 70-60 39.1 37.1 3.2 0.08 0.11 0.05 140-60 34.2 32 4.1 0.21 0.32 0.39 140-120 38.5 36.3 4.1 0.09 0.164 0.13Table 2. Electrophoretic mobility
µ
epdiblock at peak maximum and average value µepdiblock obtained by peak 377integration, standard deviation of the electrophoretic mobility distribution µ, Xexp value at peak maximum and 378
average value Xexp obtained by peak integration, standard deviation of the Xexp distribution Xexp of all DHBC
studied in this work. Note that the peak of anisic acid was first subtracted before integration for the calculation of 380
diblock ep
µ andµfor PAM-b-PAA. 381
382
4.2. Change of variable from µep to the retardation parameter Xexp 383
The drag effect of the neutral block can be expressed by the retardation parameter Xexp defined as :
384 0 0 exp 1 diblock ep ep ep diblock diblock ep ep µ µ µ X µ µ (9) 385
where µep0 is the electrophoretic mobility of the homopolyelectrolyte; µepdiblock is the electrophoretic 386
mobility of the copolymer. 𝑋𝑒𝑥𝑝 expresses the relative decrease of mobility due to the presence of the 387
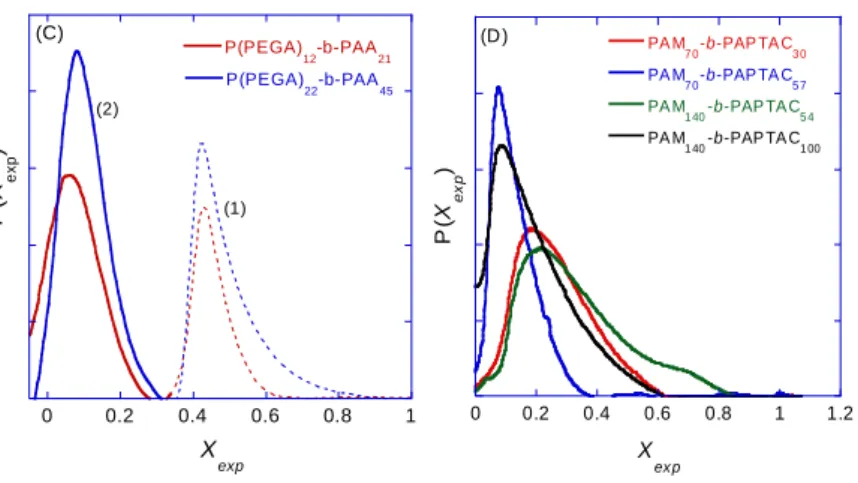
neutral block. It is positive and increases as the drag effect increases. 388 389 0 0.5 1 1.5 2 2.5 3 3.5 4 PAM 70-b-PAA20 PAM 140-b-PAA40 PAM 140-b-PAA60 PAM 140-b-PAA78 P( X e x p ) X exp (A) (2) (1) 0 0.2 0.4 0.6 0.8 1 PEO 105-b -PAA1.4 PEO 105-b -PAA2.2 PEO 210-b -PAA2.8 PEO 210-b -PAA3.6 P( X e x p ) X ex p (B) 390 391
0 0.2 0.4 0.6 0.8 1 P(PEGA) 12-b-PAA21 P(PEGA) 22-b-PAA45 P (X e x p ) X exp (C) (1) (2) 0 0.2 0.4 0.6 0.8 1 1.2 PA M 7 0-b-PAP TA C3 0 PA M 7 0-b-PAP TA C5 7 PA M 1 40-b-PAP TA C5 4 PA M 1 40-b-PAP TA C1 00 P( X e x p ) X ex p (D ) 392
Figure 4. Distribution of retardation parameter Xexp for PAM-b-PAA (A) PEO-b-PAA (B),
P(PEGA)-393
b-PAA (C), and PAM-b-PAPTAC (D). Experimental conditions as in Figure 3Xexp was determined using
394
eq. (8), eq. (12) and 𝜇ep,PAA0 = -42TU; 𝜇ep,PAPTAC0 = 44 TU. Assignment of the peaks: PAM-b-PAA (A): 395
anisic acid (1), DHBC (2); P(PEGA)-b-PAA (C): MES (1), DHBC (2). The degree of polymerization of 396
each block is specified on the graph. 397
398
The new experimental variable, Xexp, not only points out the friction due to the neutral block but is also
399
more directly related to the composition of the DHBC. Introducing equation (9) in the various 400
expressions of the electrophoretic mobility (equations 1 to 3), Xexp, can be expressed as a function of the
401
ratio between the degrees of polymerization of the neutral 𝐷𝑃𝑛𝑒𝑢𝑡𝑟𝑎𝑙 and the charged blocks 𝐷𝑃0. Taking 402
into account the hydrodynamic coupling (model 1), Xexp reads:
403 mod ,1 0 1 el blob X N DP
(10a) 404
and can be further developed as a function of the Kuhn lengths of the neutral block,
1 K b , and of the 405 polylelectrolyte, 0 K b :15, 41 406 mod ,1 1 0 neutral el DP X DP
(10b) 407
with 1 0 1 1 0 K K b b b b
(10c) 408
where b1 is the neutral monomer size. The Kuhn statistical segment length (which is twice the persistence
409
length) is a measure of the polymer stiffness. Parameter 1 in Equation (10b) is a relative friction
410
coefficient and it is non-dimensional. Since the polyelectrolyte is generally stiffer than the neutral block, 411
1 is often much smaller than unity15.
412
As for model 2, it is clear from equation (2) that the X parameter is directly expressed as the ratio of the 413
hydrodynamic radius of each block: 414 mod ,2 0 neutral h el h R X R
(11a) 415
which can be rewritten as a function of the degrees of polymerization of each block by: 416 1 0 1 mod ,2 0 0 a neutral el a C DP X C DP
(11b) 417
where C1 (resp. C2) and a1 (resp. a2) are, respectively, the prefactors and exponents for the neutral (resp.
418
charged) block in the relationship between Rh and DP. Note that a0 and a1 are supposed to be close to
419
0.5-0.6 for coil conformations, and slightly higher for more extended conformations. 420
As for model 3 (see equation (3)), the X parameter is directly expressed as: 421 0 mod ,3 0 0 2 hneutralln el R DP X b DP
(12a) 422
Injecting Rhneutralin equation (9a) leads to: 423 1 1 0 mod ,3 0 0 2 neutrala ln el C DP DP X b DP
(12b) 424
Finally, equations (10b) (11b) and (12b) demonstrates that, whatever the considered model, the X 425
parameter is related to a compositional ratio between the neutral and the charged blocks with, however, 426
different scaling dependences with the DP of each block, and with an additional logarithmic term in 427
model 3. It is worth noting that in the case of hydrodynamic coupling (model 1), the newly introduced 428
variable varies linearly with the ratio of degree of polymerization of the two blocks. 429
The distributions of the Xexp parameter are simply deduced from the distribution of electrophoretic
430
mobility using the following equation (Figure 2, step 4)11:
431 2 exp 1 ( ) ( ep) ep ( ep) ep ep P X P µ µ P µ X µ (13) 432
All the Xexp distributions are presented in Figure 4. Since µep and Xexp are not linearly related, the change
433
of the variable from µep to Xexp modify the form of the distribution. The different moments characterizing
434
the distribution of Xexp are calculated using similar relations as equations (6) and (7) and are reported in
435
Table 2. 436
Xexp range varies between 0.1-3 for PAM-b-PAA, 0.1-0.7 for PEO-b-PAA, 0-0.3 for P(PEGA)-b-PAA
437
and 0-0.8 for PAM-b-PAPTAC. The dispersion of the retardation parameter Xexp expressed as
exp
X
438
values (Table 2) follows the following order: P(PEGA)-b-PAA < PEO-b-PAA ~ PAM-b-PAPTAC < 439
PAM-b-PAA. The dispersion of the retardation parameter cannot be interpreted as a dispersity in molar 440
mass or in composition since the retardation parameter will change with these chemical features in a 441
way that depends on the conformation of the blocks. So, a further step is needed to get the composition 442
dispersion. 443
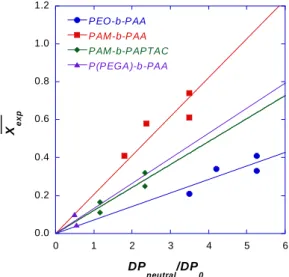
4.3. Change of variable from Xexp to chemical composition ratio 444 0.0 0.2 0.4 0.6 0.8 1.0 1.2 0 1 2 3 4 5 6 PEO-b-PAA PAM-b-PAA PAM-b-PAPTAC P(PEGA)-b-PAA DP neutral/DP0 X exp 445
Figure 5. Plot of Xexp against
0 neutral DP
DP
. Xexp was determined by using eq.(6) after replacing µep by
446 Xexp. 0 neutral DP DP
was obtained by NMR (see Table 1). Least-square linear regressions provide the following 447
experimental slopes: 0.071+/-0.005 for PEO-b-PAA;0.12+/-0.01 for PAM-b-PAPTAC; 0.13 +/- 0.01 448
for P(PEGA)-b-PAA; 0.21+/-0.02 for PAM-b-PAA. 449
450
To go further in the interpretation and in the process of the experimental data, it is crucial to identify the 451
model which is best adapted to describe the electrophoretic behavior of the DHBC investigated in this 452
work. To assess the validity of model 1 (hydrodynamic coupling between blocks, see section 2.3), Xexp
453
was plotted against
0 neutral DP
DP
in Figure 5 for the four DHBC families.
454Table 3. Characteristic parameters of neutral and charged blocks constituting the DHBC studied in this work. Mw
455
are expressed in g/mol. 456
457 458 459 460 461 462 463
a From Mark-Houwink parameters using
1/3 3 10 h A M R N
, where [] is the intrinsic viscosity and Na is the
464
Avogadro number. from ref46 (see Table 1 and Figure 13(a) herein).
465
466
The results are consistent with model 1 which predicts a linear dependence of the retardation parameter 467
exp
X on the ratio of degree of polymerization
0 neutral DP
DP
. The slopes determined from the graph in Figure 468
5 correspond to the parameter 1 in equation (10b) which can be calculated from equation (10c).
469
Experimentally, the numerical values of the slopes 1,exp are in the range of ~0.1-0.2. Taking the
470
characteristic parameters (Kuhn lengths, monomer dimensions) given in Table 3 leads to 1=0.24 (vs
471
1,exp=0.21+/-0.02 experimentally obtained) for PAM-b-PAA, 1=0.36 (vs 1,exp=0.071+/-0.005) for
472
PEO-b-PAA, and 1=0.24 (vs 1,exp=0.12+/-0.01) for PAM-b-PAPTAC. Theoretical values of 1 are in
473
a reasonably good agreement with the experimental ones, knowing the uncertainty on the persistence 474
length (notably for the polyelectrolyte blocks) and monomer sizes. As for P(PEGA)-b-PAA, we only 475
get an estimation of 1,exp=0.13, since the P(PEGA) Kuhn length is not available in the literature. From
476
Figure 5, we can conclude that the linear correlation between Xexp and
0 neutral DP
DP
is confirmed and that 477
model 1 (with hydrodynamic coupling between the two blocks) can be used to transform the Xexp
478 b1 (nm) b (nm) K1 neutral h R (nm)a PAM 0.25 0.642 0.57 0.01447Mw 43 PEO 0.344 0.7444 0.02398 0.53 w M 45 b0 (nm) b (nm) K0 0 h R (nm) PAA 0.25 2.546 0.585 0.007906Mw 2
distributions into compositional
0 neutral DP
DP
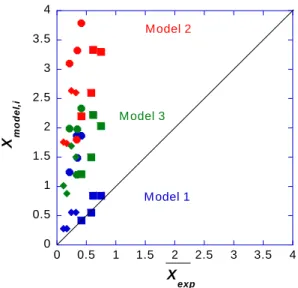
distributions. As for models 2 and 3, they lead to poor 479
correlations between theoreticalXmodel,i versus experimentalXexp values (see Figure 6). 480
The knowledge of 1 provides the last relation necessary to carry on the general scheme presented in
481
Figure 2 to its end and which leads to the distribution of ratio of chemical composition. In practice, we 482
used1,exp obtained in Figure 5 together with equation (10b) to transform the data of Figures 4A to 4D
483
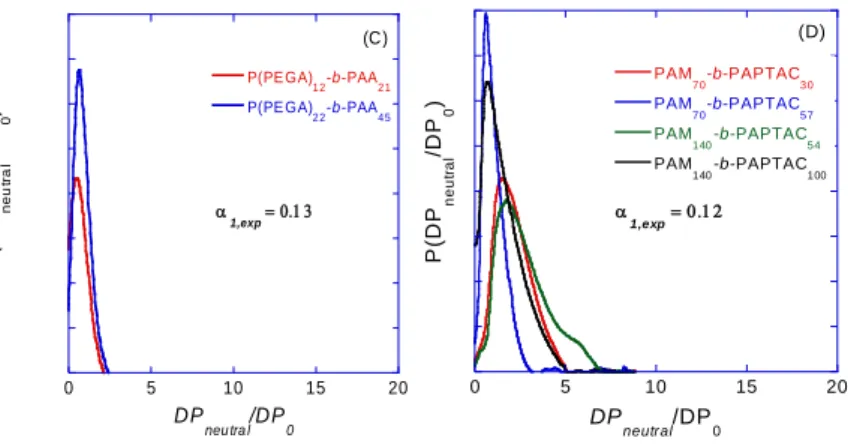
into the distributions presented in Figures 7A to 7D, using the following equation: 484 1 0 0 ( ) ( ) neutral neutral DP P X P P X DP DP DP X (14) 485
Since Xexp and
0 neutral DP
DP
are linearly correlated, the shapes of both distributions are similar. However, 486 reading 0 neutral DP DP
axis, which corresponds to a compositional ratio, is more convenient for the practitioners 487
than keeping the Xexp scale. Moreover, and as previously anticipated, since the 1 coefficients are
488
different from one DHBC to another, the distribution in
0 neutral DP
DP
allows a better comparison between 489
them. On the whole, the dispersion of the composition ratio are in the order of: P(PEGA)-b-PAA < 490
PAM-b-PAPTAC ~ PEO-b-PAA < PAM-b-PAA. 491
0 0.5 1 1.5 2 2.5 3 3.5 4 0 0.5 1 1.5 2 2.5 3 3.5 4 M odel 1 M odel 3 M odel 2 X exp X m o d e l, i 493
Figure 6. Comparison between Xmodel,i and Xexp for the three different models using theoretical
494
parameters given in Table 3. PAM-b-PAPTAC (♦); PEO-b-PAA (●); PAM-b-PAA (■). Xexp was
495
determined by integration of the DHBC peak (in X scale). For all Xmodel,i calculations, theoretical DPneutral
496
and DP0 were used. Xmodel,1was determined according to equations (10b) and (10c), Xmod ,2el according
497
to equation (11a) and Xmod ,3el according to equations (12a), with the characteristic numerical parameters
498 given in Table 3. 499 500 0 5 10 15 20 PAM 70-b-PAA20 PAM 140-b-PAA40 PAM 140-b-PAA60 PAM 140-b-PAA78 P( DP n e u tr a l /D P 0 ) DP neutral/DP0 exp (A) 0 5 10 15 20 PEO 105-b-PAA20 PEO 105-b-PAA30 PEO 210-b-PAA40 PEO 210-b-PAA50 P( DP n e u tra l /D P 0 ) DP neutral/DP0 1,exp (B) 501
0 5 10 15 20 P(PE GA) 1 2-b-PAA2 1 P(PE GA) 2 2-b-PAA4 5 P (D P n e u tr a l /D P 0 ) DP neu tra l/DP0 1,exp (C) 0 5 10 15 20 PAM 70-b-PAPTAC30 PAM 70-b-PAPTAC57 PAM 140-b-PAPTAC54 PAM 140-b-PAPTAC100 P (D P n e u tr a l /D P 0 ) DP neutral/DP0 (D) 1,exp 502
Figure 7. Distribution of composition in terms of the ratio of the degrees of polymerization of both 503
blocks for PAM-b-PAA (A), PEO-b-PAA (B), P(PEGA)-b-PAA (C), and PAM-b-PAPTAC (D). 504
Experimental conditions as in Figure 3.
0 neutral DP
DP
was determined using eq. (10b) and
0 neutral DP P DP was 505
obtained using eq. (14). In (C), the MES peak has been removed. In (A), the sharp peak is a mobility 506
marker (anisic acid) and was deleted before peak integration. 507
508
Conclusion 509
In an effort to make information provided by capillary electrophoresis more directly useful for polymer 510
chemists, a protocol was proposed to convert electrophoretic mobility distributions of double 511
hydrophilic block copolymers into distributions of chemical composition ratios. This ratio of 512
composition is expressed as the ratio of the degrees of polymerization of each block
0 neutral DP DP . To get this 513
composition ratio, we have introduced the retardation parameter X which takes into account the drag 514
force exerted by the neutral block on the polyelectrolyte. The distribution of X that characterizes a DHBC 515
is readily obtained from the experimental electropherogram and the relation between X and the ratio of 516
DP. The latter is available from different models for electrophoretic mobility of composite objects. A
517
linear relation has been found experimentally between the retardation parameter X and the ratio of DPs, 518
within each of the four families of DHBC studied in this work. This result is consistent with the model 519
of electrophoretic mobility of Long et al. that takes into account hydrodynamic coupling, although the 520
prefactors are slightly overestimated. Our experimental findings not only support the theoretical 521
prediction, but also facilitate the last step of data transformation, from distribution of X into distributions 522
of ratios of DP. 523
The dispersions in composition are in the order of: P(PEGA)-b-PAA < PEO-b-PAA ~ PAM-b-PAPTAC 524
< PAM-b-PAA. Therefore, we can conclude that in the DHBC families, the PAM block leads to broader 525
composition ratio distributions compared to a PEO block, when associated to a PAA block. Similarly, 526
the P(PEGA) block lead to less disperse composition ratio distributions compared to a PEO block, when 527
associated to a PAA block. Finally, PAA associated with PAM leads to broader composition ratio 528
distributions compared to PAPTAC associated with PAM. The relatively low composition dispersity of 529
the PEO-PAA block copolymer is most likely due to the low dispersity of the PEO block, prepared by 530
anionic polymerization, and the use of a dithiobenzoate chain transfer agent, which has a higher chain 531
transfer constant and thus gives narrower molar mass distributions than the xanthate chain transfer agent 532
used to prepare the PAM-PAA and PAM-PAPTAC block copolymers. The use of a trithiocarbonate 533
chain transfer agent and a relatively short P(PEGA) block leads to a fairly narrow composition 534
distribution for P(PEGA)-PAA block copolymers. 535
Finally, the transformation of electrophoretic mobility distributions into composition ratio distributions 536
significantly improved the comparison of the distributions between the different copolymer families, 537
since it takes into account the differences in expansion and drag force according to the chemical nature 538
of the blocks. 539
Supporting Information. 540
Synthetic pathway, SEC and NMR characterizations, raw electropherograms are provided for all dibloc 541
copolymers studied in this work. 542
Acknowledgements 543
This work was supported by the MESOPIC project funded by the Agence Nationale de la Recherche 544
(ANR) under grant # ANR-15-CE07-0005. 545
References 546
1. Thevarajah, J. J.; Sutton, A. T.; Maniego, A. R.; Whitty, E. G.; Harrisson, S.; Cottet, H.; 547
Castignolles, P.; Gaborieau, M., Quantifying the Heterogeneity of Chemical Structures in Complex 548
Charged Polymers through the Dispersity of Their Distributions of Electrophoretic Mobilities or of 549
Compositions. Anal. Chem. 2016, 88 (3), 1674-1681. 550
2. Morel, A.; Cottet, H.; In, M.; Deroo, S.; Destarac, M., Electrophoretic Behavior of Amphiphilic 551
Diblock Copolymer Micelles. Macromolecules 2005, 38 (15), 6620-6628. 552
3. Sutton, A. T.; Read, E.; Maniego, A. R.; Thevarajah, J. J.; Marty, J. D.; Destarac, M.; Gaborieau, 553
M.; Castignolles, P., Purity of Double Hydrophilic Block Copolymers Revealed by Capillary 554
Electrophoresis in the Critical Conditions. J. Chromatogr. A 2014, 1372C, 187-195. 555
4. Javakhishvili, I.; Jankova, K.; Hvilsted, S., Neutral, Anionic, Cationic, and Zwitterionic Diblock 556
Copolymers Featuring Poly(2-methoxyethyl acrylate)“Hydrophobic” Segments. Polym. Chem.-UK 557
2013, 4 (3), 662-668. 558
5. Delplace, V.; Harrisson, S.; Tardy, A.; Gigmes, D.; Guillaneuf, Y.; Nicolas, J., Nitroxide‐ 559
Mediated Radical Ring‐Opening Copolymerization: Chain‐End Investigation and Block Copolymer 560
Synthesis. Macromol. Rapid Comm. 2014, 35 (4), 484-491. 561
6. Nejad, E. H.; Castignolles, P.; Gilbert, R. G.; Guillaneuf, Y., Synthesis of Methacrylate 562
Derivatives Oligomers by Dithiobenzoate‐RAFT‐Mediated Polymerization. J. Polym. Sci. A1 2008, 46 (6), 563
2277-2289. 564
7. Jacquin, M.; Muller, P.; Cottet, H.; Crooks, R.; Théodoly, O., Controlling the Melting of 565
Kinetically Frozen Poly(butyl acrylate-b-acrylic acid) Micelles via Addition of Surfactant. Langmuir 2007, 566
8. Jacquin, M.; Muller, P.; Lizarraga, G.; Bauer, C.; Cottet, H.; Théodoly, O., Characterization of 568
Amphiphilic Diblock Copolymers Synthesized by MADIX Polymerization Process. Macromolecules 2007, 569
40 (8), 2672-2682.
570
9. Jacquin, M.; Muller, P.; Cottet, H.; Théodoly, O., Self-Assembly of Charged Amphiphilic Diblock 571
Copolymers with Insoluble Blocks of Decreasing Hydrophobicity: From Kinetically Frozen Colloids to 572
Macrosurfactants. Langmuir 2010, 26 (24), 18681-18693. 573
10. Anik, N.; Airiau, M.; Labeau, M.-P.; Vuong, C.-T.; Reboul, J.; Lacroix-Desmazes, P.; Gérardin, 574
C.; Cottet, H., Determination of Polymer Effective Charge by Indirect UV Detection in Capillary 575
Electrophoresis: Toward the Characterization of Macromolecular Architectures. Macromolecules 576
2009, 42 (7), 2767-2774. 577
11. Chamieh, J.; Martin, M.; Cottet, H., Quantitative Analysis in Capillary Electrophoresis: 578
Transformation of Raw Electropherograms Into Continuous Distributions. Anal. Chem. 2015, 87 (2), 579
1050-1057. 580
12. Long, D.; Ajdari, A., Electrophoretic Mobility of Composite Objects in Free Solution: Application 581
to DNA Separation. Electrophoresis 1996, 17 (6), 1161-1166. 582
13. Long, D.; Viovy, J.-L.; Ajdari, A., Simultaneous Action of Electric Fields and Nonelectric Forces 583
on a Polyelectrolyte: Motion and Deformation. Phys. Rev. Lett. 1996, 76 (20), 3858-3861. 584
14. Vreeland, W. N.; Desruisseaux, C.; Karger, A. E.; Drouin, G.; Slater, G. W.; Barron, A. E., Molar 585
Mass Profiling of Synthetic Polymers by Free-Solution Capillary Electrophoresis of DNA− Polymer 586
Conjugates. Anal. Chem. 2001, 73 (8), 1795-1803. 587
15. Nedelcu, S.; Slater, G. W., Branched Polymeric Labels Used as Drag‐Tags in Free‐Solution 588
Electrophoresis of ssDNA. Electrophoresis 2005, 26 (21), 4003-4015. 589
16. Chubynsky, M. V.; Slater, G. W., Theory of End‐Labeled Free‐Solution Electrophoresis: Is the 590
End Effect Important? Electrophoresis 2014, 35 (5), 596-604. 591
17. Chubynsky, M. V.; Slater, G. W., Electrophoresis of Heteropolymers. Effect of Stiffness. 592
Macromolecules 2015, 48 (16), 5899-5913.