HAL Id: hal-01950125
https://hal.archives-ouvertes.fr/hal-01950125
Submitted on 10 Dec 2018HAL is a multi-disciplinary open access archive for the deposit and dissemination of sci-entific research documents, whether they are pub-lished or not. The documents may come from teaching and research institutions in France or abroad, or from public or private research centers.
L’archive ouverte pluridisciplinaire HAL, est destinée au dépôt et à la diffusion de documents scientifiques de niveau recherche, publiés ou non, émanant des établissements d’enseignement et de recherche français ou étrangers, des laboratoires publics ou privés.
The inbreeding strategy of a solitary primate,
Microcebus murinus
E. Huchard, S. Schliehe-Diecks, P. Kappeler, C. Kraus
To cite this version:
E. Huchard, S. Schliehe-Diecks, P. Kappeler, C. Kraus. The inbreeding strategy of a solitary primate, Microcebus murinus. Journal of Evolutionary Biology, Wiley, 2017, 30 (1), pp.128-140. �10.1111/jeb.12992�. �hal-01950125�
1
Published in final edited form in Journal of Evolutionary Biology, DOI: 10.1111/jeb.12992
1 2
The inbreeding strategy of a solitary primate, Microcebus murinus
3 4 5 Huchard, Elise 1,* 6 Schliehe-Diecks, Susanne 2, 3,* 7 Kappeler, Peter M. 2, 3 8 Kraus, Cornelia 2, 3 9 10
1 CEFE UMR 5175, CNRS - Université de Montpellier, 1919 Route de Mende, 34295 Montpellier 11
Cedex 5, France 12
13
2 Behavioral Ecology Sociobiology Unit, German Primate Center, Kellnerweg 4, 37077 14
Göttingen, Germany 15
16
3 Department of Sociobiology/Anthropology, Georg-August-University of Göttingen, 17
Kellnerweg 6, 37077 Göttingen, Germany 18
19
*These two authors contributed equally. 20
21 22 23
Short title: Inbreeding in wild mouse lemurs 24
25 26
Corresponding author: Elise Huchard 27 E-mail: ehuchard@gmail.com 28 Phone: +33 4 67 61 32 47 29 30 31
2 1. ABSTRACT
32
Inbreeding depression may be common in nature, reflecting either the failure of inbreeding 33
avoidance strategies, or inbreeding tolerance when avoidance is costly. The combined 34
assessment of inbreeding risk, avoidance and depression is therefore fundamental to evaluate 35
the inbreeding strategy of a population, i.e., how individuals respond to the risk of inbreeding. 36
Here, we use the demographic and genetic monitoring of 10 generations of wild grey mouse 37
lemurs (Microcebus murinus), small primates from Madagascar with overlapping generations, 38
to examine their inbreeding strategy. Grey mouse lemurs have retained ancestral mammalian 39
traits including solitary lifestyle, polygynandry and male-biased dispersal, and may therefore 40
offer a representative example of the inbreeding strategy of solitary mammals. The 41
occurrence of close kin among candidate mates was frequent in young females (~37%, most 42
often the father) and uncommon in young males (~6%) due to male-biased dispersal. 43
However, close kin consistently represented a tiny fraction of candidate mates (<1%) across 44
age and sex categories. Mating biases favouring partners with intermediate relatedness were 45
detectable in yearling females and adult males, possibly partly caused by avoidance of 46
daughter-father matings. Finally, inbreeding depression, assessed as the effect of 47
heterozygosity on survival, was undetectable using a capture-mark-recapture study. Overall, 48
these results indicate that sex-biased dispersal is a primary inbreeding avoidance mechanism 49
at the population level, and mating biases represent an additional strategy that may mitigate 50
residual inbreeding costs at the individual level. Combined, these mechanisms explain the 51
rarity of inbreeding and the lack of detectable inbreeding depression in this large, genetically 52
diverse population. 53
3
Keywords: sex-biased dispersal, inbreeding risk, inbreeding avoidance, mate bias, 55
heterozygosity, survival, Microcebus murinus 56
57
2. INTRODUCTION 58
Inbreeding depression is defined as a decline of fitness in offspring of related individuals 59
relative to offspring of unrelated individuals (Charlesworth & Charlesworth, 1987). Decreases 60
in the fitness of inbred individuals are thought to result from a reduced reaction scope of the 61
immune system and/or from deleterious combinations of recessive alleles in the genome due 62
to genome-wide increased homozygosity (Charlesworth & Charlesworth, 1987, Charlesworth 63
& Willis, 2009). Fitness-related traits found to be negatively affected by inbreeding include 64
birth weight (Coltman et al., 1998, Coulson et al., 1998), development (Diehl & Koehn, 1985, 65
Charpentier et al., 2006, Nielsen et al., 2012), reproductive success (Foerster et al., 2006, Zeh 66
& Zeh, 2006), resistance to disease and environmental stress (Coltman et al., 1999, Acevedo-67
Whitehouse et al., 2003) and survival (Acevedo-Whitehouse et al., 2003). Effects are often 68
age-dependent, with younger individuals suffering higher levels of inbreeding depression 69
(Stockley et al., 1993, Markert et al., 2004, Cohas et al., 2009) although inbreeding effects on 70
adult traits have been far less studied and could also impose a substantial cost to fitness 71
(Grueber et al., 2010). 72
Inbreeding depression may commonly occur in wild populations (Saccheri et al., 1998, 73
Keller & Waller, 2002), and its implications for extinction risk have long been debated (Lande, 74
1988, Caro & Laurenson, 1994). It is a question of considerable significance at a time when 75
population fragmentation and associated loss of genetic diversity may threaten the viability 76
of many populations (Hedrick, 2000). Nevertheless, it remains difficult to evaluate the 77
frequency and intensity of inbreeding depression across wild populations for several reasons. 78
4
First, it is often difficult to assess patterns of parentage in large representative samples of 79
individuals with known life-histories in natural populations. Second, studies focusing on 80
inbreeding effects may often target small or fragmented populations. Third, a potential 81
publication bias towards positive results might further bias the empirical record (Chapman et 82
al., 2009). Multigenerational individually-based studies of vertebrates offer a unique
83
opportunity to generate unbiased estimates of the occurrence and fitness costs of inbreeding 84
depression across taxa (Kempenaers et al., 1996, Keller, 1998, Walling et al., 2011, Nielsen et 85
al., 2012, Szulkin et al., 2013). 86
Inbreeding depression may represent a significant evolutionary pressure even where 87
it is undetectable. Inbreeding risk may be intrinsically low in a given population due to a 88
combination of demographic and life history factors as in large populations with non-89
overlapping generations, but it may also be actively contained by behavioural strategies of 90
inbreeding avoidance, including sex-biased dispersal (Greenwood, 1980, Clutton-Brock, 1989, 91
Pusey & Wolf, 1996) or discrimination against related mates (Tregenza & Wedell, 2000, 92
Kempenaers, 2007). Estimating the extent of inbreeding depression is therefore insufficient 93
to evaluate the evolutionary importance of inbreeding within and across taxa. 94
In addition, some studies indicate that animals sometimes show no inbreeding 95
avoidance or even preferentially mate with relatives, suggesting that inbreeding is not 96
universally detrimental and that ‘inbreeding strategies’ may differ across individuals, 97
populations and species, according to the relative costs and benefits of inbreeding and of 98
inbreeding avoidance (Bateson, 1978, Szulkin et al., 2013). Avoiding mating with kin may 99
sometimes be more costly than having inbred offspring. Moreover, kin selection theory 100
suggests that inbreeding may be adaptive under specific circumstances, by increasing the 101
5
relatedness between parents and offspring (Bateson, 1978, Waser et al., 1986, Kokko & Ots, 102
2006, Puurtinen, 2011, Szulkin et al., 2013). Overall, the current state of the field suggests that 103
our theoretical understanding of animal inbreeding strategies remains limited and calls for 104
further empirical efforts to examine inbreeding risk, inbreeding avoidance strategies and 105
depression in concert. 106
This study presents a quantitative investigation of inbreeding risk, avoidance and 107
depression in a large population of wild primates. Grey mouse lemurs (Microcebus murinus) 108
are small nocturnal and solitary foragers distributed along Southern and Western Madagascar 109
(Kappeler & Rasoloarison, 2003). They are polygynandrous with no paternal care (Eberle & 110
Kappeler, 2004a). Individuals acquire feeding independence at around 2 months of age and 111
can reproduce for the first time at 10 months of age and then every year thereafter. Each 112
female is sexually receptive for one to two nights per year, and may mate with up to seven 113
different males during those nights, while up to 14 candidate males have been observed 114
around a receptive female (Eberle & Kappeler, 2004a). Mortality rates of grey mouse lemurs 115
are high, especially in the first year of life (Kraus et al., 2008) but some individuals survive 6 to 116
10 years (unpublished observation), which generates a potential overlap between 117
reproductive periods of parents and offspring and may create inbreeding risk. Natal dispersal 118
is strongly male-biased (Schliehe-Diecks et al., 2012) and secondary dispersal, where 119
individuals disperse repeatedly, is low (Radespiel et al., 2001, Eberle & Kappeler, 2002, 120
Kappeler & Rasoloarison, 2003, Fredsted et al., 2005) so that fathers often live close to their 121
philopatric daughters and individual variation in relatedness levels is locally high, creating 122
ample opportunities for inbreeding avoidance or tolerance (Radespiel et al., 2001, Fredsted et 123
al., 2004, Fredsted et al., 2005). 124
6
Two previous studies have detected mate choice for dissimilar partners at immune 125
genes of the Major Histocompatibility Complex (MHC) in females of this population 126
(Schwensow et al., 2008, Huchard et al., 2013), but avoidance of mating with kin was only 127
detected by one of these studies, where mated pairs were less related than random pairs. This 128
study, however, only adopted a female perspective and did not document the extent of 129
inbreeding risk and depression across age and sex categories (Huchard et al., 2013). Here, we 130
extend these studies and combine a 10-generation dataset of a capture-mark-recapture 131
(CMR) study with genetic data to provide an integrative analysis of inbreeding risk and its 132
evolutionary consequences in a natural primate population by estimating, for both the 133
philopatric sex (females) and the dispersing sex (males) in adults and in yearlings, the extent 134
of (1) inbreeding risk, (2) inbreeding avoidance via mating biases between actual mates and 135
random members of the mating pool (although observing such a bias does not inform us on 136
the choosy sex, as choice by one sex will generate a detectable mating bias in the other sex), 137
and (3) inbreeding depression by quantifying the survival cost of inbreeding. 138
139
3. METHODS 140
3.1 Study population and trapping procedures
141
The study population is located within a 12,500 ha forestry concession of the Centre National 142
de Formation, d'Etude et de Recherche en Environnement et Foresterie (C.N.F.F.R.E.F.) in 143
Kirindy Forest (Kappeler & Fichtel, 2012). Since 1994, DNA samples and population parameters 144
have been collected during monthly captures using about 160 traps at a time in an area of 145
about 9 ha within a 60 ha grid system. Additional captures in surrounding areas were 146
conducted once or twice a year and covered an area of about 18 ha. For trapping, Sherman 147
7
live traps were baited with small pieces of banana and positioned near trail intersections at 148
dusk on three consecutive nights. Captured animals were collected at dawn and marked with 149
subdermal transponders if captured for the first time, and otherwise simply weighed and 150
handled according to published protocols (Eberle & Kappeler, 2002). Data on 1,298 individuals 151
were available for analyses between 2000 and 2010. 152
153
3.2 Microsatellite DNA analyses
154
DNA was isolated from ear biopsies, using the QIAGEN QIAamp Tissue Kit for DNA Purification 155
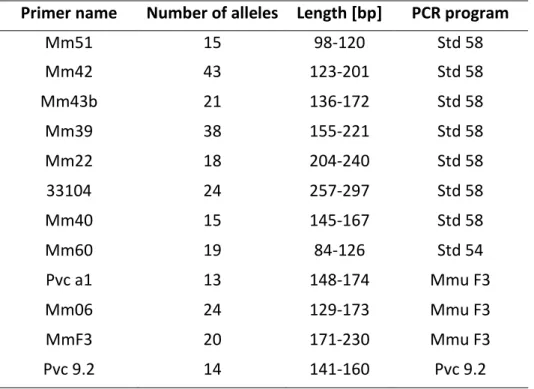
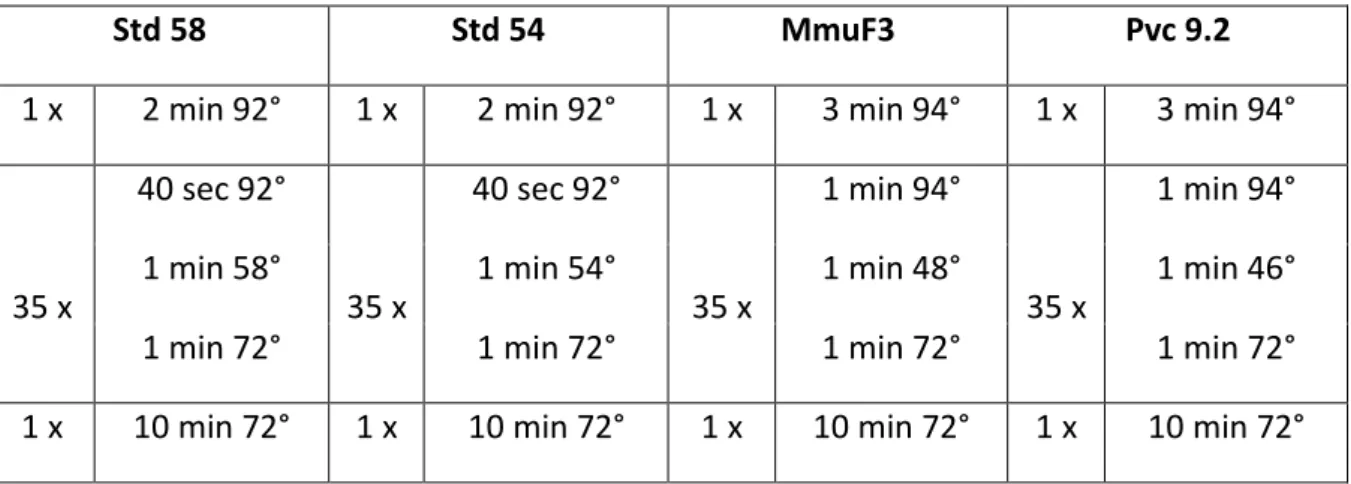
(Qiagen) (Eberle & Kappeler, 2004b). DNA amplification and sequencing are described in 156
Supporting Information, Appendix S1. A total of 1073 to 1278 individuals were typed for each 157
locus, with an average of 21.5 alleles per locus. 158
159
3.3 Parentage analyses and calculation of relatedness estimates and heterozygosity
160
Parentage analyses for determination of true parents and their spatial distribution were based 161
on a likelihood analysis using CERVUS 3 (Kalinowski et al., 2007) and COLONY v 2.0.1.9 (Jones 162
& Wang, 2010) and are fully described in the Supporting Information, Appendix S2. 163
Relatedness estimates were calculated with the software COANCESTRY v 1.0.0.0 (Wang, 2011) 164
for all individuals captured between 1999 and 2010, based on the triadic individual by descent 165
(IBD) ‘TrioML’ index (Wang, 2007), which uses the genotypes of a triad of individuals in 166
estimating pairwise relatedness (r). To estimate individual genome-wide heterozygosity, we 167
calculated the homozygosity by loci (HL) index of Aparicio et al. (2006), which has been found 168
to perform better than two other estimators of heterozygosity, internal relatedness (IR) (Amos 169
8
et al., 2001) or uncorrected homozygosity (HO, Aparicio et al., 2006). Unless otherwise stated,
170
all analyses were run in R 3.0.2 (R Development Core Team 2013). 171
172
3.4 Assignment of candidate mates
173
A list of candidate mates was established for each individual and for each mating season in 174
our sample (thereafter referred to as a “mating season”) following Huchard et al. (2013). 175
Individuals were considered as candidate mates if they fulfilled the following three criteria: (1) 176
they were present in captures immediately preceding or following the mating season (there 177
are no captures during the mating season, in order to avoid potential disruption of mating 178
patterns) to ensure that only live animals were included in the analysis; (2) the average 179
distance between home range centres of partners is lower than the maximum distance 180
recorded between the two parents of an offspring using long-term parentage data from this 181
population (females: perimeter=319m; males: perimeter=336m, see Huchard et al. (2013)).; 182
(3) they ranged within the core study area where the demographic monitoring has been 183
regular and continuous throughout the study period. A total of 56 females and 81 males that 184
were found to be part of a parent-offspring triad between 2000 and 2010 were included in 185
the analyses. 186
187
3.5 Estimating inbreeding risk
188
To estimate inbreeding risk, we used parentage analyses and pedigree data to determine 189
whether first order relatives (parent-offspring and full siblings) were present within pools of 190
candidate mates. Inbreeding risk was quantified by its occurrence and intensity and compared 191
between males and females and between yearlings and adults. The occurrence of inbreeding 192
9
risk was computed as the presence/absence of at least one first order relative in each mating 193
season. To test for possible sex and age differences in the occurrence of inbreeding risk, we 194
ran a binomial generalized linear mixed model (GLMM) (response variable: presence/absence 195
of at least one first order relative during a mating season) including the fixed effects sex, age 196
and their interaction and the crossed random effects year and individual identity, to control 197
for the non-independence of observations from a same individual or from a same year. Then, 198
we computed the intensity of inbreeding risk by calculating, for each mating season, the 199
proportion of first order relatives among the candidate mates. We evaluated age and sex 200
effects on the intensity of inbreeding through a second binomial GLMM with the same 201
structure of fixed and random effects as the occurrence model (response variable: number of 202
first order relatives/number of candidates in a given season). 203
Model selection was based on AIC or one of its appropriate variants (here QAICc which 204
adjusts for small sample sizes and the presence of overdispersion, Burnham & Anderson, 205
2002) using the dredge function from the MuMIn package (Barton, 2015) in R 3.0.2. We 206
interpreted model selection results based on AICc differences (Δi) and normalised Akaike
207
weights (wi) as described by Burnham & Anderson (2002). We further computed estimates of
208
fixed effects for the top models. 209
210
3.5 Investigating inbreeding avoidance
211
To test whether relatedness among mates is minimized, we compared the mean observed 212
relatedness values of the parents in our long-term dataset to a distribution of the mean 213
relatedness values of randomly matched partners generated under the null hypothesis of 214
random mating. We further compared the mean-corrected variance (assessed by the 215
10
coefficient of variation) in the relatedness of true versus randomly assigned parents for two 216
reasons. First, if some individuals avoid inbreeding whereas others preferentially inbreed, 217
mean observed relatedness could match null expectation but with an increased variance 218
(Szulkin et al., 2013). Second, if individuals avoid mates that are either too closely or too 219
distantly related, thereby optimizing rather than minimizing relatedness to their mates, mean 220
observed relatedness could match null expectation but with a decreased variance. The 221
coefficient of variation (‘CV’, standard deviation divided by the mean) was used as a measure 222
of variance to ensure that results would be statistically independent from results obtained on 223
the mean. The correlation between mean and variance of parental relatedness was positive 224
and high in all four samples (yearling females, adult females, yearling males and adult males) 225
with Pearson’s r values comprised between 0.70 and 0.80 (df=19998 and p<10-15 in all four 226
cases), while there was no correlation between mean relatedness and the coefficient of 227
variation in relatedness (Pearson’s r was comprised between -0.09 and -0.03 in all four cases). 228
Finally, we tested whether individuals may choose partners with high heterozygosity, which 229
may occur if these partners are more competitive than, or preferred over, less heterozygous 230
individuals. They could be preferred if choosing a heterozygous partner brings direct benefits 231
(such as a decreased risk of infection by sexually transmitted diseases) or indirect benefits 232
(such as the transmission of rarer – and therefore more heterozygous - genotypes to offspring) 233
(Fromhage et al., 2009; Kempenaers, 2007). 234
The distribution of the mean and coefficient of variation of relatedness between 235
random partners to an individual was generated by randomly matching each individual 20,000 236
times to one mate of their pool of candidate mates for a given mating season. P-values were 237
computed in two ways, due to the difficulties, and the resulting lack of consensus, regarding 238
the calculation of two-sided p-values in the case of asymmetrical distributions (e.g., Gibbons 239
11
& Pratt, 1975, Kulinskaya, 2008), as well as to facilitate future meta-analytic approaches: first, 240
a one-tailed p-value was computed as the proportion of cases displaying a lower (for mean 241
and variance of relatedness) or greater (for mean heterozygosity) than the observed value. 242
Second, an exact two-tailed p-value was computed as the proportion of cases displaying a 243
greater value than the observed value for successful partners plus the proportion of cases 244
displaying a lower value than the symmetrical (relative to the simulated mean) of the observed 245
value. Results are presented using both one- and two-tailed p-values, and interpreted based 246
on the two-tailed p-value, in order to be conservative, and consistent with other analyses 247
presented in this study. Note that more than one individual could be chosen per mating season 248
since mouse lemurs commonly give birth to mixed-paternity litters (Eberle & Kappeler, 2004b) 249
and that some individuals appeared repeatedly in the dataset, which is inevitable in a system 250
where both home ranges and generations are overlapping. We further tested whether 251
individuals choose partners that have higher heterozygosity than randomly matched 252
individuals following the same procedure. 253
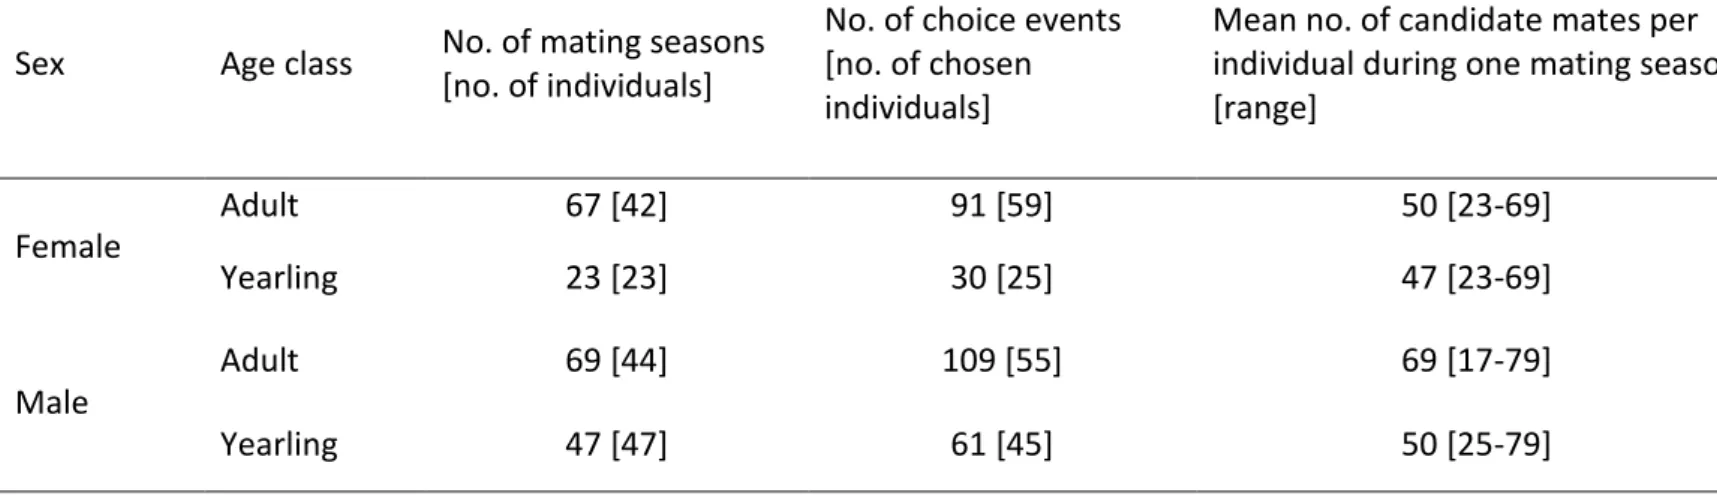
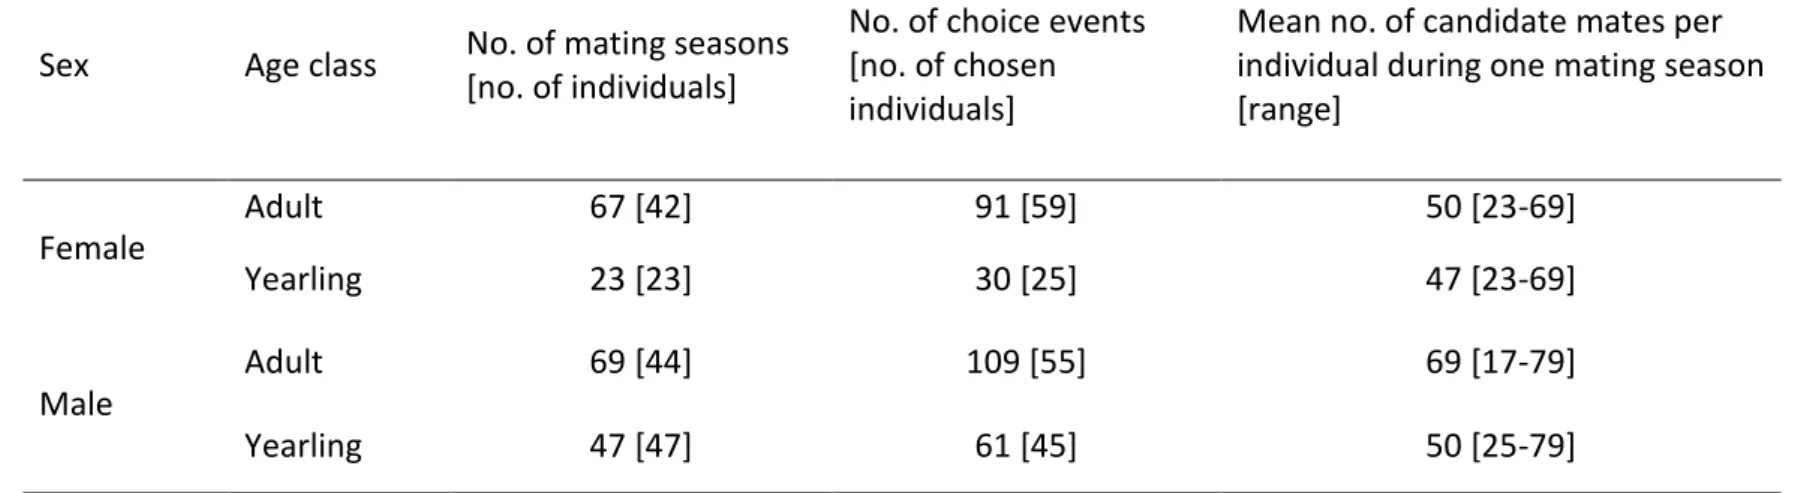
We ran these simulation tests for datasets of adults and yearlings in both females and 254
males (Table 1). We specifically compared patterns occurring in adults and yearlings to test 255
whether the strength of mate selectivity may reflect variation in inbreeding risk across 256
individuals belonging to different sex and age classes. 257
258
3.6 Heterozygosity and survival
259
To determine whether heterozygosity affected survival probabilities, we used a two-step 260
approach (similar to Cohas et al., 2009). We first modelled survival and recapture probabilities 261
using capture-mark-recapture models (Lebreton et al., 1992). We selected the most 262
12
parsimonious model out of a candidate set of models using AIC (Burnham & Anderson, 2002). 263
In the second step, we added heterozygosity as an individual covariate to this basic model to 264
test specific hypotheses regarding survival consequences of variation in heterozygosity using 265 likelihood-ratio tests (LRT). 266 267 3.6.1 Capture-mark-recapture data 268
To model survival probabilities, we used CMR data from 1999 to 2011. We did not include 269
data from before 1999 because too few animals from these cohorts were genotyped. As 270
described in Kraus et al. (2008), we estimated seasonal survival using data from the main 271
trapping season at the onset of the austral winter (April/May) and the secondary trapping 272
session at the onset of summer (end of the dry season), before the mating season starts in 273
October. We could not use the summer trapping season from 2004, since it was conducted 274
too late. Hence, we created a dummy trapping season (“10 October”) and fixed its recapture 275
probabilities at 0. The complete data set included 481 animals (294 males, 187 females) for 276
which we have heterozygosity estimates and which were caught a total of 1031 times. 277
278
3.6.2 Modelling survival probabilities 279
We used the Cormack-Jolly-Seber model for open populations (CJS: Cormack, 1964, Jolly, 280
1965, Seber, 1965) implemented in the program MARK (White & Burnham, 1999) to 281
statistically model survival (ϕ) and recapture probabilities (p). As for GLMMs, model selection 282
was based on AIC or one of its appropriate variants (here QAICc which adjusts for small sample 283
sizes and the presence of overdispersion Burnham & Anderson, 2002). 284
13
We first assessed the goodness-of-fit of global models using the median-ĉ approach 285
implemented in the program MARK. The variance inflation factor ĉ was estimated to be slightly 286
above 1 (ĉ=1.09), indicating a low level of extra-binomial variance. We still adjusted model 287
selection statistics (QAICc, QDeviance) accordingly. For the basic seasonal survival model we
288
considered the factors sex (s), age (a) and time (t). To evaluate state-determined effects of 289
heterozygosity and to account for high mortality in the first year of life (Kraus et al., 2008), age 290
was represented by three classes: juveniles (juv, 3-9 months old, i.e., first winter), yearlings 291
(yrl: 10-16 months old, i.e., first summer, first breeding season) and adults (ad: > 16 months 292
old).Our candidate model set was partly based on a priori knowledge from an earlier study 293
on seasonal survival of the same mouse lemur population which included the years 1995 to 294
2005 (Kraus et al., 2008). As our global model (GM), we used ϕW(a*s+t) ϕS(a*s+t) pW(a*s+t) 295
pS(a*s+t) (W: winter, S: summer, *: interactive effect, +: additive effect). 296
This analysis uses CMR data from 1999-2011 and hence only partially overlaps with the 297
data set from the earlier study. Moreover, strong population fluctuations were observed 298
between 2005 and 2011 (with, e.g., a mean of 23 individuals captured across capture sessions 299
in 2005, and of 56.5 in 2008). Therefore we did not simply use the top model from that analysis 300
for further inference, but included candidate models incorporating model terms that received 301
some support in the confidence set of models established in that analysis (all models with a 302
relative likelihood >0.05, Kraus et al., 2008). All candidate models for winter survival included 303
an age effect, because natal male dispersal in the Kirindy population takes place between April 304
and September (Eberle & Kappeler, 2004b). With the CJS-model we cannot separate 305
emigration and mortality, and hence estimates for juvenile males represent so-called 306
“apparent survival” probabilities. We do know that female dispersal and/or secondary male 307
dispersal are at most very rare events in this population (Eberle & Kappeler, 2004b) and thus, 308
14
we feel confident that estimates for these sex-age-classes closely estimate “true survival” 309
probabilities. Hence, our candidate models for winter and summer recapture probabilities, as 310
well as for summer survival included a*s+t (GM), a+s+t, a+t, s+t and t. For winter survival we 311
used a*s+t, a*s, juv(s)ad(.) and a. 312
In order to limit the total number of models, we selected the most parsimonious model 313
for each major model part (i.e., survival winter, survival summer, recapture summer, 314
recapture winter) against the global model for the remaining model parts. We then built our 315
basic survival and recapture model by combining the selected models for each part. 316
317
3.6.3 Effects of heterozygosity 318
To test for an association between heterozygosity levels and survival, we added our 319
heterozygosity estimate (HL) as an individual covariate to the most parsimonious model for 320
survival and recapture probabilities (the basic model). Because the basic model and those 321
incorporating heterozygosity effects are nested, we compared these models using likelihood 322
ratio tests (LRTs, a=0.05). Our LRTs aimed to address 3 specific hypotheses. (1) We tested for 323
an overall effect of heterozygosity on mouse lemur survival. We excluded juvenile males from 324
the heterozygosity effect, because for these we cannot distinguish between survival and 325
emigration (see above). (2) Based on the idea that heterozygosity effects can be age-specific 326
(Cohas et al., 2009), we added the heterozygosity effect only for juvenile females (i.e., first 327
winter survival). (3) To evaluate the hypothesis that heterozygosity effects are exacerbated 328
under harsher conditions (Kempenaers, 2007), we added the heterozygosity effect only to 329
summer survival, and, respectively, only to male summer survival, because survival was found 330
to be substantially lower in summer and even more so in males, probably reflecting the costs 331
15
of intrasexual competition over reproduction (see also Kraus et al., 2008). Because 332
heterozygosity estimates were rather high, we always tested for a linear and for a quadratic 333
effect. Linear effects were expected to show improved survival chances with increasing 334
heterozygosity. Quadratic effects would represent an optimal heterozygosity level between 335
inbreeding and outbreeding depression. None of the effects tested were statistically 336
significant; therefore we did not correct p values for multiple testing. 337 338 4. RESULTS 339 4.1 Inbreeding risk 340
Inbreeding risk was moderate in males and females. First, our estimates of the number of 341
candidate mates per female were high, ranging from 23 to 69 males (Table 1; mean=49). 342
Similarly, the number of candidate mates per male ranged from 17 to 79 females (Table 1; 343
mean = 51). For females, there were 21% of mating seasons (19 of 90) during which a father 344
(n=13), a son (n=4) or both (n=2) were present as potential mates. For males, there were 16% 345
of mating seasons (19 of 116) for which first order relatives were present in the mating pool. 346
In five cases, two first order relatives were present (four times two daughters and once the 347
mother and a daughter). In the remaining 14 mating seasons, a mother (n=6), a daughter (n=7) 348
or a full-sister (n=1) of the male was present. Within individuals, the presence of a 1st order 349
relative in the mating pool was usually observed in one and maximum two mating seasons, 350
with one exception: one female coexisted with her father for seven years. 351
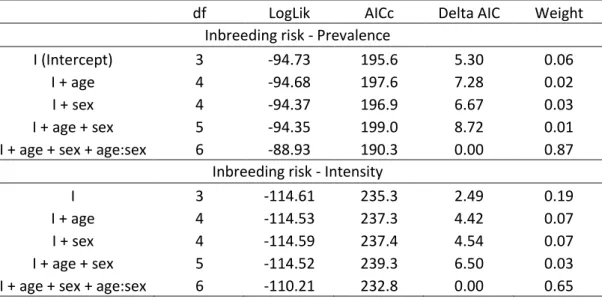
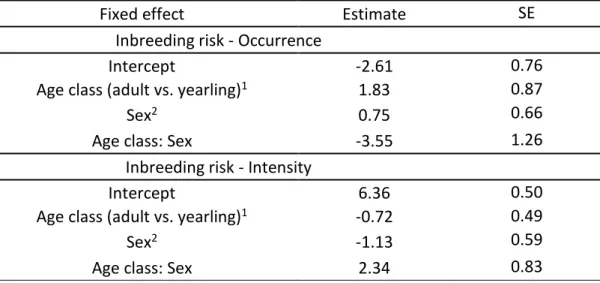
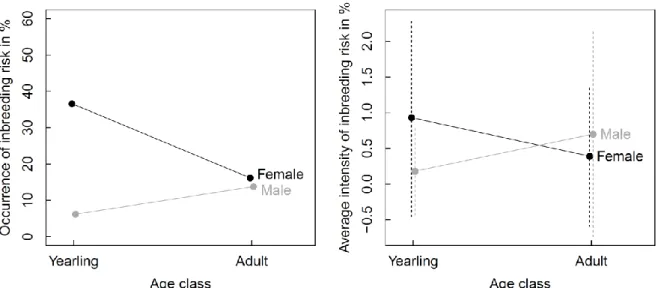
Sex and age classes differed with respect to the occurrence and intensity of inbreeding 352
risk, as the best models included a sex by age interaction for both the occurrence and the 353
intensity models of inbreeding risk (Tables 2 & 3, Fig 1). For females, the occurrence and 354
16
intensity were both higher for yearlings than for adults, with more than a third of young 355
females having at least one close kin in their mating pool. For males, the occurrence and 356
intensity of inbreeding risk increased with age. While occurrence reached comparable levels 357
for adult males and females, the average intensity of inbreeding risk was approximately twice 358
as high for adult males as for adult females. However, intensity remained low in both sexes 359
and at all ages, since first order relatives constituted only a tiny fraction of the candidate mate 360
sets (mean±SD, young females: 0.93±1.39%, young males: 0.18±0.62%, adult females: 361 0.39±0.99%, adult males: 0.70±1.44%). 362 363 4.2 Inbreeding avoidance 364
In the present 10-generation data set, no case of breeding between first order relatives could 365
be detected. The closest proven case of reproduction between individuals with a known 366
common ancestor in this population was a coupling of aunt and nephew (inbreeding 367
coefficient (f) ≈ 0.125). For other true parents displaying a relatively high coefficient of 368
relatedness (TrioML > 0.20), we were not able to detect any close family relationships through 369
the pedigree data. 370
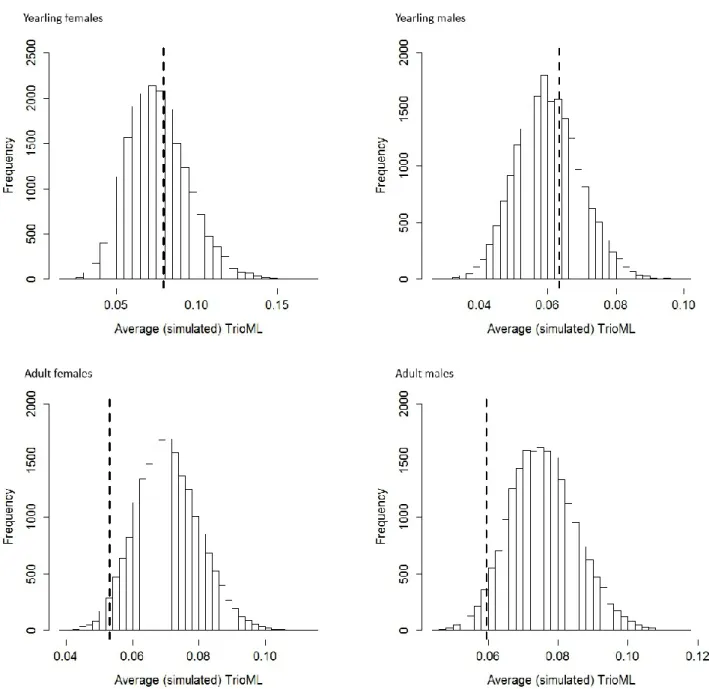
For adults of both sexes, average relatedness (mean TrioML) of true parents tended to 371
be lower than simulated averages (Table 4, Fig. 2). The results for yearlings showed no 372
significant deviation from random mate choice in both females and males (Table 4, Fig. 2). A 373
shift towards lower values of relatedness to mates was observed in the random distribution 374
for yearling males compared to both adult males and yearling females (Fig. 2), probably as a 375
consequence of the change in their genetic environment following natal dispersal. 376
17
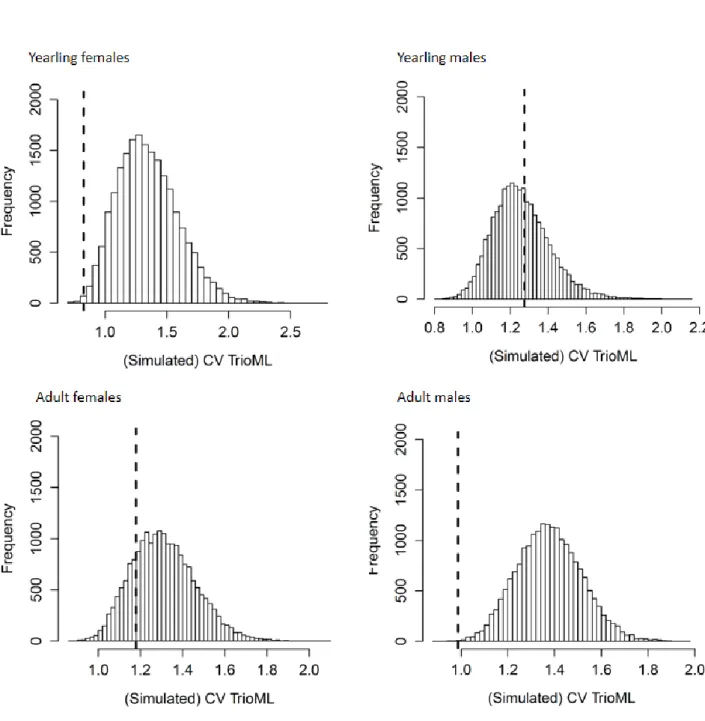
For both yearling females and adult males, the observed coefficient of variation of 377
relatedness estimates for true parents was significantly lower than expected under random 378
mating (Table 4, Fig 3). 379
Finally, there was no departure from random expectations concerning the mean 380
heterozygosity of chosen mates. 381
382
4.3 Heterozygosity and survival
383
The most parsimonious survival model selected from the set of candidate models was the 384
same as in the earlier study (covering the years 1995-2005), and parameter estimates were 385
similar, suggesting that the survival patterns found are quite representative for this population 386
(Table 1; Kraus et al., 2008). There was little model selection uncertainty in choosing the most 387
parsimonious model for recapture probabilities and summer survival: an additive effect of sex 388
to temporal variation was strongly supported for each of these model parts (pW: w
+(s+t)=0.93, 389
pS: w
+(s+t)=0.87, ϕS: w+(s+t)=0.75). Summer survival probabilities varied between 0.38 and 390
0.84 among years with female survival exceeding male survival (geometric means 391
ϕS
females=0.61±0.09SE, 95%CIs=[0.40; 0.77], ϕSmales=0.55±0.10SE, 95%CIs=[0.35; 0.73], all 392
probabilities are given on a semi-annual time-scale). In contrast, winter survival was rather 393
constant over the years (w+(no t)=0.99), and higher than summer survival, with juveniles 394
surviving less well than adults (ϕW
ad males=ϕWad females=0.88±0.04SE, 95%CIs=[0.77; 0.94], ϕWjuv 395
females=0.75±0.08SE, 95%CIs=[0.56; 0.87], ϕWjuv males=0.52±0.06SE, 95%CIs=[0.41; 0.62]). We 396
cannot currently estimate how much of the difference between juvenile male and female 397
survival is due to male natal dispersal. Despite important variation in heterozygosity in our 398
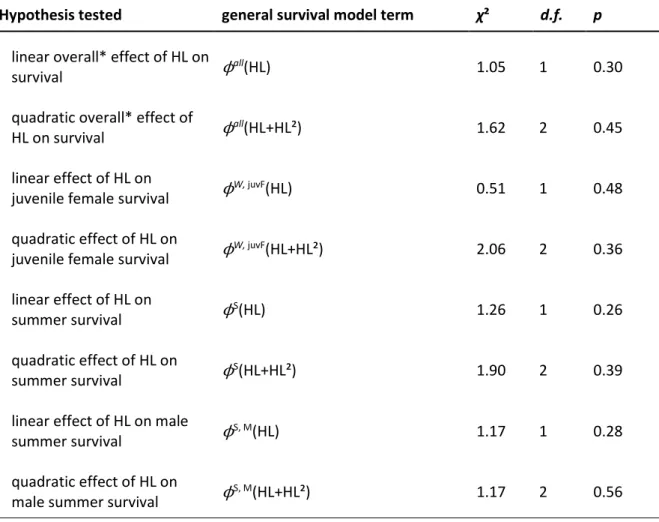
sample (n=525, range: 0.00-0.60, mean±SD=0.18±0.10), we did not find any statistical 399
18
evidence for a linear or quadratic effect of heterozygosity on overall (excluding juvenile 400
males), juvenile female, summer, or male summer survival (Table 6). 401
402
5. DISCUSSION 403
We used a ten-generation dataset to investigate the extent of inbreeding risk in a solitary and 404
polygynandrous mammal, the grey mouse lemur. The home range of one male typically 405
encompasses the home ranges of several females (Eberle & Kappeler, 2002, Eberle & 406
Kappeler, 2004b, Eberle & Kappeler, 2004a), a social system that is close to the ancestral 407
mammalian state and remains widespread in extant mammals (Lukas & Clutton-Brock, 2013). 408
Inbreeding risk was generally low and primarily resulted from reproductive overlap 409
between generations, where the reproductive lifespan of one sex exceeded the 410
developmental period of the other sex. Its variation across ages and sexes was directly shaped 411
by a combination of life-history traits including age at first breeding, reproductive longevity 412
and sex-biased natal dispersal. Across age and sex categories, the relatively frequent 413
occurrence of close kin in the mating pool was always diluted by the large size of the mating 414
pool, with each individual having about 20 to 70 candidate mates. Female grey mouse lemurs 415
reach sexual maturity at around 9 months and frequently have at least one first order relative 416
among candidate mates during their first breeding season, usually their father and 417
occasionally a brother. Inbreeding risk decreases as a function of female age, reflecting the 418
progressive disappearance of females’ fathers. It was lowest for young males, who have just 419
dispersed into unfamiliar areas, and subsequently increased as a function of male age and 420
reproductive success, reflecting the presence of one or more daughters in the surrounding 421
area. 422
19
Male-biased dispersal therefore appears as the primary inbreeding avoidance 423
mechanism in grey mouse lemurs. Whereas male-biased dispersal is the ancestral condition 424
in mammals (Lukas & Clutton-Brock, 2011) and remains considerably more frequent than 425
female-biased dispersal across extant species (Greenwood, 1980, Pusey, 1987, Clutton-Brock, 426
1989, Clutton-Brock & Lukas, 2012), comparative analyses indicate that female dispersal has 427
evolved in some group-living species where females start to breed while their father is still 428
reproductively active in their natal group (Clutton-Brock, 1989, Lukas & Clutton-Brock, 2011). 429
This suggests that sex-biased dispersal may have primarily evolved in response to inbreeding 430
risk, rather than under the influence of other selective pressures like kin competition or the 431
distribution of food resources. Under this scenario, it may appear unclear why males, rather 432
than females, disperse in grey mouse lemurs. Unlike many solitary mammals where females 433
are intolerant of other females, grey mouse lemur females forage solitarily but rest and breed 434
communally with female kin (Radespiel et al., 2001, Eberle & Kappeler, 2002, Eberle & 435
Kappeler, 2006) so they may derive direct benefits from social philopatry, like many group-436
living mammals (Clutton-Brock & Lukas, 2012). In such conditions, females may only disperse 437
when unrelated mates are unavailable, for example if their father holds the dominant 438
breeding status and monopolizes most reproduction in their group by the time they reach 439
sexual maturity, as in chimpanzees or gorillas (Clutton-Brock & Lukas, 2012). In contrast, male 440
grey mouse lemurs cannot monopolize females and sperm competition prevails over contest 441
competition (Eberle & Kappeler, 2004a, Eberle & Kappeler, 2004b, Huchard et al., 2012). In 442
addition, our results indicate that young females have access to a large pool of unrelated 443
candidate mates on top of their relative(s), explaining why the intensity of selective pressures 444
favouring female dispersal may remain moderate. 445
20
Individuals that face residual inbreeding risk despite natal male-biased dispersal may 446
have developed additional inbreeding avoidance strategies, like secondary dispersal or 447
avoidance of mating with kin. Secondary dispersal may occasionally occur when male grey 448
mouse lemurs have many closely related females in their vicinity (Radespiel et al., 2003), 449
though it appears rare as no incidents have ever been recorded in this 10-year study 450
population (unpublished observation). Mating biases appear more common, and are 451
detectable in young females and adult males, who select mates with a narrower relatedness 452
range than random partners. Adult females and males also show a marginally non-significant 453
trend for mating with partners who are less related than random partners. Regarding the 454
coefficient of variation of mate relatedness, significant results in young females and adult 455
males may reflect the fact that these two age-sex categories face, respectively, a higher 456
prevalence and intensity of inbreeding risk than other age-sex categories, and greater 457
variation in the relatedness coefficients of candidate mates may confer more power to the 458
analyses. However, it is important to realize that our analyses cannot identify the choosing 459
sex: if one sex chooses partners with a low relatedness, or with a narrower range of 460
relatedness, this preference will influence the results of the randomization analyses for both 461
sexes. As a result, these mating biases may reflect the avoidance of daughter-father matings, 462
the kin relationship that is most represented in individual mating pools, due to active 463
discrimination by either young females or adult males. In addition, failure to detect significant 464
mating biases for partners with low relatedness may also reflect methodological issues, and 465
specifically the fact that mating patterns are inferred from patterns of parentage. It is possible 466
that inbreeding depression may be more severe on early life traits (Stockley et al., 1993, 467
Markert et al., 2004, Cohas et al., 2009, Nielsen et al., 2012) and compromise the survival of 468
21
inbred juveniles, resulting in their non-detectability by our sampling design, which only traps 469
and marks recruited individuals. 470
Mate choice for partners with intermediate relatedness suggests that young females 471
and adult males may optimize, rather than maximize genetic dissimilarity to their partners by 472
avoiding partners that are too closely or too distantly related. Such result may reflect the 473
spatial genetic structure of the population if young females and adult males (1) tend to avoid 474
mating with closely related partners, and (2) have lower chances to mate with distantly related 475
partners (compared to partners with intermediate relatedness) because mating probability 476
and relatedness between candidate mates both decrease as spatial distance between them 477
increases, under a scenario of isolation by distance. In the first case, variance may be more 478
sensitive than mean to a scenario of avoidance of mating with close kin. Under such scenario, 479
mate choice will only erase the most extreme points of the distribution of relatedness among 480
actual partners compared to random partners, which may impact the variance of this 481
distribution more than its mean. Consequently, future studies should integrate variance-482
based analyses in their design more systematically. In the second case, although assignment 483
of candidate mates partially took into account their spatial proximity by including only 484
individuals that were less distant than the maximal distance recorded between actual parents 485
in our dataset, our analyses did not control for the residual effect of variable spatial distance 486
within this range. Alternatively, mates with intermediate relatedness may balance the costs 487
of inbreeding and the benefits of increasing the representation of genes identical by descent 488
in future generations (Parker, 1979, Puurtinen, 2011, Szulkin et al., 2013). Theory predicts that 489
levels of inbreeding that maximize inclusive fitness are low and compatible with a wide range 490
of realistic inbreeding depression strengths, as well as with mate choice for intermediately 491
related individuals (Puurtinen, 2011), as observed in a number of vertebrates (Pusey & Wolf, 492
22
1996, Reusch et al., 2001, Mays et al., 2008, Szulkin et al., 2013). Mating strategies observed 493
in our population are therefore in agreement with theoretical expectations in large outbred 494
populations. Although preferences for intermediate relatedness have not been previously 495
reported in wild primates, they may be under-detected as studies often test for differences in 496
mean relatedness between actual and random mates, without testing for differences in 497
relatedness variance (Szulkin et al., 2013). 498
Selecting mates based on their relatedness coefficients requires efficient kin 499
discrimination mechanisms. While familiarity may mediate kin recognition among maternal 500
kin, it is less clear how fathers can avoid mating with their daughters in species where both 501
sexes mate with multiple partners and where paternity certainty is therefore low (Widdig, 502
2007) as in grey mouse lemurs (Eberle & Kappeler, 2004b, Eberle & Kappeler, 2004a). Previous 503
work in this population shows that individuals choose MHC-dissimilar partners (Schwensow 504
et al., 2008, Huchard et al., 2013) and suggests that kin discrimination may rely on odour cues 505
influenced by MHC genes in this nocturnal species characterized by an acute sense of smell 506
(Schilling, 1979, Schilling & Perret, 1987). Additionally, a recent experiment shows that 507
females can detect relatedness in vocalizations of unfamiliar individuals, suggesting that 508
acoustic cues may also play an important role in kin discrimination (Kessler et al., 2012). 509
Beside active mate discrimination, mate selection may also occur post-copulation via 510
cryptic female choice. Whereas males show an impressive enlargement of testes size and 511
roam extensively in search of mating opportunities during the breeding season (Eberle & 512
Kappeler, 2002, Eberle et al., 2007), females actively seek multiple mates during their short 513
period of sexual receptivity, suggesting that they benefit from such a strategy (Eberle & 514
Kappeler, 2004a, Huchard et al., 2012). Experimental studies in both invertebrates and 515
vertebrates, including mammals, have shown that mating with multiple males may represent 516
23
an efficient strategy to avoid inbreeding (Tregenza & Wedell, 2002, Simmons et al., 2006, Zeh 517
& Zeh, 2006, Firman & Simmons, 2008), thereby offering a potential mechanism for the mating 518
biases reported in grey mouse lemurs. 519
No mating biases, or even trends, were detected in young males. Several possibilities 520
may explain this age effect. Young males have just left their natal area (Schliehe-Diecks et al., 521
2012) and as a result appear to have no close relatives in their mating pool. The variance of 522
relatedness to their potential mates may consequently be too weak to detect a signal of 523
inbreeding avoidance or they may not need to be discriminative. Moreover, young males 524
struggle to access mates when competing with older and heavier males (Eberle & Kappeler, 525
2004b) and the costs of inbreeding avoidance may exceed the costs of inbreeding for them. 526
Overall, these results indicate that several inbreeding strategies co-occur within a single 527
population and may reflect individual variation in the relative benefits and costs of inbreeding 528
and inbreeding avoidance (Szulkin et al., 2013). 529
Finally, we could not detect a positive effect of heterozygosity on mating success and 530
on survival probability, despite a reasonable individual variance in heterozygosity and, in the 531
case of survival analyses, irrespective of whether we considered state-dependant (age) or 532
environmental influences (season) which are supposed to alter the magnitude of genome-533
wide heterozygosity effects on fitness (Balloux et al., 2004, Brouwer et al., 2007, Kempenaers, 534
2007, Cohas et al., 2009). This lack of effect may first reflect methodological caveats, such as 535
the use of indices of heterozygosity based on a limited number of microsatellites which may 536
poorly reflect overall genome-wide diversity (Chapman et al., 2009, Szulkin et al., 2010, but 537
see Forstmeier et al., 2012). However, the incomplete nature of our pedigree precluded the 538
use of pedigree-based measures. Second, inbreeding depression may be particularly acute in 539
early life (Stockley et al., 1993, Markert et al., 2004, Cohas et al., 2009, Nielsen et al., 2012) 540
24
and it is possible that inbred individuals may often die before being captured and marked, or 541
that inbreeding depression may only be detectable on developmental traits which were not 542
examined here. Finally, even if the genetic load responsible for inbreeding depression may be 543
substantial in the population, our results may simply reflect the scarcity of inbred individuals 544
in the population. The high genetic diversity of our study population indicates that it is of 545
sufficient size and density to ensure healthy pools of largely unrelated candidate mates and 546
fully operational inbreeding avoidance strategies. We also did not find any support for an 547
optimal heterozygosity level balancing potential costs of inbreeding and outbreeding 548
depression, but recent models suggest that levels of inbreeding selected under this scenario 549
are low (Puurtinen, 2011), which may explain why they were undetectable. 550
551
6. CONCLUSION 552
We simultaneously investigated the occurrence and intensity of inbreeding risk (via 553
parentage and pedigree analyses), of inbreeding avoidance (via mating biases), and of 554
inbreeding depression (via the survival costs of heterozygosity) in a large natural population 555
of grey mouse lemurs. Grey mouse lemurs have retained a number of ancestral mammalian 556
traits including a solitary lifestyle, a promiscuous mating system and male-biased dispersal 557
(Lukas & Clutton-Brock, 2011, Lukas & Clutton-Brock, 2013) and may therefore offer a classic 558
example of the inbreeding strategy prevailing in large populations of solitary mammals. 559
Inbreeding risk was low, and its variation across ages and sexes suggests that male-biased 560
dispersal is a primary inbreeding avoidance mechanism at the population level. Mating biases 561
favouring partners with intermediate relatedness were detectable in yearling females and in 562
adult males, the two age-classes that face the highest prevalence and intensity of inbreeding 563
risk, respectively, suggesting that mate choice may represent a facultative secondary strategy 564
25
of inbreeding avoidance that mitigates residual inbreeding risk at the individual level. The 565
effect of genome-wide heterozygosity on survival was undetectable using a ten-generation 566
survival analysis, suggesting that inbreeding avoidance strategies were efficient in this large, 567
open and genetically-diverse population. 568 569 570 ACKNOWLEDGEMENTS 571
We acknowledge the authorization of this study by the Commission Tripartite and the CAFF of 572
the Direction des Eaux et Forêts, the C.N.F.E.R.E.F. All research reported here is in compliance 573
with animal care regulations and applicable national laws of Germany and Madagascar. The 574
appropriate Animal Use and Care committees of Germany (Bundesministerium für 575
Naturschutz, BfN) and Madagascar (Ministère de l’Environnement et des Eaux et Forêts, 576
MINEEF) approved all research protocols. The CRCESP, DPZ and DFG provided financial 577
support. We thank Dr. Rodin Rasoloarison, Léonard Razafimanantsoa, Tiana Andrianjanahary, 578
Bruno Tsiveramana, Remy de Ampataka and the Equipe Kirindy for support and assistance in 579 the field. 580 581 REFERENCES 582
Acevedo-Whitehouse, K., Gulland, F., Greig, D. & Amos, W. 2003. Inbreeding: disease 583
susceptibility in California sea lions. Nature 422: 35-35. 584
Amos, W., Worthington Wilmer, J., Fullard, K., Burg, T. M., Croxall, J. P., Bloch, D. & Coulson, 585
T. 2001. The influence of parental relatedness on reproductive success. Proc. Roy. Soc. 586
B 268: 2021-2027.
587
Aparicio, J. M., Ortego, J. & Cordero, P. J. 2006. What should we weigh to estimate 588
heterozygosity, alleles or loci? Mol. Ecol. 15: 4659-4665. 589
Balloux, F., Amos, W. & Coulson, T. 2004. Does heterozygosity estimate inbreeding in real 590
populations? Mol. Ecol. 13: 3021-3031. 591
26
Barton, K. (2015) Multi-Model Inference. R Package v1.9.13. 592
Bateson, P. 1978. Sexual imprinting and optimal outbreeding. Nature 273: 659-660. 593
Brouwer, L., Komdeur, J. & Richardson, D. S. 2007. Heterozygosity–fitness correlations in a 594
bottlenecked island species: a case study on the Seychelles warbler. Mol. Ecol. 16: 595
3134-3144. 596
Burnham, K. P. & Anderson, D. R. 2002. Model selection and multimodel inference: a practical 597
information-theoretic approach. Springer-Verlag, New York.
598
Caro, T. M. & Laurenson, M. K. 1994. Ecological and genetic factors in conservation: a 599
cautionary tale. Science 263: 485-6. 600
Chapman, J. R., Nakagawa, S., Coltman, D. W., Slate, J. & Sheldon, B. C. 2009. A quantitative 601
review of heterozygosity-fitness correlations in animal populations. Mol. Ecol. 18: 602
2746-65. 603
Charlesworth, D. & Charlesworth, B. 1987. Inbreeding depression and its evolutionary 604
consequences. Annu. Rev. Ecol. Syst. 18: 237-268. 605
Charlesworth, D. & Willis, J. H. 2009. The genetics of inbreeding depression. Nature Rev. 606
Genet. 10: 783-796.
607
Charpentier, M., Setchell, J. M., Prugnolle, F., Wickings, E. J., Peignot, P., Balloux, F. & Hossaert-608
Mckey, M. 2006. Life history correlates of inbreeding depression in mandrills 609
(Mandrillus sphinx). Mol. Ecol. 15: 21-28. 610
Clutton-Brock, T. H. 1989. Female transfer and inbreeding avoidance in social mammals. 611
Nature 337: 70-72.
612
Clutton-Brock, T. H. & Lukas, D. 2012. The evolution of social philopatry and dispersal in female 613
mammals. Mol. Ecol. 21: 472-492. 614
Cohas, A., Bonenfant, C., Kempenaers, B. & AllainÉ, D. 2009. Age-specific effect of 615
heterozygosity on survival in alpine marmots, Marmota marmota. Mol. Ecol. 18: 1491-616
1503. 617
Coltman, D. W., Bowen, W. D. & Wright, J. M. 1998. Birth weight and neonatal survival of 618
harbour seal pups are positively correlated with genetic variation measured by 619
microsatellites. Proc. Roy. Soc. B 265: 803-809. 620
Coltman, D. W., Pilkington, J. G., Smith, J. A. & Pemberton, J. M. 1999. Parasite-mediated 621
selection against inbred Soay sheep in a free-living, island population. Evolution 53: 622
1259-1267. 623
Cormack, R. M. 1964. Estimates of survival from the sighting of marked animals. Biometrika 624
51: 429-438.
625
Coulson, T. N., Pemberton, J. M., Albon, S. D., Beaumont, M., Marshall, T. C., J, S., Guinness, F. 626
E. & Clutton-Brock, T. H. 1998. Microsatellites reveal heterosis in red deer. Proc. Roy. 627
Soc. B 265: 489-495.
628
Diehl, W. J. & Koehn, R. K. 1985. Multiple-locus heterozygosity, mortality, and growth in a 629
cohort of Mytilus edulis. Marine Biol. 88: 265-271. 630
Eberle, M. & Kappeler, P. M. 2002. Mouse lemurs in space and time: a test of the 631
socioecological model. Behav. Ecol. Sociobiol. 51: 131-139. 632
Eberle, M. & Kappeler, P. M. 2004a. Selected polyandry: female choice and intersexual conflict 633
in a small nocturnal solitary primate (Microcebus murinus). Behav. Ecol. Sociobiol. 57: 634
91-100. 635
Eberle, M. & Kappeler, P. M. 2004b. Sex in the dark: determinants and consequences of mixed 636
male mating tactics in Microcebus murinus, a small solitary nocturnal primate. Behav. 637
Ecol. Sociobiol. 57: 77-90.
27
Eberle, M. & Kappeler, P. M. 2006. Family insurance: kin selection and cooperative breeding 639
in a solitary primate (Microcebus murinus). Behav. Ecol. Sociobiol. 60: 582-588. 640
Eberle, M., Perret, M. & Kappeler, P. M. 2007. Sperm competition and optimal timing of 641
matings in Microcebus murinus. Int. J. Primatol. 28: 1267–1278. 642
Firman, R. C. & Simmons, L. W. 2008. Polyandry facilitates postcopulatory inbreeding 643
avoidance in house mice. Evolution 62: 603-611. 644
Foerster, K., Valcu, M., Johnsen, A. & Kempenaers, B. 2006. A spatial genetic structure and 645
effects of relatedness on mate choice in a wild bird population. Mol. Ecol. 15: 4555-646
4567. 647
Foerstmeier, W., Schielzeth, H., Mueller, J. C., Ellegren, H., Kempanaers, B. 2012. 648
Heterozygosity-fitness correlations in zebra finches: microsatellite markers can be 649
better than their reputation. Mol. Ecol. 21: 3237-3249. 650
Fredsted, T., Pertoldi, C., Olesen, J. M., Eberle, M. E. & Kappeler, P. M. 2004. Microgeographic 651
heterogeneity in spatial distribution and mtDNA variability of gray mouse lemurs 652
(Microcebus murinus, Primates: Cheirogaleidae). Behav. Ecol. Sociobiol. 56: 393-403. 653
Fredsted, T., Pertoldi, C., Schierup, H. & Kappeler, P. M. 2005. Microsatellite analyses reveal 654
fine-scale genetic structure in gray mouse lemurs (Microcebus murinus). Mol. Ecol. 14: 655
2363-2372. 656
Fromhage, L., Kokko, H., Reid, J. M. 2009. Evolution of mate choice for genome-wide 657
heterozygosity. Evolution 63, 684-694. 658
Gibbons, J. D. & Pratt, J. W. 1975. P-values: interpretation and methodology. The American 659
Statistician, 20: 20–25.
660
Gomez, D., Huchard, E., Henry, P.-Y. & Perret, M. 2012. Mutual mate choice in a female-661
dominant and sexually dimorphic primate. Am. J Phys. Anthropol. 147: 370-9. 662
Greenwood, P. J. 1980. Mating systems, philopatry and dispersal in birds and mammals. Anim. 663
Behav. 28: 1140-1162.
664
Grueber, C., Laws, R., Nakagawa, S. & Jamieson, I. 2010. Inbreeding Depression Accumulation 665
across Life-History Stages of the Endangered Takahe. Conserv. Biol. 24: 1617-1625. 666
Hapke, A., Eberle, M. & Zischler, H. 2003. Isolation of new microsatellite markers and 667
application in four species of mouse lemurs (Microcebus sp.). Mol. Ecol. 3: 205-208. 668
Hedrick, P. W. 2000. Inbreeding depression in conservation biology. Annu. Rev. Ecol. Syst. 31: 669
139-162. 670
Huchard, E., Baniel, A., Schliehe-Diecks, S. & Kappeler, P. M. 2013. MHC-disassortative mate 671
choice and inbreeding avoidance in a solitary primate. Mol. Ecol. 22: 4071-4086. 672
Huchard, E., Canale, C. I., Le Gros, C., Perret, M., Henry, P.-Y. & Kappeler, P. M. 2012. 673
Convenience polyandry or convenience polygyny? Costly sex under female control in 674
a promiscuous primate. Proc. Roy. Soc. B 279: 1371-1379. 675
Huchard, E., Knapp, L. A., Wang, J., Raymond, M. & Cowlishaw, G. U. Y. 2010. MHC, mate 676
choice and heterozygote advantage in a wild social primate. Mol. Ecol. 19: 2545-2561. 677
Jolly, G. M. 1965. Explicit estimates from capture-recapture data with both death and 678
immigration-stochastic model. Biometrika 52: 225-247. 679
Jones, O. R. & Wang, J. 2010. COLONY: a program for parentage and sibship inference from 680
multilocus genotype data. Mol. Ecol. Resour.: 551-555. 681
Kalinowski, S. T., Taper, M. L. & Marshall, T. C. 2007. Revising how the computer program 682
CERVUS accommodates genotyping error increases success in paternity assignment. 683
Mol. Ecol. 16: 1099-1106.
28
Kappeler, P. M. & Fichtel, C. (2012) A 15-year perspective on the social organization and life 685
history of sifaka in Kirindy Forest. In: Long-term field studies of primates, (Kappeler, P. 686
M. & Watts, D. P., eds.). pp. 101-121. Springer, Heidelberg. 687
Kappeler, P. M. & Rasoloarison, R. M. (2003) Microcebus, mouse lemurs, tsidy. In: The Natural 688
History of Madagascar, (Goodman, S. M. & Benstead, J. P., eds.). pp. 1310-1315. The
689
University of Chicago Press, Chicago. 690
Keller, L. F. 1998. Inbreeding and its fitness effects in an insular population of song sparrows 691
(Melospiza melodia). Evolution 52: 240-250. 692
Keller, L. F. & Waller, D. M. 2002. Inbreeding effects in wild populations. Trends Ecol. Evol. 17: 693
230-241. 694
Kempenaers, B. (2007) Mate choice and genetic quality: a review of the heterozygosity theory. 695
In: Adv. Stud. Behav., Vol. 37. pp. 189-278. Academic Press, San Diego. 696
Kempenaers, B., Frank, A., Van Noordwijk, A. J. & Dhondt, A. A. 1996. Inbreeding and hatching 697
failure in blue tits: are unhatched eggs infertile? Proc. Roy. Soc. B 263: 179-185. 698
Kessler, S. E., Scheumann, M., Nash, L. T. & Zimmermann, E. 2012. Paternal kin recognition in 699
the high frequency/ultrasonic range in a solitary foraging mammal. BMC Ecol. 12: 26. 700
Kokko, H. & Ots, I. 2006. When not to avoid inbreeding. Evolution 60: 467-475. 701
Kulinskaya, E. 2008. On two-sided p-values for non-symmetric distributions, arXiv: 0810.2124 702
[math.ST]. 703
Kraus, C., Eberle, M. & Kappeler, P. M. 2008. The costs of risky male behavior: sex differences 704
in seasonal survival in a small sexually monomorphic primate. Proc. Roy. Soc. B 275: 705
1635-1644. 706
Lande, R. 1988. Genetics and demography in biological conservation. Science 241: 1455-1460 707
Lebreton, J., Burnham, K., Clobert, J. & Anderson, D. 1992. Modeling survival and testing 708
biological hypotheses using marked animals: a unified approach with case studies. 709
Ecol. Monogr. 62: 67-118.
710
Lukas, D. & Clutton-Brock, T. H. 2011. Group structure, kinship, inbreeding risk and habitual 711
female dispersal in plural-breeding mammals. J. Evol. Biol. 24: 2624-2630. 712
Lukas, D. & Clutton-Brock, T. H. 2013. The evolution of social monogamy in mammals. Science 713
341: 526-530.
714
Markert, J. A., Grant, P. R., Grant, B. R., Keller, L. F., Coombs, J. L. & Petren, K. 2004. Neutral 715
locus heterozygosity, inbreeding, and survival in Darwin's ground finches (Geospiza 716
fortis and G. scandens). Heredity 92: 306-315.
717
Mays, H. L., Albrecht, T., Liu, M. & Hill, G. E. 2008. Female choice for genetic complementarity 718
in birds: a review. Genetica 134: 147-158. 719
Muniz, L., Perry, S., Manson, J. H., Gilkenson, H., Gros-Louis, J. & Vigilant, L. 2006. Father-720
daughter inbreeding avoidance in a wild primate population. Curr. Biol. 16: R156-R157. 721
Nielsen, J. F., English, S., Goodall-Copestake, W. P., Wang, J., Walling, C. A., Bateman, A. W., 722
Flower, T. P., Sutcliffe, R. L., Samson, J., Thavarajah, N. K., Kruuk, L. E. B., Clutton-Brock, 723
T. H. & Pemberton, J. M. 2012. Inbreeding and inbreeding depression of early life traits 724
in a cooperative mammal. Mol. Ecol. 21: 2788-2804. 725
Parker, G. A. (1979) Sexual selection and sexual conflict. In: Sexual selection and reproductive 726
competition in insects, (Blum, M. S. & Blum, N. A., eds.). pp. Academic Press, New York.
727
Pusey, A. & Wolf, M. 1996. Inbreeding avoidance in animals. Trends Ecol. Evol. 11: 201-206. 728
Pusey, A. E. 1987. Sex-biased dispersal and inbreeding avoidance in birds and mammals. 729
Trends Ecol. Evol. 2: 295-299.
730
Puurtinen, M. 2011. Mate choice for optimal (k)inbreeding. Evolution 65: 1501-1505. 731
29
Radespiel, U., Lutermann, H., Schmelting, B., Bruford, M. W. & Zimmermann, E. 2003. Patterns 732
and dynamics of sex-biased dispersal in a nocturnal primate, the grey mouse lemur, 733
Microcebus murinus. Anim. Behav. 65: 707-719.
734
Radespiel, U., Zübeyde, S., Zimmermann, E. & Bruford, M. W. 2001. Sociogenetic structure in 735
a free-living nocturnal primate population: sex-specific differences in the grey mouse 736
lemur (Microcebus murinus). Behav. Ecol. Sociobiol. 50: 493-502. 737
Ralls, K., Ballou, J. D. & Templeton, A. 2005. Estimates of lethal equivalents and the cost of 738
inbreeding in mammals. Conserv. Biol. 2: 185-193. 739
Reusch, T. B. H., Haberli, M. A., Aeschlimann, P. B. & Milinski, M. 2001. Female sticklebacks 740
count alleles in a strategy of sexual selection explaining MHC polymorphism. Nature 741
414: 300-302.
742
Saccheri, I., Kuussaari, M., Kankare, M., Vikman, P., Fortelius, W. & Hanski, I. A. 1998. 743
Inbreeding and extinction in a butterfly metapopulation. Nature 392: 491-494. 744
Schilling, A. 1979. Olfactory communication in Prosimians. Academic Press, London. 745
Schilling, A. & Perret, M. 1987. Chemical signals and reproductive capacity in a male prosimian 746
primate, Microcebus murinus. Chem. senses 12: 143-158. 747
Schliehe-Diecks, S., Eberle, M. & Kappeler, P. M. 2012. Walk the line - natal dispersal 748
movements in gray mouse lemurs. Behav. Ecol. Sociobiol. 66: 1175-1185. 749
Schwensow, N., Eberle, M. & Sommer, S. 2008. Compatibility counts: MHC-associated mate 750
choice in a wild promiscuous primate. Proc. Roy. Soc. B 275: 555-564. 751
Seber, G. A. F. 1965. A note on the multiple-recapture census. Biometrika 52: 249-259. 752
Simmons, L. W., Beveridge, M., Wedell, N. & Tregenza, T. 2006. Postcopulatory inbreeding 753
avoidance by female crickets only revealed by molecular markers. Mol. Ecol. 15: 3817-754
3824. 755
Stockley, P., Searle, J. B., Macdonald, D. W. & Jones, C. S. 1993. Female multiple mating 756
behaviour in the common shrew as a strategy to reduce inbreeding. Proc. Roy. Soc. B 757
254: 173-179.
758
Szulkin, M., Bierne, N. & David, P. 2010. Heterozygosity-fitness correlations: a time for 759
reappraisal. Evolution 64: 1202-1217. 760
Szulkin, M., Stopher, K. V., Pemberton, J. & Reid, J. M. 2013. Inbreeding avoidance, tolerance 761
or preference in animals. Trends Ecol. Evol. 28: 205-211. 762
Tregenza, T. & Wedell, N. 2000. Genetic compatibility, mate choice and patterns of parentage: 763
invited review. Mol. Ecol. 9: 1013-1027. 764
Tregenza, T. & Wedell, N. 2002. Polyandrous females avoid costs of inbreeding. Nature 415: 765
71-73. 766
Walling, C. A., Nussey, D. H., Morris, A., Clutton-Brock, T. H., Kruuk, L. E. B. & Pemberton, J. M. 767
2011. Inbreeding depression in red deer calves. BMC Evol. Biol. 11: 318. 768
Wang, J. 2007. Triadic IBD coefficients and applications to estimating pairwise relatedness. 769
Genet. Res. 89: 135-153.
770
Wang, J. 2011. Coancestry: a program for simulating, estimating and analysing relatedness 771
and inbreeding coefficients. Mol. Ecol. Res. 11: 141-145. 772
Waser, P. M., Austad, S. N. & Keane, B. 1986. When should animals tolerate inbreeding? Am. 773
Nat. 128: 529-537.
774
White, G. C. & Burnham, K. P. 1999. Program MARK: survival estimation from populations of 775
marked animals. Bird Study 46: 120-139. 776
Widdig, A. 2007. Paternal kin discrimination: the evidence and likely mechanisms. Biol. Rev. 777
82: 319-334.