HAL Id: hal-01092987
https://hal.archives-ouvertes.fr/hal-01092987
Submitted on 9 Dec 2014
HAL is a multi-disciplinary open access
archive for the deposit and dissemination of
sci-entific research documents, whether they are
pub-lished or not. The documents may come from
teaching and research institutions in France or
abroad, or from public or private research centers.
L’archive ouverte pluridisciplinaire HAL, est
destinée au dépôt et à la diffusion de documents
scientifiques de niveau recherche, publiés ou non,
émanant des établissements d’enseignement et de
recherche français ou étrangers, des laboratoires
publics ou privés.
analysis of human walking
Ting Wang, Claire Dune, Jean-Pierre Merlet, Philippe Gorce, Guillaume
Sacco, Philippe Robert, Jean-Michel Turpin, Bernard Teboul, Audrey Marteu,
Olivier Guerin
To cite this version:
Ting Wang, Claire Dune, Jean-Pierre Merlet, Philippe Gorce, Guillaume Sacco, et al.. A new
applica-tion of smart walker for quantitative analysis of human walking. The Second Workshop on Assistive
Computer Vision and Robotics (ACVR’14), Sep 2014, zuric, Switzerland. �hal-01092987�
quantitative analysis of human walking
Ting Wang1, Claire Dune1,2, Jean-Pierre Merlet1, Philippe Gorce2,
Guillaume Sacco3, Philippe Robert3, Jean-Michel Turpin3, Bernard Teboul3,
Audrey Marteu3, and Olivier Guerin3 1
Hephaistos, INRIA Sophia Antipolis, 06902 Valbonne, France {ting.wang,Jean-Pierre.Merlet}@inria.fr
2
HandiBio EA 4322, Universit´e de Toulon, 83957 La Garde, France {claire.dune,philippe.gorce}@univ-tln.fr,
3
CHU de Nice, 06000 Nice, France bernard.teboul@libertysurf.fr,
{sacco.g,robert.ph,turpin.jm,marteu.a,guerin.o}@chu-nice.fr
Abstract. This paper presents a new nonintrusive device for everyday gait analysis and health monitoring. The system is a standard rollator equipped with encoders and inertial sensors. The assisted walking of 25 healthy elderly and 23 young adults are compared to develop walking quality index. The subjects were asked to walk on a straight trajectory and an L-shaped trajectory respectively. The walking trajectory, which is missing in other gait analysis methods, is calculated based on the encoder data. The obtained trajectory and steps are compared with the results of a motion capture system. The gait analysis results show that new index obtained by using the walker measurements, and not available otherwise, are very discriminating, e.g., the elderly have larger lateral motion and maneuver area, smaller angular velocity during turning, their walking accuracy is lower and turning ability is weaker although they have almost the same walking velocity as the young people.
Keywords: Smart walker, gait analysis, step detection, turning, elderly
1
Introduction
Ageing in society is a worldwide issue that especially impacts developed coun-tries. In France, due to the high care cost and the limited number of rooms in care institution, the solution that has been chosen by care givers, frail people and their family is to maintain elderly at home and in the best conditions by giving them an adapted assistance. Among the possible assistance devices, the walkers have large number of users because of their simplicity while using the person’s remaining locomotion capability.
Advances in robotics make it possible to develop more intelligent walkers by adding sensors and actuators. According to the user’s needs, the functions of the proposed walkers are not restricted to their primary tasks, i.e. physical support
and mobility assistance [1], [2], [3]. There are other functions such as sensorial assistance, cognitive assistance and health monitoring [4], [5]. Some walkers also focus on sit-to-stand transfer [6], [7], navigation help [8], [9], obstacle avoidance and fall detection [10].
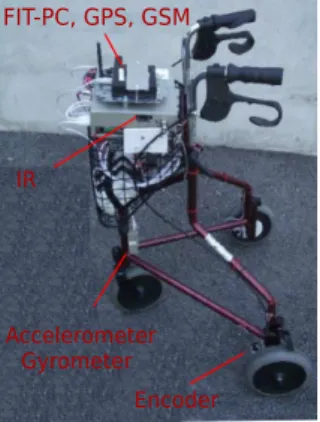
To study the extension of the functions of walkers we have developed our own family of walking aids based on the walker presented in [11]. Our walk-ers can perform multi-functions such as navigation, street mapping, fall de-tection/prevention and autonomous object recovery. In this work we use the simplest version (Fig. 1), which is based on a commercially available 3-wheels Rollator. It was instrumented with encoders at the two fixed rear wheels and a 3D accelerometer/gyrometer at the front with the purpose of determining the walker’s trajectory on a 24/24 basis. A small, low energy consumption fit-pc computer manages the measurements and records all the data. Compared with the walkers proposed above, our walker is low cost, simple to be used at home and its functions can be easily extended. This paper will present how it can be used for medical monitoring of walking patterns.
Many studies have examined the effect of age on the walking by comparing younger with older adults [12], [13], [14], [15], [16], [17], [18], [19]. These stud-ies calculated some gait parameters, such as step length, gait cycle, step width, cadence and gait speed [19], [20], [21], [22]. Some studies have considered also gait variability [15], [23], [16], [24]. However, these usual gait parameters are not sufficient and sensitive enough to evaluate the health state of elderly people, and the results of previous studies are often inconsistent according to the con-ditions of experiment. Another drawback of most studies is that these measures are obtained on a reduced space with specialized laboratory equipment such as motion capture systems and instrumented walkways, which may not be available in many clinics and certainly not during daily activities. Thus the recent studies used the wearable inertial sensors to analyze the fall risk of elderly people [25], [26], [27]. Thanks to encoders and a 3D accelerometer/gyrometer, by using the smart walker we can not only calculate accurately all the classical gait parame-ters proposed above, but also avoid imposing constraints on the end-users. We also can obtain the trajectory of the walker and therefore compare it with the reference trajectory. This comparison will allow to establish several original gait parameters which have not been considered in previous studies. Overall, using our walker the gait characteristics can be described more comprehensively.
2
Methods
This section will explain how the walker can obtain the walking trajectory and determine the stride while the subject is walking along a straight line. In addi-tion, in order to validate our method, the obtained gait features will be compared with the data given by a 6-camera motion capture system which is used for bio-mechanical analysis [28].
FIT-PC, GPS, GSM
IR
Accelerometer Gyrometer
Encoder
Fig. 1.The instrumented walking aid.
X
Y
d θ θ dL dR D/2 D/2 Y X1 1o
O
1Fig. 2.Simple kinematic model of the walker.
2.1 Calculation of the trajectory
As shown in Fig. 2, the origin of the walker frame O1X1Y1is supposed to be the
position of the middle point between the two rear wheels. The position of the walker in a reference frame OXY is described by [x, y, θ], where θ describes the walking direction of the rollator and represents the angle between the horizontal axis of two rear wheels and the X axis. In our experiment of 10m straight line walk test, as the reference trajectory was directed along the Y axis we have θ = 0 at the beginning of the walker’s trajectory. The trajectory of the walker is determined by using the encoders. Assuming that at the (k + 1)th time sample
moment the measurement of the encoders of two rear wheels are ∆L and ∆R,
the displacement of the left and right wheel are obtained by using (1): dL = 2πr
4C · 360∆L, dR = 2πr
4C · 360∆R (1) where r is the radius of the rear wheel and C is a constant parameter of the transformation between the value of encoder and the wheel radius. The change of the direction angle θ during the (k + 1)th sampling time can be estimated as:
dθ = (dL − dR)/D, (2)
where D is the distance between the two rear wheels.
According to the kinematic model shown in Fig. 2, the changes of the walker’s position can be obtained as follows [29]:
dx = dL + dR 2 sin(θk+ dθ 2 ), dy = dL + dR 2 cos(θk+ dθ 2 ) (3) Finally, the new position of the walker can be calculated by using:
xk+1= xk+ dx, yk+1= yk+ dy, θk+1= θk+ dθ. (4)
Using the above equations, the trajectory of the walker can be determined by using the encoders. The experiments have shown that after a straight line walking of 10 meters the estimated positioning has an absolute accuracy better than 1cm.
2.2 Step detection
Accelerometers are utilized to detect the walking stride in many studies [30], [31]. Most of methods use the peak value of forward acceleration to detect the walking cycle. However, some steps do not lead to a high-peak forward acceleration, and hence they are not counted although there is displacement during these periods. A recent study [32] used thresholds on the magnitude of the gyroscope and accelerometer signals to identify the zero velocity instant and regarded it as the end of a step. Our walker also uses the gyrometer data to detect the walking stride. An interesting contribution is that it allows one to differentiate the right and left steps when the subject walks along a straight line. Indeed when the subject is on the left (right) support phase the walking aid rotates on the left (right). Hence the rotational velocity of the walker around the vertical axis, which can be easily obtained by the gyrometer, is used to detect the walking stride. Its zero value instant is regarded as the end of a step.
An example of measured rotational velocity after a low pass filtering for an elderly people during walking along a 10m straight line is shown in Fig. 3. Since
time (s) 10 5 0 -5 -10 2 4 6 8 (°/s)
Fig. 3.Yaw angular velocity of the walker when the subject walks along a straight ref-erence trajectory with 10m. One step is fin-ished when it passes zero.
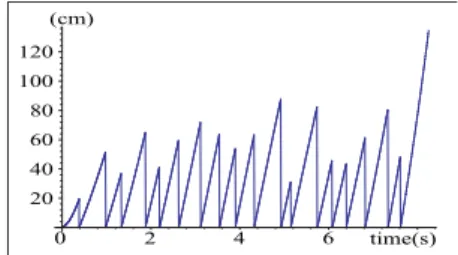
(cm) 120 100 80 60 20 40 0 2 4 6 time(s)
Fig. 4.Displacement of the walker during every step. The results of left steps and right steps were put together and they ap-peared alternately.
the position of the walker at every moment has been calculated by using the method presented in Section 2.1, the displacement of the walker during every step, which is regarded as the step length of the subject, can be easily calculated as soon as all the steps are detected, as shown in Fig. 4. Accordingly, all gait speed characteristics (such as mean value, minimum and maximum value) can be obtained for each step. With a sampling time of 1ms for the encoders and 4.8ms for the gyrometer, we may obtain a quiet reasonable accuracy on these parameters.
2.3 Validation
The proposed methods are tested on a standard 4-wheels rollator equipped with sensors and monitored by a motion capture system, as shown in Fig. 5. We
attached 10 optical markers on the walker frame, wheel axis and handle. The motion capture gives the 3D trajectory of the markers at a framerate of 200Hz.
RGBD sensor
Inertial sensor
Encoder
Fig. 5.Walker and motion capture optical markers set-up [33]
The motion capture system is a high cost, whole body motion analysis system widely used for bio-mechanical analysis. Its accuracy is studied in [28] among other commercially available systems for the measurement of human motion. The constructors give an accuracy of 0.6cm in a 3-m field of view. In [28], the accuracy is evaluated by measuring the relative distance between two markers set on a rigid target of known size (9cm) that rotates around a vertical axis. The markers are seen by at most 3 cameras at each time frame. The results show a maximum distance error of 1.2cm. Yet, no result is given on the absolute distance error.
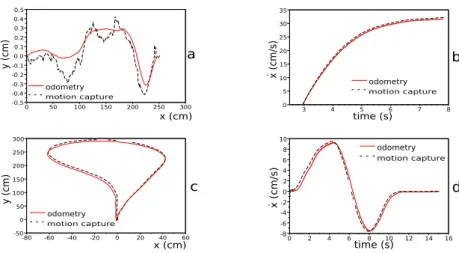
Validation of trajectory calculation Fig. 6 a. and Fig. 6 c. compare two walker trajectories (straight line and U-turn) that are estimated using the en-coder values with the trajectories obtained using the motion capture system. The instantaneous velocity can also be estimated by mapping the time frames to these measurements (Fig. 6 b. and Fig. 6 d.).
The straight line experiment shows that the distance estimation given by the odometers and the motion capture system are similar. The encoders are able to capture small deviations from the straight line. The U-turn experiment also shows that the trajectory of the walker is well described, even when perform-ing maneuver. Then, the encoders’ values can be used to describe the walker trajectory and they give similar results as the motion capture system.
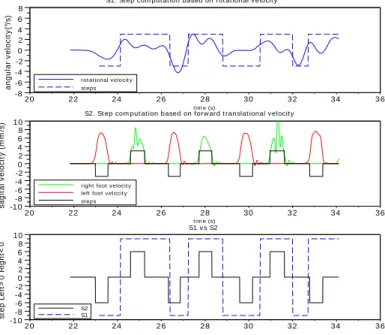
Validation of step detection The motion capture system tracks a marker set attached to the feet of the person. It gives the Cartesian position of the feet in a fixed Cartesian reference frame, which can be used to detect the steps. The velocity of the feet can also be used to determine the number of steps and their length. For example, the step starts when the velocity increases while it ends when the velocity is below an arbitrary threshold, as shown in Fig. 7.
The number of steps obtained using this method was compared with the result of the method proposed in Section. 2.2, as shown in Fig. 7. The first graph depicts the step detection by finding the zero value of the rotational velocity. The second graph represents the step detection by finding the sagital velocity changes. The third graph, at the bottom, compares the results of the two methods.
-0.5 -0.4 -0.3 -0.2 -0.1 0.0 0.1 0.2 0.3 0.4 0.5 0 50 100 150 200 250 300 y ( c m) a odometry motion capture x (cm) 0 5 10 15 20 25 30 35 3 4 5 6 7 8 odometry motion capture x ( c m/ s) time (s) b ˙ -50 0 50 100 150 200 250 300 -80 -60 -40 -20 0 20 40 60 y ( c m) odometry motion capture x (cm) c -8 -6 -4 -2 0 2 4 6 8 10 0 2 4 6 8 10 12 14 16 odometry motion capture time (s) x ( c m/ s ) d ˙
Fig. 6.Walker’s trajectory and velocity estimation using the encoder (odometry) and the motion capture system for two experiments: walking on a straight line (a. trajectory and b. velocity) and U-turn (c. trajectory and d. velocity).
It is worth mentioning that the number of steps shown in the first graph depends on the parameter of the low pass filter used for the angular velocity. If the parameter is well chosen, the number of steps is quite the same as measured with the motion capture system (see Fig. 7). If the low pass filter is not correctly tuned, the starting moment of the steps is not accurately found and that will impact the calculated step length and cadence.
In summary, our smart rollator gives results that are similar to motion cap-ture data while being cheaper, more convenient to use and faster to set up. Indeed, the motion capture has to be calibrated for each experiment, the marker set up takes time and is sensible to skin motion, it is also dependent from the abilities of the system operator and it is restricted to a small area (3-m field of view for whole body tracking with a 6-camera system) with good illumination condition. On the opposite, the walker only needs to be turned on, no calibration is required, the measurements are totally independent from the system operator, the user does not need to wear any marker and it is insensitive to condition while it can be used for large displacements. Furthermore, the motion capture has a framerate of 200Hz, while the encoders and inertial sensors are 1000Hz.
rot at ional v elocit y st eps -8 -6 -4 -2 0 2 4 6 8 20 22 24 26 28 30 32 34 36
S1. St ep com put at ion based on rot at ional v elocit y
t im e (s) a n g u la r v e lo c it y (° /s )
right foot v elocit y left foot v elocit y st eps -10 -8 -6 -4 -2 0 2 4 6 8 10 20 22 24 26 28 30 32 34 36
S2. St ep com put at ion based on forw ard t ranslat ional v elocit y
t im e (s) s a g it a l v e lo c it y ( m m /s ) S2 S1 -10 -8 -6 -4 -2 0 2 4 6 8 10 20 22 24 26 28 30 32 34 36 S1 v s S2 s te p L e ft > 0 R ig h t< 0
Fig. 7.Comparison of the step numbers estimated with the gyroscope vs ground truth given by the motion capture system. The rotational velocity values are filtered with a Butterworth low pass filter with a coefficient of 0.02.
3
Gait analysis of a 10m walk test
Several classical tests used to assess the mobility of elderly people are the 10m walk test (10mWT) (measure: time duration) [34], Timed Up and Go test (TUG) (measure: time duration) [35], Tinetti Test (TT) (analysis of gait parameters through a video) [36]. Such tests are easy to implement but are basically global (the time for the 10mWT and the TUG may be identical for two subjects which have however very different walking patterns) or are subjective (for the TT [37]). Furthermore these tests are performed only during medical visits and conse-quently are not appropriate to detect abnormal events in the walking patterns. Our objective was to examine if the measurements of our walking aid allow one to refine the output of the above walking tests.
For that purpose we have led a large scale experiment that was approved by the regional ethical committee (Comit´e de Protection des Personnes). Each subject was asked to walk along two specific trajectories while using the walker. One is a 10m straight line and another is an inverted L-shaped trajectory (see Fig. 12). The subjects are a group of young adults of INRIA (with age between 25 and 65 years, mean value 32) and a group of elderly people (age over 65 years) of Nice hospital. No subject has pathological walking diseases and all of them were asked to perform twice the trajectory with the walking aid.
3.1 Results
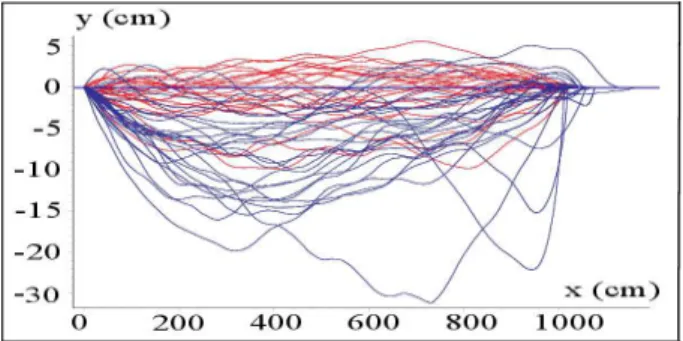
There were 23 young adults and 25 elderly people that participated to the 10mWT. The trajectories of all the subjects for the 10mWT are presented in Fig. 8. The ref-erence trajectory is the horizontal axis and the vertical axis is scaled to illustrate the lateral deviations between the real and reference trajectories. Fig. 8 clearly shows that the elderly subjects have larger deviations than the young subjects. The maximum lateral deviation between the real and reference trajectory of the two groups is presented in Fig. 9. It illustrates that the results of the elderly have a significantly larger deviation than that of the young subjects. For example, the mean value of the maximum lateral deviation for the elderly is 11.048 ± 5.99 cm while that for the young people is only 3.963 ± 2.301 cm.
Fig. 8.Trajectory of the subjects in the xy plane, where the blue color denotes the elderly subjects and the red one denotes the young subjects. The reference trajectory is the horizontal line: y = 0.
In addition, several other walking indicators calculated from a trajectory, e.g., the area between the real and reference trajectory, the traveled Manhattan distance and the orientation angle of the walker also reveal that the lateral motion of the elderly is larger than the younger. It has been has shown that there exists significant group difference in the medio-lateral displacement of the center of mass between healthy elderly adults and elderly patients [38] . It is consistent with our result and they reveal that walking accuracy can be regarded as a pertinent walking quality index.
Since the user’s step can be detected by using our walker, most of gait param-eters presented in the usual walking tests can be calculated or estimated, such as step length, step period, gait speed, cadence, forward acceleration and vari-ability of these gait parameters. Although the step width cannot be calculated accurately, the analysis of the walker’s lateral motion in the previous section can reflect the characteristic of the subjects’ step width.
Usually gait speed or walking velocity is regarded as a very important in-dicator of health. Some studies claimed that older subjects exhibited signif-icantly reduced gait speed compared to younger adults [12], [13], [19] while
(cm) old young
sorted subject numbers 25 20 15 10 5 5 10 15 20 25
Fig. 9. Maximum lateral deviation be-tween the real and reference trajectory. The results are sorted in ascending order.
ma imum instantanous speed (cm/s)
sorted subject numbers
220 200 180 160 140 120 100 5 10 15 20 25
Sorted subject number old
young
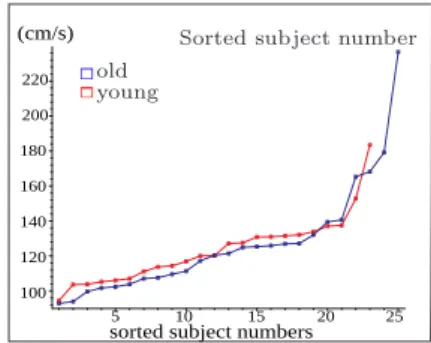
Fig. 10.Maximum instantaneous walking velocity of the two groups. The results are sorted in ascending order.
other studies showed that there were little or no differences in that [16], [17]. It has been shown that the gait speed depends on age, sex [20], use of mobility aids, chronic conditions, smoking history, blood pressure, body mass index, and hospitalization [22]. The instantaneous walking velocity can be derived from the encoder measurements and Fig. 10 gives their maximum values. It shows that the maximum walking velocity of the younger subjects is a little larger than that of the elderly. For the elderly the mean value of the maximum walk-ing velocity is 117.969 ± 15.851 cm/s and for the young people this value is 119.967 ± 16.019 cm/s. Hence there is no obvious difference between the two groups, which is consistent with the result of [16], [17].
We have also compared step period, step length and their variability for the two groups. Again, there is almost no difference between the two groups, which explains why the two groups have similar walking speed. The mean values of step period and step length of the elderly are 0.526 ± 0.1 s and 54.862 ± 11.643 cm, and 0.537 ± 0.095 s and 55.050 ± 8.605 cm for the young people.
4
Gait analysis of an inverted L-shaped trajectory test
An inverted L-shaped reference trajectory is described in Fig. 12. During the test, the subject was asked to walk along a 5m straight line, turn right (or left), walk along a 5m straight line again, turn 180◦ and return to the starting point.
Hence the total traveled distance is 20m. The inverted L-shaped trajectory test is considered because walking with turning is a common activity in our daily life. Turning frequently causes loss of balance in all gait disorders [39], and it is associated with increased risk of falling in elderly adults [40], [41].
Many analysis of turning are considered in TUG test or figure-of-eight walk-ing test. These studies examined the usual gait parameters such as used time [42], gait speed, stride length, cadence, double-limb support duration during the turning [43]. Other methods assess accelerometer-derived parameters [44], [26] and gyroscope-derived parameters [45]. Our objective is to find new quality
index during turning phase by using the walker instrumented with an accelerom-eter/gyrometer, which may help doctors to evaluate the fall risk of the elderly.
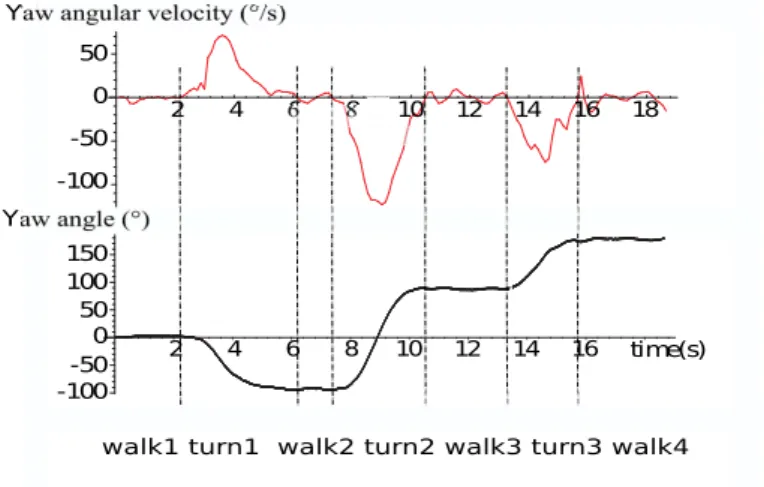
time(s) Yaw angular velocity (°/s)
Yaw angle(°)
walk1 turn1 walk2 turn2 walk3 turn3 walk4 50 0 -50 -100 2 4 6 8 10 12 14 16 18 50 0 -50 -100 100 150 2 4 6 8 10 12 14 16
Fig. 11.Yaw angle and yaw angular velocity of an elderly subject during the inverted L-shaped trajectory test.
4.1 Detection of distinct phases
Since the inverted L-shaped trajectory test consists of a sequence of activities such as walking, 90◦ turning and 180◦ turning, it is necessary to evaluate the
user’s ability in distinct phases or activities to make the test more sensitive. Several studies use wearable inertial sensors to detect the phases in TUG test by using the Euler angles or angular velocity signals that had been processed by filters [25], [26]. Some specific algorithms used to filter out the noise of the sensors for the detection are presented in [27], [46]. Here we use filtered yaw angle and yaw angular velocity to detect each activity and the test was divided into seven phases in sequence: walk 1, turn 1 (walking with 90◦ turning), walk
2, turn 2 (walking with 180◦turning), walk 3, turn 3 (walking with 90◦turning)
and walk 4, as shown in Fig. 11 and Fig. 12. For example, Fig. 11 presents both yaw angle and yaw angular velocity signals of an elderly subject during the test. In order to follow the reference trajectory shown in Fig. 12, the yaw angle of the walker changes from 0◦ to a nearby value of −90◦, 90◦ and 180◦ respectively at
the end of turn 1, turn 2 and turn 3. When the yaw angular velocity passes zero and the yaw angle signal starts to increase or decrease suddenly, the turn phase starts. From this moment when the yaw angular velocity passes zero again, the turn phase ends.
As soon as the onset and offset of the three turn phases are detected, the duration of all the seven phases are obtained. During the four walk phases, the yaw angular velocity passes zero several times although the yaw angle almost keeps a constant value, and these zero-pass moments can be used to detect the user’s steps, which has been presented in the previous section.
Fig. 12. Inverted L-shaped reference trajectory.
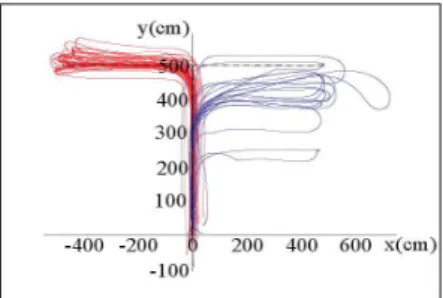
Fig. 13.Trajectory of the elderly (blue color) and young people (red color) in the xy plane.
4.2 Results
There were 25 young adults (between 25 and 65 years, mean value 32) and 12 elderly people (> 69 years) that participated to the inverted L-shaped trajectory test. The walking trajectories of the two groups using the walker are presented in Fig. 13, which clearly shows that most of the elder subjects cannot follow exactly the reference trajectory. This is consistent with the result of 10mWT (see Fig. 8 and Fig. 9), meaning that the deviation between the reference trajectory and the followed trajectory can be always regarded as a walking indicator.
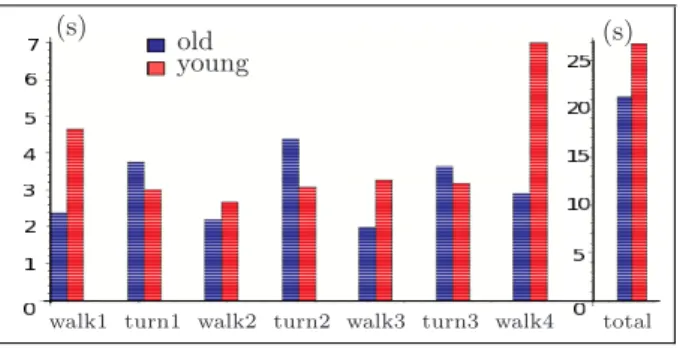
Turning duration is always an important index to be examined in the TUG test. It has been claimed that the elderly or people that has higher fall risk use more time during turning [25], [26], [27]. Fig. 14 presents the duration of each phase for the two groups. It clearly shows that the duration of all turning phases for the elderly is longer than that of the younger group, which is consistent with the result of previous studies. However, during the walking phases without turning, the elderly use less time. One reason which could explain this is shorter walking distance of the elderly (see Fig. 13) , with similar walking velocity of two groups, as presented in the previous section.
Using only the time parameter to evaluate the fall risk of the subject is obviously not sufficient. To further investigate this issue, other gait parameters derived from the walker will be assessed. From the walking trajectories shown in Fig. 13, we can see that the elderly need larger space to complete a turn. Hence it is interesting to compare the maneuver area, which is surrounded by a turning trajectory and a straight line that connects the start and end of the turning, as shown in green shadings of Fig. 12. Fig. 15 indicates that the maneuver area
walk1 turn1 walk2 turn2 walk3 turn3 walk4 total
(s) old (s)
young
Fig. 14.Comparison of the duration of each phase for young and elderly people.
of the elderly is significantly larger. Hence it can be regarded as an important indicator to quantify the maneuvering ability of subjects.
cm old
young
2
turn 1 turn 2 turn 3 7000 6000 5000 4000 3000 2000 1000
Fig. 15.Comparison of the maneuver area of each turning phase for the two groups.
(°/s) old young 60
40 20
0 turn 1 turn 2 turn 3
Fig. 16.Comparison of the RMS value of yaw angular velocity for the two groups.
Root mean square (RMS) is a statistical measure of the magnitude of a varying quantity and is especially useful for sinusoids. We compared the RMS value of yaw angular velocity during turning phases between the two groups (Fig. 16). It clearly shows that during turning phases the young people has a higher RMS value of yaw angular velocity. The value of every subject during the turn around phase (turn 2) is presented in Fig. 17. It indicates that almost all members of the elderly group has lower RMS value of yaw angular velocity except for one member (92.54◦/s). In addition, the trajectory of this subject, presented
in Fig. 18, shows that the maneuver area during turn 2 phase is very small, and almost equal to the one of the young people. In order to further investigate this issue, Fig. 19 presents the maneuver area and yaw angular velocity during turn 2 phase for all subjects. It shows that during the turning phase the young people has high RMS value of yaw angular velocity and a small maneuver area. This indicates that the two groups can almost be discriminated only by using these two indicators. Moreover, for the one subject that has the maximum RMS value of yaw angular velocity (92.54◦/s) in the elderly group, the maneuver area is
which can explain the abnormality of Fig. 17. The RMS value of acceleration
sorted number of subjects (°/s) old young 90 80 70 60 50 5 10 15 20 25
Fig. 17.RMS value of yaw angular velocity during the turn 2 phase for the two groups. The results are sorted in ascending order.
y (cm) x (cm) 500 400 300 200 100 0 100 200 300 400 500
Fig. 18.Trajectory of the elderly subject that has the maximum RMS value of yaw angular velocity during the turn 2 phase.
during each phase is compared for the two groups in Fig. 20. It reveals:
– all the subjects exhibit a larger acceleration during turning phases than during walking phases,
– for the elderly, the difference between the acceleration during turning phase and walking phase is significantly smaller,
– the elderly have smaller acceleration than the young people during the turn around phase while they exhibit a larger acceleration during walking phases.
R M S y aw a ngula r vel oci ty ( °/s ) old young 90 80 70 60 50 0 4000 8000 12000 16000 Maneuvre aera (cm )2
Fig. 19.RMS value of yaw angular velocity as a function of the maneuver area during the turn around phase (turn 2).
(g) old young 0.14 0.12 0.1 0.08 0.06 0.04 0.02 0
walk1 turn1 walk2 turn2 walk3 turn3 walk4
Fig. 20.RMS value of acceleration during each phase for young and elderly people.
In summary, by using the smart walker instrumented with inertial sensors, the subject’s gait can be assessed by the above indicators. Besides, we also compared other parameters for the two groups. Derived indicators during the 10 m straight line test and the turn around phase of inverted L-shaped trajectory test are summarized in Table 1.
Table 1.Gait indicators obtained during 10mWT and turn around phase of the inverted L-shaped trajectory test by using the walker, whereSmeans small and L means large.
10m straight trajectory Inverted L-shaped trajectory
Indicators Old Young Indicators Old Young
Lateral deviation L S Turning duration L S
Manhattan distance L S Maneuver area L S
Orientation angle L S RMS value of angular velocity S L
Forward acceleration L S Amplitude of angular velocity S L
Percentage of forward support S L RMS value of acceleration S L
5
Conclusions
This paper proposed a gait analysis method an instrumented walker. The results of a 10 m straight line test and an inverted L-shaped trajectory test for a group of young adults and a group of elderly people were compared comprehensively. The gait of the two groups were analyzed during both walking phases and turn-ing phases. Several indicators that exhibit significant difference between the two groups were obtained, such as the maximum lateral deviations, the orientation angle and the traveled Manhattan distance. For the elderly these indicators are much larger than that of the young people, which indicates that the walking ac-curacy of the elderly is lower. Moreover, we found there is no obvious difference in step length, step period and walking speed between two groups, which is con-sistent with some previous studies. It reveals that these classical gait indicators are neither sufficient nor sensitive enough to evaluate the fall risk of the elderly. For the inverted L-shaped trajectory test we found that indicators derived form the walker’s sensors can be used to classify the gait quality of subjects. For example, during the turning phases for the elderly the maneuver area is larger and the RMS value of angular velocity is smaller than that of the young people. In addition, for the elderly during turning phases the RMS value of acceleration is lower than that of the young people while during the walking phases it is larger than that of young people. Surprisingly this is inconsistent with previous studies [25], [26], which claimed that during both walking phases and turning phases the RMS values of acceleration for the group with high fall risk are smaller than that of the group with lower fall risk. However, during the 10mWT we also found that the elderly have larger forward acceleration and the walking velocity of the two groups are similar. Our interpretation is that elderly people are more familiar with walking aids and have walking patterns that benefit from such an aid, while younger people have a more dynamic pattern that is jeopardized by the aid. An open issue is to deduce the gait indicators for natural gait without the walker from the measurements obtained with the walker.
References
1. Alwan, M., et al.: Stability margin monitoring in steering-controlled intelligent walkers for the elderly. In: AAAI Fall Symposium, Arlington (4-6 November 2005) 1509–1514
2. Bostelman, R., Albus, J.: Robotic patient transfer and rehabilitation device for patient care facilities or the home. Advanced Robotics 22(12) (2008) 1287–1307 3. Glover, J., et al.: A robotically-augmented walker for older adults. Technical
Report CMU-CS-03-170, CMU, Pittsburgh (August 1 2003)
4. Frizera, A., Ceres, R., Pons, J., Abellanas, A., Raya, R.: The smart walkers as geriatric assistive device. the simbiosis purpose. Gerontechnology 7(2) (2008) 108– 113
5. Spenko, M., Yu, H., Dubowsky, S.: Robotic personal aids for mobility and mon-itoring for the elderly. IEEE Transactions on Neural systems and Rehabilitation Engineering 14(3) (2006) 344–351
6. Chugo, D., et al.: A moving control of a robotic walker for standing, walking and seating assistance. In: Int. Conf. on Robotics and Biomimetics, Bangkok (21-26 February 2008) 692–697
7. M´ed´eric, P., Pasqui, V., Plumet, F., Bidaud, P., Guinot, J.C.: Elderly people sit to stand transfer experimental analysis. In: 8th Int. Conf. on Climbing and Walking Robots (CLAWAR), London (2005)
8. Grasse, R., Mor`ere, Y., Pruski, A.: Assisted navigation for persons with reduced mobility: path recognition through particle filtering (condensation algorithm). J. of Intelligent and Robotic Systems 60(1) (2010) 19–57
9. Kulyukin, V., et al.: iWalker: toward a rollator mounted wayfinding system for the elderly. In: IEEE Int. Conf. on RFID, Las Vegas (16-17 April 2008) 303–311 10. Hirata, Y., Komatsuda, S., Kosuge, K.: Fall prevention of passive intelligent walker
based on human model. In: IEEE Int. Conf. on Intelligent Robots and Systems (IROS), Nice (22-26 September 2008) 1222–1228
11. Merlet, J.P.: ANG, a family of multi-mode, low cost walking aid. In: IEEE Int. Conf. on Intelligent Robots and Systems (IROS),Workshop Assistance and Service Robotics in a Human Environment, Vilamoura (October, 2012)
12. Hollman, J., Kovash, F., JJ.Kubik, Linbo, R.: Age-related differences in spatiotem-poral markers of gait stability during dual task walking. Gait & Posture 26(1) (2007) 113–119
13. Menz, H., Lord, S., Fitzpatrick, R.: Age-related differences in walking stability. Age Ageing 32(2) (2003) 137–142
14. Woledge, R., Birtles, D., Newham, D.: The variable component of lateral body sway during walking in young and older humans. The Journals of Gerontology: Series A 60(11) (2005) 1463–1468
15. Owings, T., Grabiner, M.: Variability of step kinematics in young and older adults. Gait & Posture 20(1) (2004) 26–35
16. Grabiner, P., Biswas, S., Grabiner, M.: Age-related changes in spatial and temporal gait variables. Archives of Physical Medicine and Rehabilitation 82(1) (2001) 31– 36
17. JM.Hausdorff, Edelberg, H., Mitchell, S., Goldberger, A., Wei, J.: Increased gait unsteadiness in community-dwelling elderly fallers. Archives of Physical Medicine and Rehabilitation 78(3) (1997) 278–283
18. Barbara, R., Freitas, S., Bagesteiro, L., Perracini, M., Alouche, S.: Gait character-istics of younger-old and older-old adults walking overground and on a compliant surface. Brazilian Journal of Physical Therapy 16(5) (2012) 375–380
19. SU.Ko, Hausdorff, J., Ferrucci, L.: Age-associated differences in the gait pattern changes of older adults during fast-speed and fatigue conditions: results from the baltimore longitudinal study of ageing. Age & Ageing 39(6) (2010) 688–694 20. Callisaya, M., Blizzard, L., Schmidt, M., McGinley, J., VK.Srikanth: Sex modifies
the relationship between age and gait: a population-based study of older adults. The Journals of Gerontology: Series A 63(2) (2008) 165–170
21. Zijlstra, W., Hof, A.: Assessment of spatio-temporal gait parameters from trunk accelerations during human walking. Gait & Posture 18(2) (2003) 1–10
22. Studenski, S., Perera, S., Patel, K., et al.: Gait speed and survival in older adults. The Journal of American Medical Association Network 305(1) (2011) 50–58 23. Callisaya, M., Blizzard, L., Schmidt, M., McGinley, J., VK.Srikanth: Ageing and
gait variability–a population-based study of older people. Age Ageing 39(2) (2010) 191–197
24. Hausdorff, J., Rios, D., Edelberg, H.: Gait variability and fall risk in community-living older adults: a 1-year prospective study. Archives of Physical Medicine and Rehabilitation 82(8) (2001) 1050–1056
25. Higashi, Y., Yamakoshi, K., Fujimoto, T., Sekine, M., Tamura, T.: Quantitative evaluation of movement using the timed up-and-go test. IEEE Engineering in Medicine and Biology Magazine 27(4) (2008) 38–46
26. Zakaria, N.A., Kuwae, Y., Tamura, T., Minato, K., Kanaya, S.: Quantitative anal-ysis of fall risk using tug test. Compute methods in biomechanics and biomechnical engineering (2013) 1–13
27. Salarian, A., Zampieri, C., Horak, F.B., Carlson-Kuhta, P., Nutt, J.G., Aminian, K.: Analyzing 180 degrees turns using an inertial system reveals early signs of progression of parkinson’s disease. 31st Annual International Conference of the IEEE Eng Med Biol Soc (2009) 224–227
28. Richards, J.G.: The measurement of human motion: A comparison of commercially available systems. Human Movement Science 18(5) (1999) 589 – 602
29. Lee, K., Jung, C.b., Chung, W.j.: Accurate calibration of kinematic parameters for two wheel differential mobile robots. Journal of Mechanical Science and Technology 26(5) (2011) 1603–1611
30. Zijlstra, W.: Assessment of spatio-temporal parameters during unconstrained walk-ing. European Journal of Applied Physiology 92(1-2) (2004) 39–44
31. Huang, Y., Zheng, H., Nugent, C., et al.: An orientation free adaptive step detec-tion algorithm using a smart phone in physical activity monitoring. Health and Technology (2) (2012) 249–258
32. Rebula, J., Ojeda, L., Adamczyk, P., Kuo, A.: Measurement of foot placement and its variability with inertial sensors. Gait & Posture 38(4) (2013) 974–980
33. Wu, G., Cavanagh, P.R.: {ISB} recommendations for standardization in the re-porting of kinematic data. Journal of Biomechanics 28(10) (1995) 1257 – 1261 34. Salbach, N., Mayo, N., Higgins, J., Ahmed, S., Finch, L., Richards, C.:
Responsive-ness and predictability of gait speed and other disability measures in acute stroke. Archives of Physical Medicine and Rehabilitation 82(9) (2001) 1204–1212 35. Podsiadlo, D., Richardson, S.: The timed ’up & go’: a test of basic functional
mobility for frail elderly persons. Journal of American Geriatrics Society 39(2) (1991) 142–148
36. Tinetti, M.: Performance-oriented assessment of mobility problems in elderly pa-tients. Journal of American Geriatrics Society 34(2) (1986) 119–126
37. Panella, L., Lombardi, R., Buizza, A., Gandolfi, R., Pizzagalli, P.: Towards objec-tive quantification of the tinetti test. Functional Neurology 17(1) (2002) 25–30
38. Hahn, M., Chou, L.: Can motion of individual body segments identify dynamic instability in the elderly. Clinical Biomechanics 18(8) (2003) 737–744
39. Joseph, H.F.: Gait in the elderly. Medicine and Health Rhode Island (2008) 134– 135
40. Tinetti, M.E., Speechley, M., Ginter, S.F.: Risk factors for falls among elderly persons living in the community. The New England Journal of Medicine 319(26) (1988) 1101–7
41. Tinetti, M.E., Williams, T.F., Mayewski, R.: Fall risk index for elderly patients based on number of chronic disabilities. The American Journal of Medicine 80(3) (1986) 429–434
42. Beauchet, O., Annweiler, C., Assal, F., Bridenbaugh, S., Herrmann, F.R., Kressig, R.W., Allali, G.: Imagined timed up & go test: a new tool to assess higher-level gait and balance disorders in older adults? Journal of the neurological sciences 294(1-2) (2010) 102–106
43. Shkuratova, N., Morris, M.E., Huxham, F.: Effects of age on balance control during walking. Archives of Physical Medicine and Rehabilitation 85(4) (2004) 582–588 44. Weiss, A., Herman, T., Plotnik, M., Brozgol, M., Maidan, I., Giladi, N., Gurevich,
T., Hausdorff, J.M.: Can an accelerometer enhance the utility of the timed up & go test when evaluating patients with parkinson’s disease? Medical Engineering & Physics 32(2) (2010) 119–125
45. Greene, B.R., O’Donovan, A., Romero-Ortuno, R., Cogan, L., Scanaill, C.N., Kenny, R.A.: Quantitative falls risk assessment using the timed up and go test. IEEE transactions on bio-medical engineering 57(12) (2010) 2918–26
46. Al-Jawad, A., Adame, M.R., Romanovas, M., Hobert, M., Maetzler, W., Traechtler, M., Moeller, K., Manoli, Y.: Using multi-dimensional dynamic time warping for tug test instrumentation with inertial sensors. IEEE International Conference on Multisensor Fusion and Integration for Intelligent Systems (MFI) (2012) 212–218
![Fig. 5. Walker and motion capture optical markers set-up [33]](https://thumb-eu.123doks.com/thumbv2/123doknet/13502795.415326/6.620.60.562.119.289/fig-walker-motion-capture-optical-markers-set.webp)