HAL Id: hal-02128052
https://hal.archives-ouvertes.fr/hal-02128052
Submitted on 13 May 2019
HAL is a multi-disciplinary open access
archive for the deposit and dissemination of
sci-entific research documents, whether they are
pub-lished or not. The documents may come from
teaching and research institutions in France or
abroad, or from public or private research centers.
L’archive ouverte pluridisciplinaire HAL, est
destinée au dépôt et à la diffusion de documents
scientifiques de niveau recherche, publiés ou non,
émanant des établissements d’enseignement et de
recherche français ou étrangers, des laboratoires
publics ou privés.
Measuring the Amazon Web Services (AWS) WAN
Infrastructure
Quentin Jacquemart, Alessandro Vitali, Guillaume Urvoy-Keller
To cite this version:
Quentin Jacquemart, Alessandro Vitali, Guillaume Urvoy-Keller. Measuring the Amazon Web
Ser-vices (AWS) WAN Infrastructure. CoRes 2019, 2019, Saint Laurent de la Cabrerisse, France.
�hal-02128052�
WAN Infrastructure
Quentin Jacquemart
1
et Alessandro Baldi Vitali
1
et Guillaume Urvoy-Keller
1
1CNRS, I3S, Universit´e Cˆote d’Azur
Modern applications necessitate geographically-distributed fragments over several data centers (DCs). Typical exam-ples include stream or batch processing of geo-distributed data, or the redirection of clients to the optimal data replica. While little is known on inter-DC networks, the common belief is that they are not as well provisioned as intra-DC networks. They could thus be the bottleneck of multi-DC applications. As Amazon Web Services (AWS) is arguably the most popular Infrastructure-as-a-Service (IaaS) cloud provider, our focus is on the WAN connectivity offered by AWS in-between its DCs.
We present preliminary results of a measurement campaign of the AWS WAN infrastructure, relying on traceroute measurements. Our initial observations highlight the complexity of the AWS infrastructure, which makes use of a variety of network solutions, including MPLS and Carrier-Grade NAT (CGNAT).
Mots-clefs : Amazon Web Services, Data Center networks, Measurements, Traceroute, Topology
1
Motivation
A number of use cases have recently emerged, which require applications to be geographically distributed over several data centers. Typical examples include stream or batch processing of geographically-distributed data, e.g. [ea17, ea18a], or the redirection of clients to the optimal data replica, e.g. [ea18b].
The aforementioned studies highlight the scarcity of resources in the WAN network interconnecting data centers (DCs). For instance, [ea18a], using iperf3, reports wide variations in throughput between pairs of AWS data-centers, in stark contrast with the low latency reachable, and with the abundance of bandwidth available between pairs of VMs in the same data center.
Since AWS is arguably the most popular IaaS cloud provider, we aim to shed light on the WAN connec-tivity offered by AWS, which operates its own WAN network in between its data centers†. The ability to correctly interpret runtime measurements from these distributed applications relies on the thorough under-standing of the design choices made by the cloud provider. For example, it is a complex task to relate iperf bandwidth measurements to the effective bandwidth available to application fragments if the cloud operator heavily relies on multi-paths in its infrastructure. Indeed, multi-path is often implemented with hash-based functions, leading iperf flows to measure a different path from the one actually used by the application fragments.
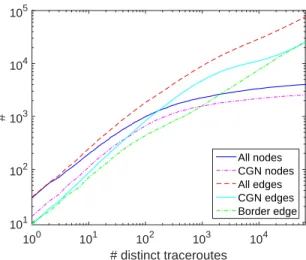
In this paper, we perform large-scale traceroute measurements in order to uncover the AWS network infrastructure. Figure 1 presents the cumulative number of edges and vertices discovered when performing Paris-traceroute [ea06] measurements for all the possible 65,536 source ports between the Canada and California DCs of AWS. We notice that the size of the graph is unusually large, with close to 3k nodes and 100k links. This implies that AWS heavily relies on multi-paths.
Our contributions are as follows. (i) We demonstrate that the apparently unbounded size of the AWS graph observed in Figure 1 is an invariant in the AWS infrastructure; in other words, it is observable for all pairs of data centers. (ii) A typical graph between a pair of DCs is made of several discernible layers. There
Quentin Jacquemart et Alessandro Baldi Vitali et Guillaume Urvoy-Keller # distinct traceroutes 100 101 102 103 104 # 101 102 103 104 105 All nodes CGN nodes All edges CGN edges Border edge
Fig. 1: AWS interconnection graph for between California and Canada
is a layer composed of Carrier-Grade NAT (CGNAT) [ea16, ea06]) at the boundary of each data center. Then, the core network appears to be an MPLS overlay. (iii) The CGNAT layer has a depth which is fixed for a given data center and varies from one data center to the other.
2
Our Approach
Amazon Web Services is currently established in 15 distinct locations worldwide. For our measurements, we created a VM in each DC, and we performed Paris-traceroute measurements between each pair of DCs, i.e. for all 210 distinct (ordered) pairs.
Traceroute can be done either with TCP, UDP, or ICMP, in the forward direction. We observed that AWS nodes only generate a reply if probed with UDP, on the traditional traceroute ports 33434-33464 as destination. We therefore use paris-traceroute in UDP mode, and vary the source port number, testing all possible 65536 possible values. The destination ports keep their traditional value: starting from port number 33434, and increasing with each probe sent. The campaign was carried out in a round-robin fashion with respect to the remote DCs: we start with port 1 towards the 14 other VMs, then move on to port 2, etc. The campaign spanned over a total of 5 days, measuring from all ports, in both directions, between every possible pairs of VMs.
The curves in Figure 1 are representative or the results obtained for any pair of DCs. These shapes appear to suggest that our measurements have not uncovered all the possible nodes. However, measuring the full graph is a daunting task due to the fact that a transport-level hash-based like routing appears to be done in the infrastructure, leading to probes always following the same path for a given IP/port source-destination 4-tuple. Additionally, as previously stated, the AWS infrastructure only responds to a limited range of destination ports. We thus have exhausted our measurement options while varying the source port.
3
Results
We now report on preliminary results obtained from our measurements, focusing on a single pair of DCs: California-Canada.
3.1
Successes and Failures
Table 1 provides an overview of the measurement results for the DC pair California-Canada. 93% of our traceroutes (61,085 out of 65,536) reached their intended destination. 6% failed to reach the destination VM; and 0.1% structurally failed with an empty output file. Overall, over 5.3M probe replies were received, and only 1,917 probes timed out.
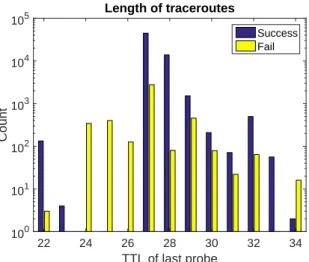
A high proportion of successful traceroutes is not always reached for all DC pairs. The precise investi-gation of this phenomenon is left for future work. However, we emphasize on one key point illustrated by Figure 2. The length of the traceroutes vary importantly. In other words, the distance to the last hop from which we receive an answer varies vastly in the case of a failing traceroute. More surprisingly, the distance in hops to the destination VM, also varies, over the set of source ports. This highlights the complexity of the infrastructure and hints toward the presence of rate limiting rules in the AWS infrastructure.
Successes Failures Empty Hop replies Hop stars 61,085 4,358 93 5,358,261 1,917
Tab. 1: Traceroute results summary for the pair California-Canada.
TTL of last probe 22 24 26 28 30 32 34 Count 100 101 102 103 104 105 Length of traceroutes Success Fail
Fig. 2: Length of traceroutes for successful and failing traceroutes (California-Canada pair)
3.2
Structure of Topology
As observed in Figure 1, the uncovered topology is rather large. We analyzed per-port results, by looking at the IP addresses of intermediate hops, and by using additional information provided by Paris-traceroute, such as the presence of MPLS labels. An excerpt of a traceroute output is available in Listing 1.
We observe two types of addresses: public IPv4 addresses (belonging to AWS), and addresses belonging to 100.64.0.0/10, reserved for CGNAT use. CGNAT is usually deployed by mobile and fixed ISPs to connect their clients to the Internet, circumventing the IPv4 exhaustion problem. AWS appears to rely on it to provide network access to user VMs. Please note that even a VM with a public address issuing a connection outside the AWS infrastructure is going to pass through the CGNAT layer that surrounds any AWS DC. We use the term “surround” as the RTT values indicate the CGNAT layer is in the close vicinity to each DC.
We further observe that the CGNAT layer consists of a fixed number of levels, which is a constant for a given DC. For the California-Canada pair, it consists of 4 levels on the California side, and 8 levels at the Canada side. Furthermore, it is independent of the destination: probes leaving the California DC will cross 4 levels of CGNAT, regardless of their destination.
These CGNAT layers are responsible for the vast majority of the graph size both in terms of nodes and links as can be seen on Figure 1. They amount to over 90% of the links/nodes of the graph.
Between the CGNAT layers, in the core inter-DC networks, we find nodes with a public IP address belonging to Amazon, that are MPLS-enabled. This is a natural choice to apply traffic engineering on WAN networks.
Quentin Jacquemart et Alessandro Baldi Vitali et Guillaume Urvoy-Keller
traceroute [(172.31.4.207:10000) -> (13.57.190.178:33457)],
protocol udp, algo hopbyhop, duration 4 s 1 52.60.0.64 14.781 ms 19.208 ms 15.460 ms 2 100.66.0.156 16.841 ms 22.686 ms 16.655 ms 3 100.66.0.29 12.797 ms 18.716 ms 12.521 ms 4 100.65.0.33 1.143 ms 2.275 ms 1.072 ms 5 52.94.81.45 76.335 ms 76.195 ms 77.265 ms MPLS Label 339072 TTL=1 [...]
Listing 1: An excerpt of a traceroute for the California-Canada pair
4
Discussion and Conclusion
While we have only scratched the surface of the problem, our preliminary results enabled us to obtain key information on the AWS inter-DC network infrastructure, such as the use of CGNAT, of MPLS, and on their impact on the topology graph size, as can be measured by traceroute.
As future work, we intend to analyze another key dimension of the traceroute, namely the RTT measure-ments. The analysis of the variance of the RTTs can provide important insights for a typical application deployed over multiple data centers.
Last but not least, we intend to refine our measurement methodology to try to limit the number of failures in our measurements.
Acknowledgment
The research leading to these results has received funding from the European Commission’s Horizon 2020 Framework Programme for Research and Innovation (H2020), under grant agreement #732339: PrEsto-Cloud (http://www.prestocloud-project.eu/).
References
[ea06] Brice Augustin et al. Avoiding traceroute anomalies with paris traceroute. In Jussara M. Almeida, Virg´ılio A. F. Almeida, and Paul Barford, editors, ACM IMC, 2006.
[ea16] Philipp Richter et al. A multi-perspective analysis of carrier-grade NAT deployment. In Phillipa Gill, John S. Heidemann, John W. Byers, and Ramesh Govindan, editors, ACM IMC, 2016. [ea17] Kevin Hsieh et al. Gaia: Geo-distributed machine learning approaching LAN speeds. In Aditya
Akella and Jon Howell, editors, USENIX NSDI, 2017.
[ea18a] Albert Jonathan et al. Multi-query optimization in wide-area streaming analytics. In ACM SoCC, 2018.
[ea18b] Kirill L. Bogdanov et al. Fast and accurate load balancing for geo-distributed storage systems. In ACM SoCC, 2018.