HAL Id: cea-02434394
https://hal-cea.archives-ouvertes.fr/cea-02434394
Submitted on 10 Jan 2020
HAL is a multi-disciplinary open access archive for the deposit and dissemination of sci-entific research documents, whether they are pub-lished or not. The documents may come from teaching and research institutions in France or abroad, or from public or private research centers.
L’archive ouverte pluridisciplinaire HAL, est destinée au dépôt et à la diffusion de documents scientifiques de niveau recherche, publiés ou non, émanant des établissements d’enseignement et de recherche français ou étrangers, des laboratoires publics ou privés.
Albumin-driven disassembly of lipidic nanoparticles: the
specific case of the squalene-adenosine nanodrug
Frédéric Gobeaux, Joëlle Bizeau, Firmin Samson, Laurent Marichal, Isabelle
Grillo, Frank Wien, Semen Yesylevskyy, Christophe Ramseyer, Marie
Rouquette, Sinda Lepetre-Mouelhi, et al.
To cite this version:
Frédéric Gobeaux, Joëlle Bizeau, Firmin Samson, Laurent Marichal, Isabelle Grillo, et al.. Albumin-driven disassembly of lipidic nanoparticles: the specific case of the squalene-adenosine nanodrug. Nanoscale, Royal Society of Chemistry, 2020, 12, pp.2793-2809. �10.1039/C9NR06485K�. �cea-02434394�
Albumin-driven disassembly of lipidic nanoparticles:
the specific case of the squalene-adenosine nanodrug
Frédéric Gobeaux
1,*, Joëlle Bizeau
1, Firmin Samson
1, Laurent Marichal
1,2,
Isabelle Grillo
3,†
,Frank Wien
4, Semen O. Yesylevsky
5, Christophe Ramseyer
6,
Marie Rouquette
7, Sinda Lepêtre-Mouelhi
7, Didier Desmaële
7, Patrick Couvreur
7,
Patrick Guenoun
1, Jean-Philippe Renault
1, Fabienne Testard
1,*1 LIONS - NIMBE CEA, CNRS, Université Paris-Saclay, CEA Saclay, 91191 Gif-sur-Yvette Cedex,
France
2 I2BC, JOLIOT, DRF, CEA, CNRS, Université Paris-Saclay, Gif-sur-Yvette, France 3 Institut Laue Langevin, 71 avenue des martyrs, B.P. 156, 38042 Grenoble Cedex 9, France 4 SOLEIL Synchrotron, Saint Aubin, France
5 Department of Physics of Biological Systems, Institute of Physics of the National Academy of
Sciences of Ukraine, Prospect Nauky 46, 03028 Kyiv, Ukraine
6 Laboratoire Chrono Environnement UMR CNRS 6249, Université de Bourgogne Franche-Comté, 16
route de Gray, 25030 Besançon Cedex, France.
7 Institut Galien Paris-Sud, UMR 8612, CNRS, Université Paris-Sud, Université Paris-Saclay, Faculté
de Pharmacie, 5 rue Jean-Baptiste Clément, F-92296 Châtenay-Malabry Cedex, France.
†
Dr. Isabelle Grillo passed away in August 2019. All the authors wish to dedicate this article to her fond memory.Correspondance: * frederic.gobeaux@cea.fr, * fabienne.testard@cea.fr
Abstract
In the field of nanomedicine, nanostructured nanoparticles (NPs) made of self-assembling prodrugs emerged in the recent years with promising properties. In particular, squalene-based drug nanoparticles have already shown their efficiency through in vivo experiments. However, a complete pattern of their stability and interactions in the blood stream is still lacking. In this work we assess the behavior of squalene-adenosine (SQAd) nanoparticles – whose neuroprotective effect has already been demonstrated in murine models – in the presence of fetal bovine serum (FBS) and of bovine serum albumin (BSA), the main protein of blood plasma. Extensive physicochemical characterizations were performed using Small Angle Neutron Scattering (SANS), cryogenic transmission electron microscopy (Cryo-TEM), circular dichroism (CD), steady-state fluorescence spectroscopy (SSFS) and isothermal titration calorimetry (ITC) and in silico by means of ensemble docking simulations with human serum albumin (HSA). Significant changes in the colloidal stability of the nanoparticles in the presence of serum albumin were observed. SANS, CD and SSFS analyses demonstrated an interaction
between SQAd and BSA, with a partial disassembly of the nanoparticles in the presence of BSA and the formation of a complex between SQAd and BSA. The interaction free energy of SQAd nanoparticles with BSA derived from ITC experiments, is about -8 kcal/mol which is further supported in silico by ensemble docking simulations. Overall, our results show that serum albumin partially disassembles SQAd nanoparticles by extracting individual SQAd monomers from them. As a consequence, the SQAd nanoparticles would act as a circulating reservoir in the blood stream. The approach developed in this study could be extended to other soft organic nanoparticles.
Keywords: nanodrug, serum albumin, disassembly, complexation,
Introduction
Since the end of the 1990s, there has been an intense research activity towards the development of nano-assemblies for drug delivery. Such devices could help transporting non soluble drugs in the blood stream, increasing their bioavailability and efficacy, but also allowing to target specific tissues and overcoming biological barriers.1 Numerous types of nanoassemblies were
developed for these purposes: micelles, liposomes, nanocapsules and multicomponent nanoparticles. However, many of them never reached the clinical phase III of drug development.2 Of note, phase II
studies are very costly and often result in failure because results obtained in animal studies (phase I) do not always simply translate to humans. To prevent such attrition, Arvinte et al. proposed that the development of any drug should include “studies of their compatibility in different formulations with human plasma under conditions as near as possible to those planned to be used in human studies”
.
3 Such in vitro studies may, indeed, reduce resorting to living animals and deepen the understanding of the interactions between drug nanocarriers and complex biological media.5–8Upon introduction into a biological fluid, nanoparticles are expected to be quickly covered within milliseconds by a protein corona,9–12 which is known to give a new biological identity to the
nanoparticles. This may result in drug resistance effect, alteration of the immune response or neutralization of the targeting ligands grafted on the surface of nanoparticles.13,14 The composition of
the protein corona can be very complex.15–17 However, a first focus has to be made on the serum
albumin which is the most abundant protein in mammalian plasma18,19 – accounting for 55% of the
protein content. Additionally, serum albumin binds to a wide variety of ligands20,21 and, particularly,
acts as a carrier for steroids, fatty acids and thyroid hormones in the blood. It is thus a sound approach to use serum albumin as an in vitro model for biological medium since lipophilic and amphiphilic drugs (whether in nanoparticulate form or not) injected in the body are very likely to encounter and interact with it.22–24 Albumin is also known to accumulate in solid tumors and inflamed tissues and
thus can be harnessed to target cancerous cells.22 Several approaches were thus proposed to use
albumin as a drug delivery vector including coupling of the drugs to albumin or encapsulating them into albumin nanoparticles.25–27
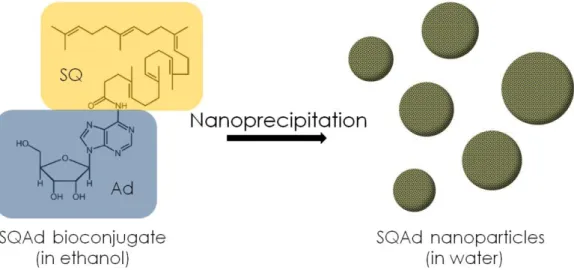
In the present study, we have investigated the fate of squalene-adenosine (SQAd) nanoparticles28 in albumin solutions at concentrations close to that of the human plasma. These
nanoparticles are formed by nanoprecipitation of SQAd bioconjugates in water through hydrophobic interactions (Figure 1).28–34 Adenosine is an endogenous nucleoside with potential neuroprotective
pharmacological activity through the targeting of its four receptors expressed throughout the body.35,36
The “squalenoylation” of adenosine was previously found to increase its half-life, and to avoid adverse effects of free adenosine33,34, while the squalene moiety drives the assembly of the nanoparticles in
water. Although the efficacy of squalene-based drugs has already been demonstrated in vivo on rodents33,37, the pharmacokinetics of such assembled systems is extremely hard to evaluate since the
circulating prodrug is potentially present under three forms upon administration: assembled into nanoparticles, as free bioconjugates and bound to plasma proteins.38 This partitioning can have
important consequences on the transport and subsequent tissue/cell uptake of the drug. In 2010, Bildstein et al. have shown that uptake of the drugs by the cells was influenced by the concentration and the nature of extracellular proteins.29 It was later shown by radio-analysis of plasma fractions and
molecular dynamic simulations that low density lipoproteins (LDL)37 and to a lesser extent human
serum albumins37,39,40 participated in the uptake of squalene-gemcitabine bioconjugates. However, the
specificity of the SQAd interactions with these biomolecules remains unknown.
The interaction of nanoparticles with proteins is widely studied in the (bio)nanoscience community.41–43 However, studies dealing with protein-nanoparticle interactions are mostly focused on
the protein structural modifications in the presence of “rigid” mineral nanoparticles (e.g. silica or metallic nanoparticles) while possible modification of the nanoparticles themselves by the proteins are rarely considered yet, except in the case of cubosomes that have been shown to be destabilized by blood components.44,45 The SQAd nanoparticles are soft nano-assemblies that can potentially act as
reservoirs from which monomers can be extracted during their interaction with cells or blood plasma components, such as proteins or lipoproteins. In this work, we have used multiple complementary techniques to probe the nanoparticles with cryogenic transmission electron microscopy (cryo-TEM) and small angle neutron scattering (SANS) on the one hand, the proteins with spectroscopic methods on the other hand, and the overall interaction with isothermal titration calorimetry (ITC). Finally, this experimental study is completed by molecular dynamics simulations. The chosen approach enables to scrutinize both the effect of the plasma proteins on the SQAd nanoassemblies and the effect of the SQAd on them. Since SQAd nanoparticles are nano-assemblies in dynamic equilibrium with the monomeric SQAd bioconjugate, we are able to follow how this equilibrium can be affected by the components of the biological medium and go towards a better understanding of these complex interplays.
Figure 1: Molecular structure of the squalene-adenosine monomer and nanoparticles obtained after dropwise addition of the organic solution in deionized water followed by elimination of the organic solvent (nanoprecipitation process).
Results and discussion
A. Characterization of SQAd nanoparticles in model biologic media
Small Angle Neutron Scattering (SANS)
Effect of Fetal Bovine Serum on SQAd nanoparticles – Characterizing nanoparticles in media
as complex as blood plasma is difficult because of the high concentration of blood components of nanometric size. Dynamic Light Scattering (DLS), which is usually used to estimate the size of squalene-based nanoparticles31,34,46,47 remains a low-resolution method not adapted to study
polydisperse assemblies of nanoparticles48 within a concentrated complex media. By contrast, Small
Angle Neutron Scattering is a powerful method for characterizing the squalenoyl conjugated nanoparticles dispersed in D2O47 and is suitable to study multicomponent systems.49,50 To monitor the
impact of plasma components on the SQAd nanoparticles dispersion, we have performed SANS experiments with SQAd nanoparticles in fetal bovine serum (FBS), which, in addition to BSA, contains tens of other proteins18 and lipoproteins particles whom previous studies have shown their
importance for SQAd transport and targeting.37–39 For comparison, Figure 2A first shows the SANS
patterns of 0.4 mg/ml SQAd nanoparticles in D2O (blue circles). This signal is typical of hydrogenated
spherical nanoparticles dispersed in a deuterated solvent.47 We retrieve the characteristic q-4
dependence in the middle q-range (also called Porod regime), a signature of the abrupt interface layer between hydrogenated nanoparticles and deuterated solvent. The intensity reaches a constant value in the low q range (q < 0.004 Å-1) indicating a finite size for these nanoparticles (Cf. Table 1 for gyration
radii extracted from Guinier fits at the low q range). We can also fit this pattern with a lognormal distribution of spheres as shown in the supplementary information section (Figure S5, Tables S2 and S3).
When these nanoparticles were mixed (final concentration = 0.4 mg/ml) with FBS dialyzed against PBS/D2O (violet circles), the scattered intensity in the same low q-range decreased indicating a
decrease of the nanoparticle contribution. Moreover, the existence of a plateau indicates that the nanoparticles remain stable colloids. At higher q-range (q > 0.01 Å-1), a new signal appears. This
signal perfectly superimposes with the SANS scattering signal of FBS in PBS/D2O (carmine squares).
The SANS pattern of the mixture SQAd/dialyzed FBS corresponds to the addition (continuous black line) of a fraction of the individual contributions from SQAd nanoparticles and FBS at same concentration. Table 2 summarizes the coefficients used for each contribution and shows that 50% of the SQAd nanoparticles signal disappeared (in comparison to the SQAd/D2O at the same SQAd
concentration). This decrease in intensity originates in a decrease in volume fraction but could also be associated to a small decrease of the nanoparticles radius (although not observable for the FBS case on the fitting parameters (Table S3)). A strong effect of FBS on the SQAd nanoparticles is then demonstrated, suggesting their partial disassembly. The linear combination of SQAd nanoparticles and FBS contributions also demonstrates that no noticeable interactions are induced by proteins on SQAd nanoparticles. This tendency is surprising as an increase of the scattering is expected in case of corona formation around nanoparticles or aggregation thereof.51,52 To get a deeper understanding of this
phenomenon, we decided to use a simplified model system. The rest of the study is thus restricted to BSA solutions only. As mentioned earlier and as confirmed by its scattering pattern (Figure 2B, carmine squares), FBS is a multicomponent system, but Figure 2B shows that the main contribution to FBS SANS pattern (open carmine squares) comes from the scattering of BSA (closed red diamonds), whose concentration was estimated to be 40 mg/ml.
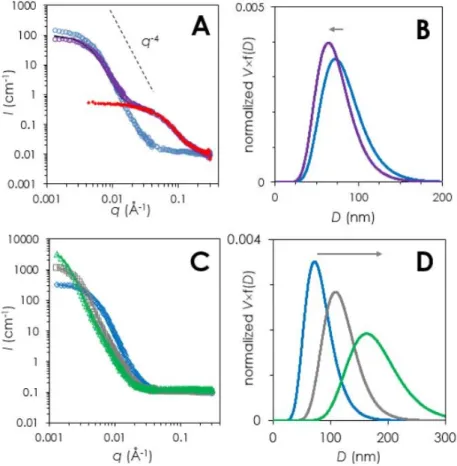
Figure 2 : A) SANS patterns of SQAd/D2O ([SQAd] = 0.4 mg/ml) (blue circles), SQAd/FBS/PBS/D2O ([SQAd] = 0.4
mg/ml) (violet circles) and FBS/PBS/D2O (carmine squares) at the same concentration as in the SQAd solution. The black
FBS/PBS/D2O (same FBS concentration) (see table 1 for the corresponding used coefficients). B) SANS pattern of a FBS
solution dialyzed against PBS/D2O during one night (carmine squares) and BSA SANS pattern for an equivalent BSA
concentration of 40 mg/ml (closed red diamonds).
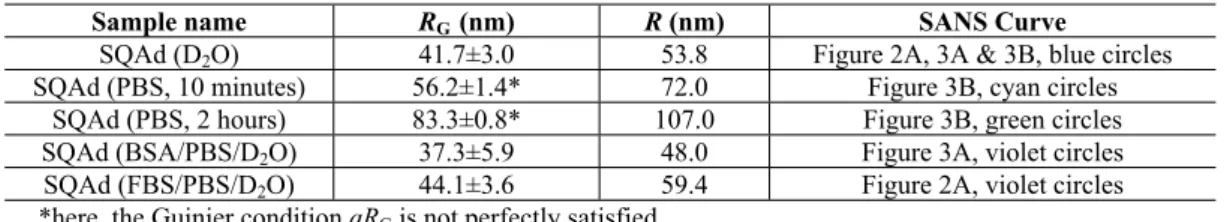
Table 1: Nanoparticle radii of gyration obtained from Guinier fit (RG) and corresponding spherical radii (R). The
scattering curves used to calculate the Guinier radius are indicated in the last column. The fits can be seen in Figure S4.
Sample name RG (nm) R (nm) SANS Curve
SQAd (D2O) 41.7±3.0 53.8 Figure 2A, 3A & 3B, blue circles
SQAd (PBS, 10 minutes) 56.2±1.4* 72.0 Figure 3B, cyan circles SQAd (PBS, 2 hours) 83.3±0.8* 107.0 Figure 3B, green circles SQAd (BSA/PBS/D2O) 37.3±5.9 48.0 Figure 3A, violet circles
SQAd (FBS/PBS/D2O) 44.1±3.6 59.4 Figure 2A, violet circles
*here, the Guinier condition qRG is not perfectly satisfied
Table 2: Coefficients used to evaluate the fractions of the signal from individual components SQAd/D2O and
BSA/PBS/D2O (respectively FBS/PBS/D2O) at nominal concentration “a*ISQAd/D2O + b*IBSA/PBS” (respectively)
“a*ISQAd/D2O + b*IFBS/PBS” to reproduce the intensity of SQAd/BSA/PBS/D2O (respectively SQAD/FBS/PBS/D2O)
obtained after mixing. The corresponding scattering curves are indicated in the last column.
Coefficient a b SANS curve
[SQAd ] = 0.4 mg/ml (with FBS) 0.5 0.95 Figure 2A, violet circles
[SQAd] = 0.4 mg/ml (with BSA) 0.65 0.91 Figure 3A, violet circles
[SQAd ] = 1 mg/ml (with BSA) 0.8 0.90 Data not shown
Nanoparticle colloidal stability in presence of BSA/PBS vs PBS –The Figure 3A displays the
SANS patterns obtained 2 hours after mixing SQAd nanoparticles (final SQAd concentration = 0.4 mg/ml) with BSA (final BSA concentration = 6.5 mg/ml in PBS/D2O) (violet circles) compared with
the equivalent solution diluted in D2O (blue circles). Just as with FBS, the intensity in the low q-range
(q < 0.004 Å-1) decreased in the presence of BSA, indicating a decrease of the nanoparticles volume
fraction, while in the middle q-range (q > 0.01 Å-1) a new signal appeared, overlapping the SANS
pattern of 6.5 mg/ml BSA in D2O (closed red diamonds). This overall signal was stable over 9 hours.
Here again, the scattered intensity of the mixture is compatible with a linear combination of the individual SANS contribution from BSA/PBS ([BSA] = 6.5 mg/ml) and SQAd/D2O ([SQAd]=0.4
mg/ml). The obtained coefficients (Table 2) show that about 35% of the SQAd nanoparticle scattering signal disappears in the presence of BSA. This effect is even larger when the BSA/SQAd ratio is increased. Indeed, as shown in Figure S6 in the supplementary information, the nanoparticle scattering signal then drops and the signal-to-noise ratio becomes very poor. This decrease in intensity contribution could result from a decrease of SQAd volume fraction or from a decrease of radius, or from a combination of both. However, the slight decrease of nanoparticle radius (indicated by a small decrease in RG in Table 1 and in radius fitting values shown in Table S2). Likewise, about 10% of free
BSA seems to have disappeared, which could be attributed to some adsorption on the nanoparticles surface.
To verify that this effect was indeed due to BSA only, we analyzed the buffer effect on the nanoparticles. When the nanoparticle suspension was diluted in a PBS solution without BSA, the behavior was completely different as can be seen in Figure 3B. The comparison of SQAd/D2O SANS
Porod regime shifted towards lower q and the intensity in the lower q range increased in presence of added salts. This indicates that an increase of ionic strength of the solution led to an increase of the size of the nanoparticles (see
Table 1). A similar behavior was obtained with a 1 mg/ml SQAd nanoparticle dispersion in PBS (see Figure S7 in SI). Therefore, BSA not only leads to a decrease of nanoparticles volume fraction (possibly associated with a decrease of the radius) in solution, but also to a stabilization of the remaining nanoparticles.
Figure 3: SANS characterization of SQAd nanoparticles in presence of BSA and PBS. A) SANS patterns of 0.4 mg/ml
SQAd nanoparticles in D2O (blue circles) or with BSA/PBS ([BSA] = 6.5 mg/ml)(violet circles) compared to the SANS
pattern of BSA (6.5 mg/ml) in PBS/D2O (closed red diamonds). The black line corresponds to linear combination of
independent SQAd and BSA SANS patterns (see table 2 for the corresponding coefficients.) B) Lognormal size distribution of SQAd in water (blue line) and SQAd nanoparticles in the presence of PBS (purple line) derived from the fits of the SANS patterns in panel A. C) SANS patterns of SQAd nanoparticles (0.4 mg/ml) in D2O (blue diamonds), in 0.2 M PBS just after
sample preparation (i.e. ~10 minutes) (grey squares) and 2 hours after sample preparation (green triangles) and corresponding lognormal size distributions derived from fit (D). The colored lines are the corresponding fits with lognormal distributions of spheres.
Cryogenic Transmission Electron Microscopy
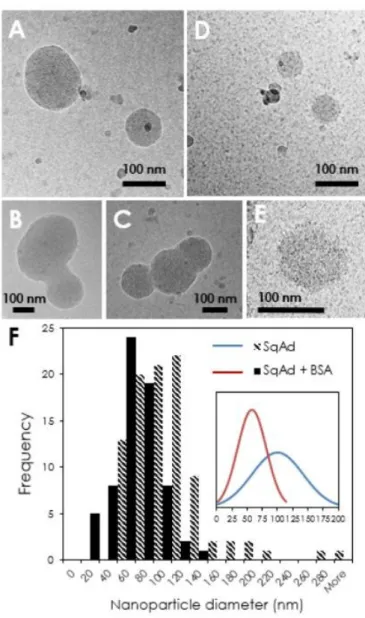
Cryo-TEM allowed imaging individual SQAd nanoparticles and assessing their morphology. In water or in D2O, they appeared roughly spherical and polydisperse (Figure 4A). With the SQAd
batch used in this study, the internal structure observed on micrographs corresponds to sponge phases. Even in very fresh solutions, about 20% of the observed nanoparticles were aggregated in groups of three to four, suggesting that SQAd can easily get destabilized (Figure 4C-D), even in the absence of
PBS. On contrary, when the nanoparticles were mixed with BSA in 70 mM PBS/D2O, their size
clearly appeared to be smaller and more spherical (Figure 4B). Also, all the nanoparticles remained isolated as if the presence of BSA prevented aggregation. The BSA molecules appeared to be dispersed evenly in the background of Figure 4B, not showing any sign of adsorption or depletion in the vicinity of nanoparticles. There was no apparent sign of the formation of a protein corona around the nanoparticles.53 In order to quantify the size distribution of the nanoparticles, systematic
measurement of the diameter of at least 60 particles was reported in the histogram displayed in Figure 4, which evidences a decrease of average particle size as well as a narrowing of the size distribution in the presence of BSA. Nevertheless, the two size distributions remain rather wide and overlap to a great extent.
Figure 4: Cryogenic transmission electron microscopy characterization of SQAd nanoparticles. A, B, C) SQAd
nanoparticles in D2O. D & E) SQAd nanoparticles in presence of BSA in 70 mM PBS/D2O. F) Diameter histograms for
SQAd without and with BSA built with 94 and 67 measurements respectively. The inset shows the two Gaussian distributions built with the averages and standard deviations of the measurements (the area below the curves is normalized).
Altogether, these physico-chemical characterizations of the SQAd nanoparticles suspensions showed that their colloidal stability is very sensitive to salt conditions and to the presence of BSA
although more systematic studies are still needed to map out a complete stability diagram and delineate all the underlying interactions.54 Moreover, the volume fraction of the scattering
nanoparticles decreases in presence of BSA, which suggests that a significant amount of SQAd monomers are extracted from the nanoparticles.
B. Spectroscopic Characterization of the Squalene-Adenosine—BSA interaction
Circular dichroism
Circular dichroism gives information on the molecular conformation of optically active chiral molecules. It is particularly adapted to study the global conformation of proteins in solution and to monitor their modification as they interact with a ligand.55,56 Despite the fact that the adenosine moiety
in solution yields a dichroic signal57, we have not observed a dichroic signature of the SQAd
nanoparticles at the concentrations used. In contrast, BSA yielded a strong and characteristic spectrum featuring a positive band centered at 192 nm and a negative band with two peaks at 210 and 224 nm (see red spectrum in Figure S8). Consequently, only the modification of the BSA conformation could be monitored at a fixed concentration (13.65 µM) in the presence of increasing concentration of SQAd nanoparticles. Figure S8 exhibits the evolution of BSA circular dichroism spectrum with increasing amount of SQAd nanoparticles. The more nanoparticles were added, the more the absolute intensity of the signal decreased. The overall shape of the spectrum was also modified, indicating a partial conformational change of a fraction of BSA molecules: the alpha helix content estimated with BestSel58 fits dropped from about 40% to only 20-30%. Such a change may be either the signature of a
corona formation on the nanoparticles (proteins tend to unfold upon adsorption on surfaces)59 or of a
binding of squalene to the protein (some hydrophobic ligands induce in BSA unfolding structure change).60,61
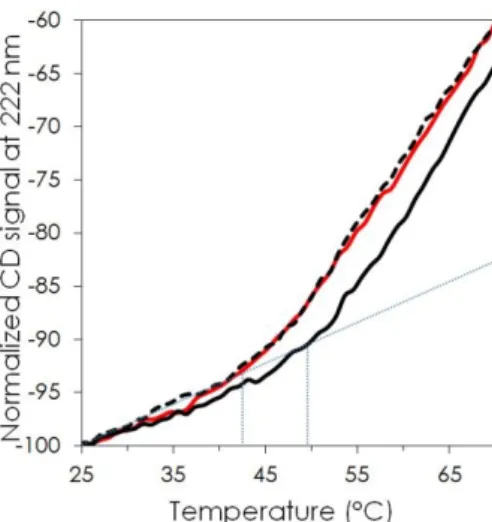
The thermal stability of BSA, alone or, in presence of either free adenosine, or SQAd nanoparticles, was also tested (Figure 5). The normalized intensity at 222 nm was plotted as a function of temperature between 25° and 70°C. The plots clearly show that the denaturation curves of BSA (red trace) and BSA in the presence of adenosine (black dashed trace) barely differed. In both cases, the onset of BSA denaturation was about 42°C, which is in agreement with previous studies.62–64 This
again suggests that BSA remained in its native state in the presence of adenosine molecules. However, in the presence of SQAd nanoparticles, the corresponding denaturation curve diverged from that of native BSA, with an onset near 50°C, showing that the denaturation rate of BSA in the presence of SQAd nanoparticles was lower comparatively to native BSA. These observations suggest that BSA was involved in a complex with SQAd that increases the protein’s stability. Therefore, the change in conformation revealed by CD is not a denaturation/unfolding of the protein but rather the formation of an alternate, more stable structure. However, this conformational change is not negligible and it could partially affect some functionality of BSA.65,66 Finally, given that BSA did not interact with the
adenosine moiety, it is confirmed that it rather interacts with the squalene moiety of the SQAd bio-conjugate. This cannot be directly tested since the squalene molecule is insoluble in water, but is not surprising since BSA is known to possess several sites to bind with fatty acids and steroids.67
Figure 5: Thermal denaturation of BSA (red trace), BSA + adenosine (black dashed trace) and BSA + SQAd nanoparticles
with 11:1 molar ratio (continuous black trace) monitored with CD signal at 222 nm.
Fluorescence quenching
The nature of the BSA-SQAd complex was further characterized using fluorescence quenching. The quenching of the BSA intrinsic fluorescence is a classic method to characterize its interaction with different types of ligands. This method allows in principle to determine the complex stoichiometry and quenching affinities.68 In BSA’s the fluorophores are related to the two tryptophan
residues Trp-212 and Trp-134 and any change in their environment will translate into a modification of the protein fluorescence emission spectrum. Here, the presumed quencher is the SQAd bio-conjugate.
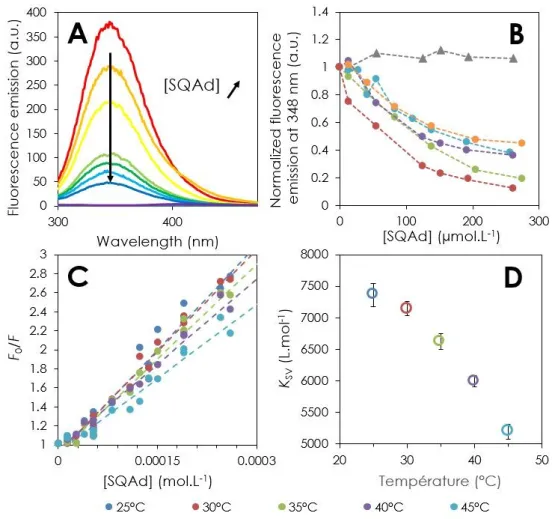
Figure 6A exhibits typical fluorescence emission spectra of BSA in absence (red trace) and in presence of an increasing amount of SQAd nanoparticles (orange to blue traces, BSA:SQAd molar ratios ranging from 1:1 to 1:19). While the fluorescence intensity was clearly decreasing as SQAd nanoparticles were added, no shift in the maximum position was observed. Figure 6B shows the plot of the maximum emission fluorescence value as a function of the concentration of the added SQAd from five independent quenching experiments. The plot of a control experiment performed by the addition of free adenosine to BSA is also shown (grey triangles). The fluorescence emission intensity remained constant when adenosine was added, while it decreased as the SQAd concentration increased. As the SQAd concentration reached 200-300 µmol.L-1 (i.e. BSA:SQAd molar ratio
1:14-19), the fluorescence emission reached an asymptote. SQAd clearly acted as a quencher of BSA while adenosine did not. These observations clearly confirm the conclusions drawn from circular dichroism experiments: the SQAd molecules interact with BSA and form a complex. The fact that the maximum of emission was not shifted indicates that the environment of BSA tryptophan does not change.
Further quenching experiments carried out at temperatures ranging from 25°C to 45°C exhibited the same trend. These results as a function of the temperature were plotted according to the Stern-Volmer formalism68 in Figure 6C:
Eq.1
𝐹0
𝐹 = 1 + 𝐾𝑆𝑉× [𝑆𝑞𝐴𝑑] = 1 + 𝐾𝑞× 𝜏0× [𝑆𝑞𝐴𝑑]
Where F0 and F are the fluorescence intensity of BSA in absence and in presence of SQAd
nanoparticles, respectively, [SQAd] the concentration in SQAd, KSV the Stern-Volmer constant, Kq the
quenching rate constant and τ0=10-8 s the average half-life of tryptophane fluorescence in absence of
quencher.69 The Stern-Volmer plots for temperatures ranging from 25° to 45° (Figure 6C) all exhibited
a reasonable linear trend whose slope, KSV, decreases with increasing temperatures as plotted in Figure
6D (the numerical values were reported in Table 3).
Figure 6: Characterization of BSA-SQAd interaction through fluorescence quenching experiments. A) Fluorescence
emission spectra of BSA solutions quenched by an increasing concentration of SQAd nanoparticles. From red to blue: [SQAd]/[BSA] = 0, 1, 4, 9, 11, 14 and 19. The purple trace is the fluorescence emission of a SQAd solution without BSA. B) Plot of the maximum fluorescence emission value as a function of SQAd (circles) or free adenosine (triangles) concentration for six series of independent samples. The lines are only guide to the eye. C) Stern-Volmer plots as a function of temperature.
D) Plot of the Stern-Volmer constant Ksv as a function of temperature. The BSA concentration was fixed to 13.6 µmol.L-1 in
all the samples.
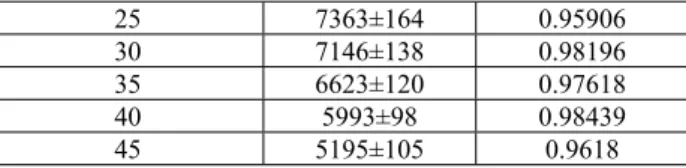
Table 3: Numerical values of the Stern-Volmer constants KSV obtained from the linear fit of Stern-Volmer plots
presented in Figure 6C for SQAd and corresponding correlation coefficients. Temperature (°C) KSV (L.mol-1) r2
25 7363±164 0.95906 30 7146±138 0.98196 35 6623±120 0.97618
40 5993±98 0.98439
45 5195±105 0.9618
The values obtained for the quenching rate constant Kq=KSV/τ0 were higher than 1010 mol.L -1.s-1, which suggests that the quenching was the result of a static mechanism caused by the formation
of a non-fluorescent complex (by opposition to dynamic quenching resulting from interaction through collision between the fluorophore and the quencher).68 The fact that the Stern-Volmer constant
decreased when temperature increased (Figure 6D) confirms this mechanism. BSA and SQAd were thus interacting to form a complex along the following equilibrium BSA + n×SQAd ⇌ BSA(SQAd)n,
whose binding constant Kb can be expressed as:
Eq. 2 𝐾𝑏=
[𝐵𝑆𝐴(𝑆𝑞𝐴𝑑)𝑛]
[𝐵𝑆𝐴] × [𝑆𝑞𝐴𝑑]𝑛
This binding constant Kb and the number of binding sites n could be estimated by plotting another
modified Stern-Volmer equation:
Eq. 3 log
(
𝐹0𝐹― 𝐹)
= log(
𝐾𝑏)
+𝑛 × 𝑙𝑜𝑔([𝑆𝑄𝐴𝑑])where [BSA(SQAd)n], [BSA] and [SQAd] are the concentrations in complex, in free BSA and free
SQAd, respectively. Over all the different experiments we have carried out, values of n ranging between 1 and 2 were obtained (Table 4), suggesting that the binding is not highly site-specific.
Table 4: Binding constant Kb and number of binding sites n derived from the linear fit of the modified Stern-Volmer
equation (Eq 3). Temperature (°C) LogKb n r2 25 6.0±0.3 1.6 0.89464 30 5.1±0.2 1.4 0.91155 35 5.2±0.3 1.4 0.81878 40 3.9±0.1 1.0 0.95938 45 3.7±0.3 1.0 0.90601
Overall, the features of the spectroscopic characterization of the interaction between BSA and SQAd nanoparticles were similar to that of BSA with molecular ligands.61,70 Along with the
conclusions of the first section, this suggests that SQAd individual molecules were extracted from the SQAd nanoparticles to form complexes with BSA.
C. Thermodynamics of SQAd nanoparticles-BSA interaction probed by Isothermal titration calorimetry.
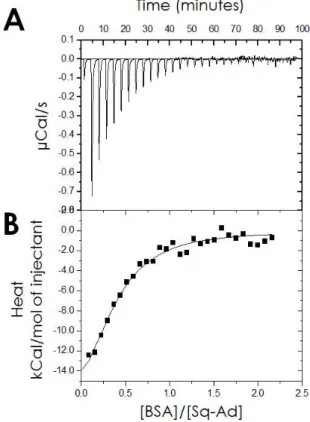
The thermodynamics of the interaction between BSA and the SQAd nanoparticles was analyzed by measuring the global heat flow during the isothermal addition of BSA to a solution containing SQAd nanoparticles. The resulting thermograms 𝐸 =∂𝑄∂𝑡(𝑡) revealed the existence of an exothermic interaction between the SQAd nanoparticles and the BSA as indicated by the negative
variations – each peak corresponding to a single injection – in the compensatory power trace (Figure 7A). Integration of each peak allowed plotting the concentration-normalized heat released by the binding of the protein and the ligand (i.e. the SQAd molecules) as a function of the [BSA]/[SQAd] molar ratio (Figure 7B). Subsequently, the stoichiometry of the complex and the thermodynamic constants could be calculated using a one-binding site fitting model (Table 5). The number of identical and independent binding sites for SQAd monomer on the BSA was about 2, with a free energy change (ΔG<0) of the order of -7.7 kcal.mol-1. Such a value places SQAd monomers amongst BSA mild
binders.61,71 Such intermediate binding constants allow a significant amount of drug to be transported
but also to be subsequently released at drug consumption sites.72 The overall reaction, i.e., removal of
SQAd from the nanoparticle and subsequent binding to BSA, was enthalpy driven (ΔH<0). The SQAd binding to serum albumin compensated for the entropy loss resulting from the disassembly of the nanoparticles.
Figure 7: Isothermal Titration Calorimetry of BSA injected in SQAd nanoparticles dispersion in water. (A) Raw
thermogram and (B) corresponding integrated binding heat (black squares). The line is the fit using a one-binding site model.
Table 5: Average binding stoichiometry (N), complex stability constant (K), Enthalpy change (ΔH), Entropy change
(-T.ΔS) and Gibbs free energy change (ΔG) for the complexation of SQAd by BSA calculated from the fitting of two
ITC measurements.
N (BSA/ SQAd monomer) 0.46±0.06
K (M-1) 5.08×10⁵ ± 1.29×10⁵ ΔH (kcal mol-1) -23.4±3.9
-T. ΔS (kcal mol-1) 15.7±4.31
ΔG (kcal.mol-1) -7.7±0.2
In order to elucidate molecular details of SQAd binding to serum albumin, a series of ensemble docking simulations were performed in order to account for large-scale protein dynamics. We utilized the computational model of human serum albumin (HSA) developed earlier40, which
allowed us to reuse the representative ensemble of protein conformation extracted from extensive molecular dynamics trajectories. The statistics of obtained best docking poses suggests that SQAd binds to the vast majority of solvent-exposed amino acids of HSA in unspecific manner. Figure S13 shows the best binding poses for 3 protein frames (the poses for remaining 33 frames are not shown for clarity). It is clearly seen that the ligand could bind to the whole solvent-exposed protein surface, however the strength of binding differs significantly in different sites.
Due to the large number of independent docking simulations it was possible to compute a probability of finding any atom of the ligand in particular point around the protein. Such volumetric ligand density map is shown in Figure S14. An inspection of this density map shows that the grooves on the protein surface and the interdomain cleft of HSA were the preferable places of ligand binding. This again suggests an unspecific character of binding which is governed by maximizing the number of relatively weak contacts with protein residues.
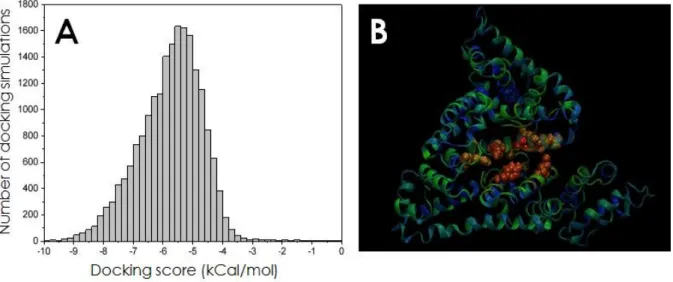
Figure 8: A) Distribution of binding scores for ~20000 simulations. B) Binding probability of SQAd ligand to different
residues of HSA. Blue corresponds to zero probability, green to intermediate probability and red to the highest probability. The residues with highest probability are shown in space-fill representation while the rest of the protein is shown in cartoon representation.
The distribution of the binding scores for all ~20000 docking simulations is shown in Figure 8A. The strongest binding energy is 10.1 kcal/mol, while the most probable binding energy is about -5.5 kcal/mol. These typical absolute values of binding energies are in the same range as the data of titration calorimetry. The broad distribution of the binding energies suggests unspecific character of the binding, driven by the hydrophobicity of the protein surface and the number of non-specific Van der Waals and Coulomb contacts with ligand.
It is noticeable that the binding scores for squalene-adenosine are very similar to the scores for squalene-gemcitabine obtained in previous work40 (best score -10.8 kcal/mol and the most probable
score -5.5 kcal/mol). In line with CD and SSFS observations – which have furthermore been reproduced with squalene-deoxycytidine (see SI, Figure S11 and S12) –, this suggests that interaction of different squalene bioconjugates with serum albumin mainly occurs through the squalene moiety while the drug does not play a significant role in this process and does not induce specificity to particular sites of the protein surface. This unspecificity of the binding was also a conclusion of the quenching fluorescence experiments.
Finally, the probability of binding of SQAd to each of protein residues is shown in Figure 8B. The highest probability of binding is observed for the residues located in the interdomain cleft: ARG 182, LYS 186, ARG 193, ARG 218, GLU 421 and TYR 448. Although all these residues except TYR 448 are positively charged there is no clear indication that binding of SQAd is governed by charge. There are other ARG and LYS residues located outside the interdomain cleft but they have very small probabilities of binding. It is thus possible to speculate that high binding probability to charged residues in the interdomain cleft is caused not by their charge but by their high solvent exposure and the effect of confined volume in narrow cleft. As a result the ligand which is located in the cleft will often be in contact with these residues while the character of binding remains unspecific and mostly charge-independent.
E. Discussion and biological relevance of the results
Does a protein corona form around SQAd nanoparticles?
As already mentioned earlier, the interaction of proteins with nanoparticles is commonly reported to trigger the formation of a protein corona around the nanoparticles. However, most of these studies deal with “rigid” mineral nanoparticles such as silica or metallic nanoparticles.73 In the case of
the “soft” nanoparticles resulting from the nano-assembly of organic molecules such as SQAd, we found little evidence suggesting formation of corona. Indeed, contrary to what has been previously observed (e.g. with lipid nanoparticles74 or polystyrene spheres53) our cryo-TEM images do not show
any layer of adsorbed proteins onto the SQAd nanoparticles surface in spite of the large number of free BSA surrounding them. However, the small decrease in free BSA in solution inferred from SANS fittings (See Table 2) and the observed colloidal stabilization might indirectly suggest that some proteins are partially adsorbed on the surface of the SQAd nanoparticles, thus slightly modifying their surface charge. We conclude that the corona is absent from the SQAd nanoparticles without ruling out the presence of few adsorbed protein adsorbed molecules that might change the colloidal stability of the nanoparticles by limiting their aggregation in phosphate buffer solution.
It is interesting to note that Kihara et al.75 used a similar approach including SANS and CD to
study the interaction of HSA with hard nanoparticles (polystyrene). However, their observations are opposite to ours: they observe and increase of the average diameter of the nanoparticles attributed to the formation of a soft corona. This corona reduces the interparticle repulsion and leads to their
aggregation. These differing results emphasize the specific behavior of soft nanoassemblies in biological media.
Comparison between experimental results and molecular docking simulations
The experimental data of this study may also be discussed in the light of molecular docking simulations performed with SQAd and Human Serum Albumin (HSA). These simulations show that serum albumin plays the role of drug carrier with in silico measured binding energies from zero to 10.1 kcal/mol with an average at -5.5 kcal/mol. This value is of the same order of magnitude as the free energy measured by ITC (-7.7 kcal/mol). Taking into account the approximate nature of the docking scoring function and the complexity of the protein surface such correspondence should be considered as good. Another matching observation is that the interactions do not strongly depend on the nucleoside moiety, hence suggesting that the squalene moiety is the major part interacting with albumin. Experimental results do not allow determining exact binding sites of SQAd monomers but some conclusions could be drawn from fluorescence quenching of tryptophan residues compared to docking results. One of the tryptophans (residue 212) is located deep in the interdomain cleft where the strongest binding of SQAd occurs according to the docking data. However, the BSA fluorescence is never completely quenched, which means that SQAd molecules do not block other solvent-exposed tryptophan residue 134. This is in good agreement with docking results, which predict much weaker binding of SQAd outside of the interdomain cleft and deep surface grooves.
It is important to note that docking simulations provide no data about the number of SQAd molecules which bind to one albumin globule under experimental conditions. Although unspecific binding is possible over the majority of the solvent-accessible protein surface (with different probabilities) this does not mean that the whole surface would be covered by ligands in reality. The real equilibrium depends on SQAd concentration and kinetic constants of binding and unbinding, which are not determined in docking simulations. In reality, since SQAd is hydrophobic and poorly soluble in water, there are probably not so many free SQAd individual molecules in solution ready to interact with serum albumins. The majority of SQAd molecules are then either stored in the nanoparticles or bound to the BSA. There is, therefore, a competition between the SQAd molecules in the nanoparticles and those bound to BSA, hence only the most stable sites of BSA are occupied, that is, in the interdomain cleft.
We are aware that, despite a similar general structure, HSA and BSA differ substantially by sequence and may exhibit somewhat different binding to different small molecules76–79 which makes our
computational model different from one used in experiments. However, the completely unspecific character of SQAd binding suggests that local sequence-related differences of the surface-exposed residues in HSA and BSA could be different in details but the conclusion about unspecific preferential
binding in the interdomain cleft will stand for both proteins and thus allows comparison with experimental data obtained on BSA.
In order to make simulation more realistic, several aspects should be taken into account such as the use of explicit water molecules, the dynamics of the proteins during binding and, most importantly, the extraction of the SQAd molecules from the nanoparticles (unraveling of the nanoparticles). However, accounting for these details currently makes simulations too intensive computationally and too complex methodologically for the routine use. Thus the usage of scanning docking on the ensemble of protein conformations utilized in this work is a reasonable compromise, which produces useful semi-quantitative results in good agreement with experimental observations.
Possible scenario of SQAd uptake by BSA in vivo
Through spectroscopic characterizations, we have established that BSA interacts with the SQAd monomers and form stable complexes with them. This fact, in addition to the observation that the nanoparticle volume fraction decreases in the presence of BSA, leads us to propose that in vivo the serum albumin “extract” the SQAd monomers from the nanoparticles and carry them in the bloodstream toward the pharmacological target (Figure 9). This assumption is in line with previously proposed transport of squalene-gemcitabine by albumin.37,39 The nanoparticles are thus playing the
role of circulating SQAd reservoirs in the plasma. It is not yet clear if this mechanism requires a physical contact between the albumin molecules and the nanoparticles or if the proteins capture the rare free SQAd monomers which are always present in plasma being in dynamic equilibrium with the nanoparticles. Although the solubility of SQAd monomers in aqueous medium is very low, it is not zero and their complexation by BSA can shift the monomer ⇌ nanoparticle equilibrium and lead to the partial disassembly of the nanoparticles. Further studies are needed to investigate the dynamic side of BSA-SQAd nanoparticles interaction in details, but we have already observed such interaction reaches equilibrium within seconds (Figure S9).
Figure 9: Proposed scheme of the SQAd uptake by serum albumin in vivo. 1) SQAd nanoparticles are in equilibrium with SQAd monomers. 2) SQAd monomers are complexed by BSA, thus shifting equilibrium (1) to the right hand side. The BSA can then play its role as a carrier to transport the SQAd to its target while the remaining SQAd nanoparticles act as SQAd monomer reservoir in the bloodstream until they are completely used up. In vitro, the
Although we have not fully assessed the proportions of SQAd molecules which are either assembled in nanoparticles, complexed with BSA or solubilized as free monomers in the serum, it is noteworthy that the nanoparticles are rather dynamic and are able to release the SQAd monomers for complexation with serum albumin. Another question is the reversibility of the protein-drug complexation. Indeed, the BSA should release the SQAd monomers when transported to the target tissue. Given the order of magnitude of the binding constant estimated through quenching fluorescence experiment, isothermal titration calorimetry and molecular docking simulations, this should be easily achievable. Finally, the strong reorganization of BSA conformation observed by circular dichroism raises the question of whether all the properties of BSA are retained.65,66
Conclusion
In this study, we have progressed towards the understanding of the complex interactions occurring between ~100-nm diameter self-assembling squalene-adenosine nanoparticles and serum albumin, the major protein component of the blood plasma. On the one hand, if serum albumin molecules do not seem to form a protein corona per se, they contribute to improve their colloidal stability. But more importantly, serum albumins were found to be capable of extracting SQAd individual molecules from the nanoparticles which could be considered as circulating reservoirs. Through this mechanism, SQAd nanoparticles thus escape the “nanoparticle size paradox”: they are large enough not to be cleared quickly through the kidneys, but the formed SQAd-BSA complexes are small enough (< 10 nm) to perform the so-called Enhanced Permeability and Retention effect in inflammatory tissues.80 Finally, since the protein-monomer interaction is likely to occur through the
squalene moiety, this mechanism may be generic to all squalene conjugates.
Materials and Methods
Materials and synthesis of squalene-adenosine bioconjugate.
Adenosine squalene bioconjugate was synthesized following the protocol described by Desmaële et
al..28,30 Absolute ethanol (>99.8%) was purchased from Sigma-Aldrich and D
2O (99.85% D) was
purchased from Euriso-top.
Bovine Serum Albumin (BSA), Phosphate Buffer Saline (PBS) and Fetal Bovine Serum (FBS) were purchased from Sigma-Aldrich. BSA lyophilized powder was solubilized to a 13 g/L concentration in 0.2 M Phosphate Buffer Saline (PBS) solutions (in H2O for standard experiments and D2O for SANS
experiments). BSA solutions were dialyzed overnight against PBS/D2O solution of at least a 10-fold
volume. BSA solutions were stored at 4°C for no longer than a week. FBS was also dialyzed overnight against PBS/D2O just after bottle opening.
The nanoparticles suspensions were prepared by nanoprecipitation, a method consisting of the addition of the squalene bioconjugate dissolved in an organic solvent to an aqueous phase. In a first step, SQAd bioconjugate (6.6 mg/ml) was properly dissolved in ethanol. 333 µL of this solution was then added dropwise with a 3 mL.min-1 injection rate by means of a syringe pump (PHD 2000, Harvard
Instruments) into 1 mL of aqueous phase (H2O or D2O for SANS experiments) under moderate
magnetic stirring (500 rpm). Finally, the ethanol content was reduced to minimum by concentration using a Rotavapor around 40.0°C under controlled vacuum (43 mbar). This step was repeated several times until the weight loss of the sample was equivalent to the initial amount of added ethanol used to prepare the sample. The exact content of ethanol was checked by the level of incoherent scattering.47
The average size and stability of the obtained nanoparticles was assessed by Dynamic Light Scattering (DLS). Repeatability of the nanopreparation in D2O was validated by the superimposition of the SANS
patterns of different suspensions prepared from the same batch (see Figure S1 in SI).
D2O was used as solvent specifically for SANS so as to increase the neutron contrast between the
nanoparticles and the solvent. Nonetheless, other characterization methods (cryoTEM, circular dichroism, fluorescence) were also performed on deuterated samples to check the consistency between studies carried out in D2O and in H2O. It was verified that the obtained solutions prepared in D2O were
stable over more than 2 weeks. SQAd/BSA mixtures.
The BSA solution was prepared in D2O at the required concentration (13 mg/ml) and dialyzed against
D2O overnight before being used. A 0.2 mol/L PBS solution was obtained by dissolving a pellet into
250 ml of D2O. To prepare a 13 mg/ml BSA solution into PBS, the desired mass of BSA was first
dissolved into a chosen volume of the PBS/D2O solution and then dialyzed against the PBS/D2O
solution during one night. The final BSA concentration was verified by UV-Visible. The SQAd/BSA solutions were prepared by mixing chosen volume of the different following solutions (S1: SQAd/D2O
(2 mg/ml), S2: BSA/D2O (13.0 mg/ml), BSA/PBS (13.0 mg/ml), PBS/D2O).
Cryogenic Transmission Electron Microscopy (cryo-TEM).
The morphology of the SQAd nanoparticles was observed by cryogenic transmission electron microscopy. Drops of the solutions were deposited on EM grids covered with a holey carbon film (Quantifoil R2/2) previously treated with a plasma glow discharge. The excess liquid on the grids was blotted out with filter paper, and the grids were quickly immersed in liquid ethane to form a thin vitreous ice film. The whole process was performed using a Vitrobot apparatus (FEI Company). Observations were conducted at low temperature (−180°C) on a JEOL 2010 FEG microscope operated at 200 kV. Images were recorded with a Gatan camera. The size histogram was built by measuring the diameter of 90 nanoparticles without BSA and 67 with BSA, with a bin number of 20 nm. When the
particles were aggregated (like in Figure 4C-D), the diameter was measured on each individual particles.
Small Angle Neutron Scattering (SANS).
SANS experiments were carried out on the D33 spectrometer at ILL (doi:10.5291/ILL-DATA.9-13-696). Samples prepared in D2O were inserted in 1 mm Hellma quartz cells and aligned using the
thermostatic sample holder with a temperature control of 20°C. The raw data were radially averaged, corrected for electronic background and empty cell, and normalized by water scattering using the LAMP software.81,82 Three configurations were used to cover a q range going from 0.0013 to 0.27 Å-1
(wavelength: λ = 13 Å, sample detector distance D = 12 m, collimation: Φ = 12.8), (λ = 4.6 Å, D = 12 m, collimation: Φ = 7.8) and (λ = 4.6 Å, D = 2 m, collimation Φ = 7.8) for respectively small, medium and large angles.
Circular Dichroism.
Circular dichroism experiments were carried out on a Chirascan-plus (Applied Photophysics) laboratory spectrometer. The samples were inserted in the same Hellma quartz cuvettes used for SANS measurements. For the temperature ramps, the temperature was controlled with a Peltier apparatus. Steady-state Fluorescence.
Solutions were filled in Hellma quartz Ultra-Micro cells and inserted in Cary Eclipse fluorimeter (Varian, Oxford, UK) for measurements. The samples were excited at 289 nm and emission scans were collected between 300 and 550 nm range. Excitation and emission slits were both set to 5 nm. The scan rates were set to 120 nm/min with 1 nm data interval and an averaging time of 0.5 s. Spectra were averaged over 5 measurements. The temperature of the cell was controlled with a thermostated bath. Measurements have usually been carried out about 15 minutes after mixing the nanoparticles with BSA. Fluorescence spectra exhibited no significant difference from 30 seconds to 16 hours after mixing. Quenching experiments can be affected by the inner filter effect, where the sample can attenuate both the excitation beam and the emission spectrum. However, in our case we worked with rather low concentrations of both BSA and SQAd and the optical density of the solutions was below 0.1, thus this effect must can be ruled out.
Isothermal Titration Calorimetry (ITC).
Isothermal titration calorimetry (ITC) experiments (n=2) were performed at 20 °C in pure water with a MicroCal VP-ITC calorimeter (General Electric Healthcare). The SQAd concentration in the microcalorimeter cell and the BSA concentration in the injection syringe were respectively set at 10 μM and 100 μM. A first injection of 2 μL was followed by 30 injections of 10 μL at intervals of 180 s. Two control experiments were conducted by injecting either SQAd nanoparticles in a deionized water-filled cell or by injecting water in the BSA solution. The corresponding dilution enthalpies were subtracted from the enthalpies measured in the titration experiments. The data were analyzed
according to the one binding-site model using the MicroCal Origin software provided by the manufacturer.
Docking simulations.
Binding of SQAd molecules to serum albumin was assessed by means of ensemble docking simulations, which account for large-scale protein dynamics. The protocol “of scanning docking” established in our previous studies40,83,84 was used. High sequence and structural homology between
HSA and BSA allowed us to use all-atom MD trajectory of pre-equilibrated HSA in water which was obtained in our previous study.85 35 frames were extracted from this 100 ns trajectory at even intervals
and used as a representative ensemble of protein conformations, which include both small and large-scale protein dynamics. All protein conformations were aligned by their peptide backbones. SQAd molecule was docked to each of these conformations within the cubic docking volume of 25 nm3 centered sequentially at each residue of HSA. The protein was kept fixed for each docking run since its flexibility was already accounted by using ensemble of conformations from MD trajectory. This resulted in ~20000 independent docking simulations.
Such procedure allows for the scanning of the whole protein surface in each selected protein conformation for binding with SQAd. The binding sites, which are not accessible by the ligand in the static protein structure, could open dynamically in the course of protein fluctuations and become sampled effectively. Large number of docking simulations allows collecting sufficient statistics for reliable estimates of preferable binding sites of SQAd. The probability Pi of binding to the i-th residue
is computed as the following:
,
𝑃
𝑖=
∑𝑗 ∈ 𝐶(𝑖)𝑒 ― 𝐸𝑗 𝑘𝐵𝑇 ∑𝑁𝑗 = 1𝑒 ― 𝐸𝑗 𝑘𝐵𝑇where C(i) is a subset of docking runs which result in the ligand located within 0.5 nm of any heavy atom of the residue i for the best docking pose, N is the total number of docking runs, Ei is the best
docking binding score for the run j, T is the absolute temperature and kB is the Boltzmann constant.
The SQAd ligand and the corresponding protein structures were prepared for docking using MGLTools-1.5.6 software. The docking was performed with the QuickVina-W86 software with the
default scoring function. Analysis of the docking results was performed with custom software based on the Pteros 2.0 molecular modeling library.87,88 For each docking simulation single top-ranked pose
was recorded.
Supplementary Information
1H NMR of the SQAd bioconjugate. Additional SANS characterization and analysis of SQAd
nanoparticles, BSA, and mixtures of both. Synchrotron radiation circular dichroism characterization of SQAd nanoparticles and BSA mixtures. Fluorescence spectroscopy as a function of time.
Isothermaltitration calorimetry. Characterization of Squalene-deoxycytidine nanoparticles and BSA with circular dichroism and fluorescence spectroscopy. Docking simulations.
The SANS data have been assigned a DOI: http://dx.doi.org/10.5291/ILL-DATA.9-13-696 Statement of authors’ contributions
FG, FT, PG and JPR designed and conceived the research presented in this paper. FG, FT, JB, FS, LM, IG, FW, PG, JPR carried out the experiments and analyzed the data. MR, SLM, DD and PC designed and synthesized the SQAd bioconjugates. SOY and CR performed the docking simulations. FG took the lead in writing the manuscript. All authors provided critical feedback and helped shape the research, analysis and manuscript.
Acknowledgements
This work is supported by a public grant overseen by the French National Research Agency (ANR) as part of the “Investissements d’Avenir” program (Labex NanoSaclay, reference: ANR-10-LABX-0035) SANS experiment were performed at the Institut Laue-Langevin (Grenoble, France)(Proposals 9-13-696 and 9-13-781). We thank Alexis Chennevière for complementary SANS measurements performed at the LLB and presented in the SI section. We thank Sophie Combet (LLB, Gif-sur-Yvette) for the access to the circular dichroism spectrometer. SRCD experiments were performed on the DISCO Beamline at the SOLEIL Synchrotron (Saint Aubin, France). Cryo-TEM observations were made thanks to “Investissements d’Avenir” LabEx PALM (ANR-10-LABX-0039-PALM). We gratefully acknowledge Jéril Degrouard (Laboratoire de Physique des Solides – UMR 8502 Orsay) for technical help and discussions relating to the cryo-TEM images. ITC experiments were supported by the French Infrastructure for Integrated Structural Biology (FRISBI) ANR-10-INBS-05.SY and CR were supported by the European Union’s Horizon 2020 research and innovation programme under the Marie Skłodowska-Curie grant agreement No. 690853 and the NATO grant SPS-G5291. The computations were performed in the Centre de calcul régional Romeo and the Mésocentre de calcul de Franche-Comté. This work benefited from the use of the SasView application (www.sasview.org), originally developed under NSF award DMR-0520547. SasView contains code developed with funding from the European Union’s Horizon 2020 research and innovation programme under the SINE2020 project, grant agreement No 654000.
References
(1) Barua, S.; Mitragotri, S. Challenges Associated with Penetration of Nanoparticles across Cell and Tissue Barriers: A Review of Current Status and Future Prospects. Nano Today 9, 223–243. (2) Barenholz, Y. (Chezy). Doxil® — The First FDA-Approved Nano-Drug: Lessons Learned. J.
(3) Arvinte, T.; Palais, C.; Green-Trexler, E.; Gregory, S.; Mach, H.; Narasimhan, C.; Shameem, M. Aggregation of Biopharmaceuticals in Human Plasma and Human Serum: Implications for Drug Research and Development. mAbs 2013, 5 (3), 491–500. https://doi.org/10.4161/mabs.24245. (4) Arvinte, T. Aggregation of Therapeutic Proteins after Mixing with Human Plasma: Implications
for Drug Development, 2014.
(5) Rausch, K.; Reuter, A.; Fischer, K.; Schmidt, M. Evaluation of Nanoparticle Aggregation in
Human Blood Serum. Biomacromolecules 2010, 11 (11), 2836–2839.
https://doi.org/10.1021/bm100971q.
(6) Mohr, K. Aggregation Behavior of Polystyrene-Nanoparticles in Human Blood Serum and Its Impact on the in Vivo Distribution in Mice. J. Nanomedicine Nanotechnol. 2014, 05 (02). https://doi.org/10.4172/2157-7439.1000193.
(7) Moore, T. L.; Rodriguez-Lorenzo, L.; Hirsch, V.; Balog, S.; Urban, D.; Jud, C.; Rothen-Rutishauser, B.; Lattuada, M.; Petri-Fink, A. Nanoparticle Colloidal Stability in Cell Culture Media and Impact on Cellular Interactions. Chem. Soc. Rev. 2015, 44 (17), 6287–6305. https://doi.org/10.1039/C4CS00487F.
(8) Wei, D.; Pang, K.; Song, Q.; Suo, Y.; He, H.; Weng, X. F.; Gao, X.; Wei, X. Noninvasive Monitoring of Nanoparticle Clearance and Aggregation in Blood Circulation by in Vivo Flow Cytometry. J.
Controlled Release 2018, 278, 66–73.
(9) Nel, A. E.; Mädler, L.; Velegol, D.; Xia, T.; Hoek, E. M. V.; Somasundaran, P.; Klaessig, F.; Castranova, V.; Thompson, M. Understanding Biophysicochemical Interactions at the Nano–Bio Interface. Nat. Mater. 2009, 8 (7), 543–557. https://doi.org/10.1038/nmat2442.
(10) Tenzer, S.; Docter, D.; Kuharev, J.; Musyanovych, A.; Fetz, V.; Hecht, R.; Schlenk, F.; Fischer, D.; Kiouptsi, K.; Reinhardt, C.; et al. Rapid Formation of Plasma Protein Corona Critically Affects Nanoparticle Pathophysiology. Nat. Nanotechnol. 2013, 8 (10), 772–781. https://doi.org/10.1038/nnano.2013.181.
(11) Bertrand, N.; Grenier, P.; Mahmoudi, M.; Lima, E. M.; Appel, E. A.; Dormont, F.; Lim, J.-M.; Karnik, R.; Langer, R.; Farokhzad, O. C. Mechanistic Understanding of in Vivo Protein Corona Formation on Polymeric Nanoparticles and Impact on Pharmacokinetics. Nat. Commun. 2017, 8 (1). https://doi.org/10.1038/s41467-017-00600-w.
(12) Ke, P. C.; Lin, S.; Parak, W. J.; Davis, T. P.; Caruso, F. A Decade of the Protein Corona. ACS Nano 2017, 11 (12), 11773–11776. https://doi.org/10.1021/acsnano.7b08008.
(13) Salvati, A.; Pitek, A. S.; Monopoli, M. P.; Prapainop, K.; Bombelli, F. B.; Hristov, D. R.; Kelly, P. M.; Åberg, C.; Mahon, E.; Dawson, K. A. Transferrin-Functionalized Nanoparticles Lose Their Targeting Capabilities When a Biomolecule Corona Adsorbs on the Surface. Nat. Nanotechnol. 2013, 8 (2), 137–143. https://doi.org/10.1038/nnano.2012.237.
(14) Mirshafiee, V.; Mahmoudi, M.; Lou, K.; Cheng, J.; Kraft, M. L. Protein Corona Significantly Reduces Active Targeting Yield. Chem. Commun. 2013, 49 (25), 2557. https://doi.org/10.1039/c3cc37307j.
(15) Raesch, S. S.; Tenzer, S.; Storck, W.; Rurainski, A.; Selzer, D.; Ruge, C. A.; Perez-Gil, J.; Schaefer, U. F.; Lehr, C.-M. Proteomic and Lipidomic Analysis of Nanoparticle Corona upon Contact with Lung Surfactant Reveals Differences in Protein, but Not Lipid Composition. ACS Nano 2015, 9 (12), 11872–11885. https://doi.org/10.1021/acsnano.5b04215.
(16) Klein, G.; Mathé, C.; Biola-Clier, M.; Devineau, S.; Drouineau, E.; Hatem, E.; Marichal, L.; Alonso, B.; Gaillard, J.-C.; Lagniel, G.; et al. RNA-Binding Proteins Are a Major Target of Silica Nanoparticles in Cell Extracts. Nanotoxicology 2016, 10 (10), 1555–1564. https://doi.org/10.1080/17435390.2016.1244299.
(17) Docter, D.; Distler, U.; Storck, W.; Kuharev, J.; Wünsch, D.; Hahlbrock, A.; Knauer, S. K.; Tenzer, S.; Stauber, R. H. Quantitative Profiling of the Protein Coronas That Form around Nanoparticles.
Nat. Protoc. 2014, 9 (9), 2030–2044. https://doi.org/10.1038/nprot.2014.139.
(18) Issaq, H. J.; Xiao, Z.; Veenstra, T. D. Serum and Plasma Proteomics. Chem. Rev. 2007, 107 (8), 3601–3620. https://doi.org/10.1021/cr068287r.
(19) Anderson, N. L.; Anderson, N. G. The Human Plasma Proteome: History, Character, and
Diagnostic Prospects. Mol. Cell. Proteomics 2002, 1 (11), 845–867.
https://doi.org/10.1074/mcp.R200007-MCP200.
(20) Emerson, T. E. Unique Features of Albumin: A Brief Review. Crit. Care Med. 1989, 17 (7), 690– 694.
(21) Fasano, M.; Curry, S.; Terreno, E.; Galliano, M.; Fanali, G.; Narciso, P.; Notari, S.; Ascenzi, P. The Extraordinary Ligand Binding Properties of Human Serum Albumin. IUBMB Life 57 (12), 787– 796. https://doi.org/10.1080/15216540500404093.
(22) Wunder, A.; Muller-Ladner, U.; Stelzer, E. H. K.; Funk, J.; Neumann, E.; Stehle, G.; Pap, T.; Sinn, H.; Gay, S.; Fiehn, C. Albumin-Based Drug Delivery as Novel Therapeutic Approach for
Rheumatoid Arthritis. J. Immunol. 2003, 170 (9), 4793–4801.
https://doi.org/10.4049/jimmunol.170.9.4793.
(23) Larsen, M. T.; Kuhlmann, M.; Hvam, M. L.; Howard, K. A. Albumin-Based Drug Delivery:
Harnessing Nature to Cure Disease. Mol. Cell. Ther. 2016, 4 (1).
https://doi.org/10.1186/s40591-016-0048-8.
(24) Paal, K.; Müller, J. M.; Hegedûs, L. High Affinity Binding of Paclitaxel to Human Serum Albumin.
Eur J Biochem 2001, 268, 2187–2191.
(25) Kratz, F. Albumin as a Drug Carrier: Design of Prodrugs, Drug Conjugates and Nanoparticles. J.
Controlled Release 2008, 132 (3), 171–183. https://doi.org/10.1016/j.jconrel.2008.05.010.
(26) Elsadek, B.; Kratz, F. Impact of Albumin on Drug Delivery — New Applications on the Horizon. J.
Controlled Release 2012, 157 (1), 4–28. https://doi.org/10.1016/j.jconrel.2011.09.069.
(27) Kratz, F. A Clinical Update of Using Albumin as a Drug Vehicle — A Commentary. J. Controlled
Release 2014, 190, 331–336. https://doi.org/10.1016/j.jconrel.2014.03.013.
(28) Couvreur, P.; Stella, B.; Reddy, L. H.; Hillaireau, H.; Dubernet, C.; Desmaële, D.; Lepêtre-Mouelhi, S.; Rocco, F.; Dereuddre-Bosquet, N.; Clayette, P.; et al. Squalenoyl Nanomedicines as
Potential Therapeutics. Nano Lett. 2006, 6 (11), 2544–2548.
https://doi.org/10.1021/nl061942q.
(29) Bildstein, L.; Marsaud, V.; Chacun, H.; Lepêtre-Mouelhi, S.; Desmaële, D.; Couvreur, P.; Dubernet, C. Extracellular-Protein-Enhanced Cellular Uptake of Squalenoyl Gemcitabine from Nanoassemblies. Soft Matter 2010, 6 (21), 5570. https://doi.org/10.1039/c0sm00342e.
(30) Desmaële, D.; Gref, R.; Couvreur, P. Squalenoylation: A Generic Platform for Nanoparticular
Drug Delivery. J. Controlled Release 2012, 161 (2), 609–618.
https://doi.org/10.1016/j.jconrel.2011.07.038.
(31) Lepeltier, E.; Bourgaux, C.; Rosilio, V.; Poupaert, J. H.; Meneau, F.; Zouhiri, F.; Lepêtre-Mouelhi, S.; Desmaële, D.; Couvreur, P. Self-Assembly of Squalene-Based Nucleolipids: Relating the Chemical Structure of the Bioconjugates to the Architecture of the Nanoparticles. Langmuir 2013, 29 (48), 14795–14803. https://doi.org/10.1021/la403338y.
(32) Sobot, D. Conjugation of Squalene to Gemcitabine as Unique Approach Exploiting Endogenous Lipoproteins for Drug Delivery. Nat. Commun. 2017.
(33) Gaudin, A.; Yemisci, M.; Eroglu, H.; Lepetre-Mouelhi, S.; Turkoglu, O. F.; Dönmez-Demir, B.; Caban, S.; Sargon, M. F.; Garcia-Argote, S.; Pieters, G.; et al. Squalenoyl Adenosine Nanoparticles Provide Neuroprotection after Stroke and Spinal Cord Injury. Nat. Nanotechnol. 2014, 9 (12), 1054–1062. https://doi.org/10.1038/nnano.2014.274.
(34) Gaudin, A.; Lepetre-Mouelhi, S.; Mougin, J.; Parrod, M.; Pieters, G.; Garcia-Argote, S.; Loreau, O.; Goncalves, J.; Chacun, H.; Courbebaisse, Y.; et al. Pharmacokinetics, Biodistribution and Metabolism of Squalenoyl Adenosine Nanoparticles in Mice Using Dual Radio-Labeling and
Radio-HPLC Analysis. J. Controlled Release 2015, 212, 50–58.
https://doi.org/10.1016/j.jconrel.2015.06.016.
(35) Jacobson, K. A.; Gao, Z.-G. Adenosine Receptors as Therapeutic Targets. Nat. Rev. Drug Discov. 2006, 5 (3), 247–264. https://doi.org/10.1038/nrd1983.
![Figure 2 : A) SANS patterns of SQAd/D 2 O ([SQAd] = 0.4 mg/ml) (blue circles), SQAd/FBS/PBS/D 2 O ([SQAd] = 0.4 mg/ml) (violet circles) and FBS/PBS/D 2 O (carmine squares) at the same concentration as in the SQAd solution](https://thumb-eu.123doks.com/thumbv2/123doknet/13327807.400541/6.892.120.772.732.1067/figure-patterns-circles-circles-carmine-squares-concentration-solution.webp)