HAL Id: hal-01854775
https://hal.archives-ouvertes.fr/hal-01854775
Submitted on 7 Aug 2018HAL is a multi-disciplinary open access
archive for the deposit and dissemination of sci-entific research documents, whether they are pub-lished or not. The documents may come from teaching and research institutions in France or abroad, or from public or private research centers.
L’archive ouverte pluridisciplinaire HAL, est destinée au dépôt et à la diffusion de documents scientifiques de niveau recherche, publiés ou non, émanant des établissements d’enseignement et de recherche français ou étrangers, des laboratoires publics ou privés.
Crystal viscoplastic modeling of UO2 single crystal
Luc Portelette, Jonathan Amodeo, Ronan Madec, Julian Soulacroix, Thomas
Helfer, Bruno Michel
To cite this version:
Luc Portelette, Jonathan Amodeo, Ronan Madec, Julian Soulacroix, Thomas Helfer, et al.. Crys-tal viscoplastic modeling of UO2 single crysCrys-tal. Journal of Nuclear Materials, Elsevier, In press, �10.1016/j.jnucmat.2018.06.035�. �hal-01854775�
1
Crystal viscoplastic modeling of UO2 single crystal
Luc Portelette1, Jonathan Amodeo2, Ronan Madec3, Julian Soulacroix4, Thomas Helfer1,
Bruno Michel1*
1 CEA, DEN, DEC, SESC, LSC bat 151 Centre de Cadarache F-13108 Saint Paul Lez
Durance, France
2 Université de Lyon, INSA-Lyon, CNRS, MATEIS UMR5510, F-69621 Villeurbanne,
France
3 CEA, DAM, DIF, F-91297 Arpajon, France
4 EDF, DIPNN, LIDEC, CNPE de Chinon F-37420 Avoine
To be submitted to:
Journal of Nuclear Materials
(*) Corresponding author: Dr. Bruno Michel
2
Crystal viscoplastic modeling of UO2 single crystal
Abstract
The viscoplastic behavior of uranium dioxide (UO2) single crystal is of great interest to
perform predictive multiscale modeling of the nuclear fuel. Here, a viscoplastic model is built considering dislocation glide in ½<110>{100} and ½<110>{110} slip systems. The constitutive law parameters are determined adjusting the temperature dependency of the experimental critical resolved shear stress for both principal slip modes. Crystal plasticity finite element simulations of single crystal compression tests show a reasonable agreement with experimental viscoplastic anisotropy of UO2. However, for specific orientations where
½<110>{111} slip is observed experimentally, significant differences remain between experimental and computed compression stresses. Therefore, the role of ½<110>{111} slip is investigated based on a parametric study that provides new insights on UO2 plastic
deformation. Several parameterizations of ½<110>{111} slip are tested highlighting the complexity of UO2 viscoplastic behavior. Significant improvements are still required to
explain all simulation-experiment gaps.
1. INTRODUCTION
The primary fuel material in nuclear power plant is made of uranium dioxide (UO2)
integrated in a zirconium alloy cladding tube. While the viscoplastic behavior of the material plays a key role during nominal and accidental reactor operations, it is a complex process due to the heterogeneous fuel microstructure and its evolution under irradiation. In this context, the link between fuel pellet mechanical properties and the cladding tube integrity has been established [1-3] but complex multiphysics simulation tools are required to provide the scale transition between involved elementary mechanisms and the macroscopic behavior. The development of a constitutive model that captures the underlying physics, without irradiation effect at first, is important for polycrystalline behavior itself. In addition, fission products releases are known to strongly depend on the local mechanical state [4]. Thus, the improvement on the knowledge of the mechanical state at the lower grain scale is of great importance for the global multiphysics scheme. As a consequence, single crystal modeling appears as the first fundamental step to build a multi-scale and multiphysics modeling approach able to predict the global polycrystalline mechanical properties and also the consequences of fission products and mechanical behavior interactions.
UO2 millimeter size specimens exhibit a plastic behavior under compression at temperatures
larger than 800 K. UO2 has the fluorite structure (a0=5.47 Å) that is made of a face-centered
cubic lattice of uranium atoms that entangles a cubic sublattice of oxygens located in tetrahedral interstitial positions. The three different dislocation slip modes of UO2 usually
referenced in the literature are ½<110>{100}, ½<110>{110} and ½<110>{111} [5]-[14]. Those systems are also observed in other fluorite materials as e.g. CaF2 [15]-[18], BaF2 [19]
and ThO2: [20],[21]. In UO2, critical Resolved Shear Stress (CRSS) for {100} and {110}
modes show a strong dependency to the temperature, what underlines the role of thermally-activated deformation processes. Lefebvre [11] and Byron [6] emphasize the decrease of
3
experimental CRSS in ½<110>{100}, the most favorable slip mode, down to 20 MPa increasing the temperature up to 1900 K. Although Lefebvre data show a clear changeover to an athermal regime beyond a transition temperature Ta=1400 K, no transition is noticed from
Byron’s dataset. In the 1400 K – 2000 K temperature range, ½<110>{110} slip systems are characterized by larger CRSS values (when compared to {100}) that vary significantly with temperature [7], [9]. ½<110>{111} slip is also observed but always in association with ½<110>{100} or ½<110>{110} slip systems. Dislocation glide and cross-slip from {110} and {100} slip systems are both observed in {111} slip planes. Those systems have also been reported in ThO2 [21]. For single mode orientations, {110} shows CRSS almost twice larger
than {100} and crystal orientation dependency is roughly consistent with the Schmid law [9]. As ½<110>{111} slip systems are not observed under single mode conditions, no CRSS can be easily derived from experimental single crystal tests.
Only few TEM studies focusing on dislocations in UO2 are available in the literature. Yust
and McHargue [8] characterized the dislocation microstructures for the {100} slip mode in the 1050 K – 1700 K temperature range (i.e. within the thermally-activated regime). At low strains, they observed many edge dipoles, as well as long mixed dislocations with many direction changes leading to zig-zag shaped configurations. These straight dislocations are entangled at larger strains. Such observations have been confirmed by few studies for {100} and {110} slip modes [10], [12] that emphasize the relevance of lattice friction in UO2 at low
and intermediate temperatures. However, no detail analysis about elementary dislocation processes (e.g. kink-pair mechanism, dislocation vs. point-defect interactions) can be found. Sawbridge and Sykes [9] pointed out the surprising higher mobility of screw dislocations in ½<110>{100} as already observed in other fluorite materials [15],[18],[19]. These screw dislocations can cross-slip in {110} or {111} slip plans leading to the characteristic zig-zag shape. In addition, Keller and collaborators show a slip system transition toward ½<110>{111} at 873 K in hyper stoichiometric UO2+x [13], [14]. Besides the temperature,
the U/O ratio also influences the slip mode activity [10],[13],[14] but no quantitative dependency has been shown up to now.
Atomistic simulation using semi-empirical interatomic potentials have been performed to characterize the Peierls barriers, the 0 K Peierls stress and CRSS vs. temperature profiles at very high strain rates typical of molecular dynamics (MD) simulations for the three slip modes of UO2 [24-26]. While simulation results show that ½<110>{100} is the softer slip
mode (as in the experiment), ½<110>{110} is harder than ½<110>{111}. In addition, most of the interatomic parameterizations show that the {100} edge dislocation has the lowest Peierls stress. This last result is in contradiction with most of experimental observations indicating that edge dislocation is the rate limiting character in ½<110>{100} slip systems. In addition, Lunev [27] and Soulié [28] show that {100} edge dislocation glide due to a kink-pair process.
To model the viscoplastic behavior of UO2 based on dislocation mechanisms, Sauter et al.
[29] propose to include physics-based equations for grains orientation and temperature dependency as well as dislocation strain hardening for polycrystal. Nevertheless, the authors used a simplified polycrystalline approach considering slip on ½<110>{100} only without
4
any prior parameter identification on the single crystal. On the other hand, Sawbridge and Sykes [9] adjust UO2 plastic anisotropy considering that the measured stress 𝜎 relies on
single slip conditions only, with the CRSS 𝜏#$ and the maximum Schmid factor 𝑆$:𝜎 =
𝜏#$/𝑆$. However, this approach is not consistent with the strain compatibility conditions
needed to accommodate the total strain under uniaxial compression.
In summary, while ½<110>{100} and ½<110>{110} are generally reported as the two principal slip modes in the thermally-activated deformation regime of UO2, no clear
conclusions can be made upon ½<110>{111} slip and its thermal activation, especially from the experiments. Furthermore, the same uncertainty remains for the dislocation character identification. Despite this lack of knowledge, a single crystal viscoplastic model is necessary to build a predictive polycrystalline model for UO2 mechanical properties in the
thermally-activated regime of deformation. For this purpose, we propose to reprocess experimental flow stresses using a reversed engineering approach to assess a Crystal Plasticity Finite Element Model (CPFEM) that account for the different slip modes of UO2. At this stage, the
stoichiometry dependence will not be integrated. This model will be used to compute plastic anisotropy properties and the contribution of each slip modes to lattice rotation will be discussed. A particular attention will be paid to the ½<110>{111} slip mode which is currently under debate in the literature.
2. METHODS
Crystal plasticity model
In the following, 𝐶# denotes the reference configuration and 𝐶 the current configuration.
Those configurations are linked by the deformation gradient tensor 𝐹**.
The crystal plasticity model is based on the classical multiplicative Kröner-Lee decomposition [30-32] of the deformation gradient tensor 𝐹**:
𝐹** = 𝐹**+. 𝐹**- (1)
where 𝐹**- the plastic deformation gradient and 𝐹**+ the elastic deformation gradient. According
to Mandel, the plastic deformation gradient is associated in this paper with the unique isoclinic intermediate configuration 𝐶..
Considering equation (1), the velocity gradient 𝐿** can be expressed as :
𝐿 = 𝐹**̇. 𝐹**12 = 𝐿**++ 𝐹**+. 𝐿**-. 𝐹**+12 (2)
With 𝐿**+ = 𝐹**̇+. 𝐹**+12 the elastic part of the velocity gradient in the 𝐶 and 𝐿**- = 𝐹**̇-. 𝐹**-12 the
plastic part in 𝐶.. Equation (2) shows that the mechanical power is decomposed into a reversible part (linear in 𝐿**+) and an irreversible part (linear in 𝐿**-).
5
The elastic part of the behavior is based the hyperelastic Saint-Venant Kirchhoff law in the intermediate configuration which relates the second Piola-Kirchhoff stress tensor to the Green-Lagrange strain 𝐸**67+ = 2
89𝐹**
+:𝐹**+− 𝐼̅̅ > as follows:
𝜋** = 𝐶̅̅̅̅: 𝐸**67+ (3)
where 𝐶̅̅̅̅ is the elastic stiffness tensor.
The plastic deformation gradient rate 𝐿A- is computed as the sum of each slip system shear rate contribution as defined in equation (4). The latter one uses the usual Schmid tensor definition 𝑆̅̅$ = 𝑚CC⃗$⊗ 𝑛C⃗$, where 𝑛C⃗$ and 𝑚CC⃗$ are respectively the system plane normal and
the slip direction of the slip system 𝛼. Ns is the number of slip systems.
𝐿**- = 𝐹**̇-𝐹**-12 = H 𝛾̇$. 𝑆̅̅$ JK LM2 = H 𝛾̇$. 𝑆̅̅$ N LM2 OPPQPPR {2##} + H 𝛾̇$. 𝑆̅̅$ 28 LMU OPPQPPR {22#} + H 𝛾̇$. 𝑆̅̅$ 8V LM2W OPPQPPR {222} (4)
Considering constant strain rate under steady state loading, the shear rate 𝛾̇$ is derived from
the Orowan’s law (equation (5)) that relies on the dislocation velocity 𝑣$ and the mobile
dislocation density 𝜌Z$ for the system 𝛼.
γ̇$ = 𝜌
Z$𝑏𝑣$ (5)
In the thermally activated regime, the dislocation velocity depends on both the temperature and the resolved shear stress 𝜏$ defined hereafter.
To express the stress dependency of the dislocation velocity and ensure the energetic consistency of the proposed model, the work conjugate 𝑀^^ of the plastic velocity gradient 𝐿A-,
known as the Mandel stress tensor, is introduced as follows:
𝑀^^ = detb𝐹**+c 𝐹**+. 𝜎**. 𝐹**+:= 𝐹**+:. 𝐹**+. 𝜋** (6)
The resolved shear stress 𝜏$ can now be expressed the Schmid tensor 𝑆̅̅$:
𝜏$ = 𝑀^^: 𝑆̅̅$ (7)
Due to the lack of information on physics-based deformation processes in UO2, we used an
empirical Arrhenius equation for dislocation mobility that depends on both shear stress and temperature as derived in [33], equation (8). More information about the mobility equation is provided Appendix 1. 𝑣$ = 𝜈 e𝑏 exp h− 𝛥𝐻#. 𝑘l𝑇n hcosh h 𝜏$ 𝜏#.n − 1n (8)
6
Where 𝜈e = 4.94 × 10²W𝑠12 is the Debye frequency, 𝑏 is the Burgers magnitude, 𝑘l the
boltzman constant, 𝑇 the temperature, Δ𝐻#. is the dislocation glide activation energy and 𝜏 #. a
critical shear stress. Here, i refers respectively to {100}, {110} or {111} modes. For i={100}, 𝛼 ∈ [1; 6], for i={110} 𝛼 ∈ [7; 12] and for i={111} 𝛼 ∈ [13; 24]. 𝜈e is deduced from the Debye temperature Θe=377 K [31-33], where 𝜈e = Θe/(ℎ. 𝑘…) with ℎ the Plank constant.
Identification of the shear rate equation parameters
Parameters of equations (5) and (8) are defined using a reversed engineering process based on equation (9). Parameters 𝜌Z$, Δ𝐻
#. and 𝜏#. are adjusted to reproduce experimental
CRSS measured during single crystal compression tests. Numerical CRSS 𝜏$ are computed
using the least square method and refer to a given temperature 𝑇 and a resolved shear rate γ̇$.
𝜏$ = τ # . . cosh12ˆ1 + ε̇ 0.5 × 𝜌Z$𝜈 e𝑏8𝑒1 Œ•Ž• •‘: ’ (9)
Assuming single slip and low strain conditions, 𝛾̇$ of equation (5) is computed assuming the
macroscopic strain rate 𝜀̇ = 1 × 101V𝑠12 with 𝑆 = 0.5.
The identification process is performed using several sets of experimental CRSS that refer to ½<110>{100} and ½<100>{110} slip modes [6], [7], [9], [11]. See supplementary information for a detailed discussion about experimental data.
CPFE modeling of viscoplastic anisotropy
Single crystal compression tests of Sawbridge and Sykes [9] are used as reference to validate the proposed CPFE model and investigate the viscoplastic anisotropy. In both the experiment and the simulation, constant strain rate compression tests are performed at 𝜀̇=101V s12 and T=1600 K for various orientations. In the following, the orientation of the
compression axis (CA) in the crystal basis is defined using the two angles 𝜙 and 𝛺 as proposed in the original study [9].
The constitutive model described in section 2.1 has been implemented in the MFront integrator [37], [38] within the Cast3M code [39] including an implicit quasi newton algorithm for the nonlinear mechanical equilibrium and a standard implicit newton scheme for the local nonlinear behavior. The fourth order elastic tensor (equation (3)) is derived from Hutching’s neutron scattering data that provide single crystal elastic constants for a large range of temperature [39]. The simulated sample has a parallelepiped shape (2.8 × 2.8 × 8 mm3) and is completely meshed with 250 cubic (quadratic) elements with 20 integration
points each to model the heterogeneous deformation of the sample. Uni-axial displacement loads in FE simulations are performed considering bottom and top surfaces sticked to the compression device. Free-boundary conditions are prescribed on the sample lateral surfaces in order to mimic experimental conditions. As the method for lattice rotation measures is not
7
detailed in Sawbridge and Sykes study, here we compute the average rotation of ten elements in the center of the sample. See supplementary information for more details on lattice rotation calculations.
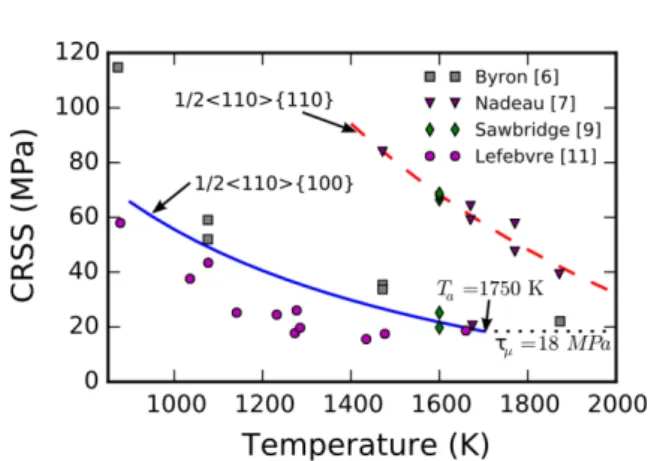
3. RESULTS CRSS
Figure 1: CRSS versus temperature profiles for ½<110>{100} and ½<110>{110} slip modes. Experimental data are shown using symbols while blue and dashed red curves refer to equation (9) solutions respectively {100} and {110} slip modes.
Table 1: Key parameters for the CRSS processing (equation (9)) of ½<110>{100} and ½<110>{110} slip modes under single slip conditions.
½<110>{100} ½<110>{110}
𝜌Z$(m-2) 6.2 1012 9.2 1011
Δ𝐻#. (eV) 5.71 5.22
𝜏#. (MPa) 1.35 4.78
Processing of equation (9) is shown in Figure 1 including CRSS for ½<110>{100} and ½<110>{110} slip systems. For {100}, Byron [6], Nadeau [7], Sawbridge [9], and Lefebvre [11] experimental data are used in the fitting procedure. At low temperature, {100} CRSS exhibit large discrepancies while they converge to an athermal stress of 𝜏—=18 MPa and a computed athermal transition temperature Ta=1750 K. For {110}, only Nadeau and
Sawbridge and Sykes datasets are used to process the {110} mode leading to larger CRSS values when compared to ½<110>{100}. Assuming the same athermal stress for both modes, the athermal temperature is Ta=2250 K in ½<110>{110}. Both datasets exhibit extended
thermally-activated regimes characterized by 𝛥𝐻#{2##}=5.71 eV and 𝛥𝐻#{22#}=5.22 eV. Derived mobile dislocation densities under single slip conditions are of 6.2 1012 m-2 and 9.2
1011 m-2 in {100} and {110} slip planes. These values are in relatively good agreement with
usual measurements performed in the early stage of deformation. CRSS processed parameters are resumed Table 1.
8 CPFEM results
Mechanical behavior
CPFEM simulations are performed using rate equations (5) and (8) and Table 1 parameterization. Both {100} and {110} slip modes are considered and data are compared to Sawbridge and Sykes compression tests [9] in Figure 2. While some uncertainties exist for
ε<1%, the stress-strain curves reproduce qualitatively the experimental profiles beyond 1%
strain. Sawbridge and Sykes [9] suggest that the low strain regime (ε<1%) refer to a so-called stage 0, that is commonly observed when the mobility of one dislocation character is higher than the others (see e.g. [41],[42]).
For the two single mode orientations, 𝜙 = 2° and 𝜙 = 44°, the Schmid factor of the activated slip systems is close to 0.5 respectively for four ½<110>{110} systems and for the [110](001) slip system (see Table 2). For 𝜙 = 2°, the computed flow stress shows a slight increase but remains in good agreement with the experiment. Considering experimental discrepancies (see the original article of Sawbridge and Sykes [9]), stresses are also comparable to Sawbridge and Sykes data for 𝜙 = 44°.
For 𝜙 = 54°, strain is accommodated in the simulation as in the experiment by dislocation glide in ½<110>{100}. While yield stresses are comparable, the computed flow stress is slightly lower.
For other 𝜙 orientations of Figure 2, simulated strain is accommodated by both slip modes. In addition, orientation dependency on the stress is well captured despite a large overestimation for 𝜙 = 13°. Furthermore, one can note that the hardening tendency observed for 𝜙 = 36° and 𝜙 = 25.5° is well-captured although no hardening term is introduced in the crystal plasticity model. This effective hardening is induced by the coupling effect between lattice rotation and viscoplastic anisotropy.
Figure 2: Stress-strain of 1600 K UO2 single crystal compression tests. CPFEM (dashed line) is compared to experimental compression tests (full line) [9]. Computed data are shown using the engineering stress definition.
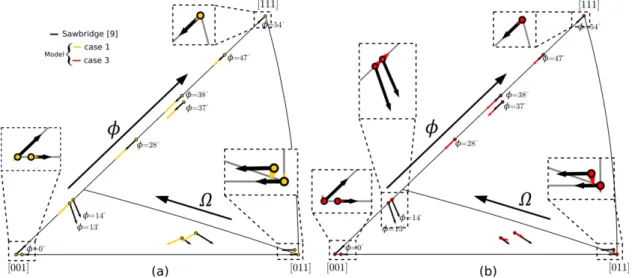
In the experiment, heterogeneous glide can be deduced from lattice rotations as e.g. in the case of Sawbridge and Sykes [9]. On Figure 3, both experimental and CPFEM results show that CA rotates toward [001] when 𝜙 > 16°. For these orientations, the ½[110](001) slip system contributes mainly to the total shear inducing significant deformation heterogeneities and lattice rotations. For orientations close to 𝜙 = 0°, CA misaligns from [001] in the experiment while simulated rotation is almost negligible. The numerical result is
9
due to homogeneous glide on four ½<110>{110} slip systems while only two slip systems are activated in the experiment.
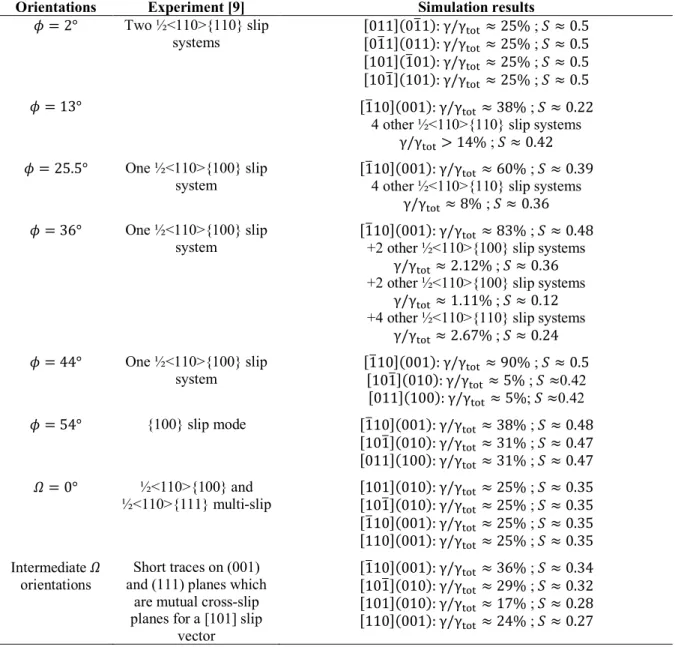
Table 2: Slip system observations in the experiments and computed slip system activity. Experimental data refer to Sawbridge and Sykes study [9]. 𝜙 and 𝛺 orientations are depicted figures 2 and 3 respectively.
Orientations Experiment [9] Simulation results
𝜙 = 2° Two ½<110>{110} slip
systems [011](01*1): γ/γ[01*1](011): γ/γ›œ››œ› ≈ 25% ; 𝑆 ≈ 0.5 ≈ 25% ; 𝑆 ≈ 0.5
[101](1*01): γ/γ›œ› ≈ 25% ; 𝑆 ≈ 0.5
[101*](101): γ/γ›œ› ≈ 25% ; 𝑆 ≈ 0.5
𝜙 = 13° [1*10](001): γ/γ›œ› ≈ 38% ; 𝑆 ≈ 0.22
4 other ½<110>{110} slip systems γ/γ›œ›> 14% ; 𝑆 ≈ 0.42
𝜙 = 25.5° One ½<110>{100} slip
system [1*10](001): γ/γ4 other ½<110>{110} slip systems ›œ› ≈ 60% ; 𝑆 ≈ 0.39 γ/γ›œ› ≈ 8% ; 𝑆 ≈ 0.36
𝜙 = 36° One ½<110>{100} slip
system [1*10](001): γ/γ+2 other ½<110>{100} slip systems ›œ› ≈ 83% ; 𝑆 ≈ 0.48 γ/γ›œ›≈ 2.12% ; 𝑆 ≈ 0.36
+2 other ½<110>{100} slip systems γ/γ›œ›≈ 1.11% ; 𝑆 ≈ 0.12
+4 other ½<110>{110} slip systems γ/γ›œ›≈ 2.67% ; 𝑆 ≈ 0.24 𝜙 = 44° One ½<110>{100} slip system [1*10](001): γ/γ›œ› ≈ 90% ; 𝑆 ≈ 0.5 [101*](010): γ/γ›œ› ≈ 5% ; 𝑆 ≈0.42 [011](100): γ/γ›œ› ≈ 5%; 𝑆 ≈0.42 𝜙 = 54° {100} slip mode [1*10](001): γ/γ›œ› ≈ 38% ; 𝑆 ≈ 0.48 [101*](010): γ/γ›œ› ≈ 31% ; 𝑆 ≈ 0.47 [011](100): γ/γ›œ› ≈ 31% ; 𝑆 ≈ 0.47 𝛺 = 0° ½<110>{100} and ½<110>{111} multi-slip [101](010): γ/γ›œ› ≈ 25% ; 𝑆 ≈ 0.35 [101*](010): γ/γ›œ› ≈ 25% ; 𝑆 ≈ 0.35 [1*10](001): γ/γ›œ› ≈ 25% ; 𝑆 ≈ 0.35 [110](001): γ/γ›œ› ≈ 25% ; 𝑆 ≈ 0.35 Intermediate 𝛺
orientations and (111) planes which Short traces on (001) are mutual cross-slip planes for a [101] slip
vector
[1*10](001): γ/γ›œ› ≈ 36% ; 𝑆 ≈ 0.34
[101*](010): γ/γ›œ› ≈ 29% ; 𝑆 ≈ 0.32
[101](010): γ/γ›œ› ≈ 17% ; 𝑆 ≈ 0.28
[110](001): γ/γ›œ› ≈ 24% ; 𝑆 ≈ 0.27
For 𝜙 close to 16°, CA misaligns with the 𝜙 axis in the experiment while it rotates toward the [001] axis in the simulations. No experimental slip characterization is made for this orientation, but the computed lattice rotation is correlated to a significant activity of the ½ [110](001) slip system, as already seen before for 𝜙 > 16° (see Table 2). Therefore, it can be assumed that additional slip systems are involved in the experiment.
For orientations close to intermediate 𝛺, the CA rotates toward the [011] axis in the experiment while simulations show a rotation toward [001] with a significant activity of the ½[110](001) slip system comparable to the previous case. Finally, for CA close to [011], computed lattice rotations are negligible due to homogeneous glide on four {100} slip
10
systems (see Table 2). However, CA rotates toward [001] in the experiment. Here, experimental slip observations emphasize the activation of ½<110>{111} slip systems that may contribute to lattice rotations for [011] and intermediate 𝛺 orientations.
Finally, when dislocation glide occurs on a single mode (typically for 𝜙 ≈ 0° and 𝜙 ≈ 45°), both the stress response and lattice rotation predictions are in good agreement with experimental measurements. For intermediate 𝜙 orientations (𝜙 > 16°), while the computed and experimental stress profiles show some discrepancies, lattice rotations are in good agreement due to a comparable slip mode activity.
To better understand the impact of the different slip modes on the strain accommodation, the following section will focus on the flow stress anisotropy and particularly based on additional simulations performed along 𝛺 orientations.
Figure 3: Lattice rotations in UO2 single crystal compression after 2% strain. Experimental
lattice rotations (in black) versus computed rotations using the CPFE approach including (a) case 1 (in yellow) and (b) case 3 in red (model parametrizations are detailed in table 3).
Viscoplastic anisotropy and shear contributions at 1600 K
Stresses (at 2% strain) versus lattice orientations 𝜙 are shown on Figure 4(a) and numerical predictions are in good agreement with experimental data. The plastic shear distribution per slip mode is shown Figure 4(b) where the {110} mode accommodates the entire deformation for 𝜙 = 0°. Up to 𝜙 = 10°, the {100} mode handles less than 25% of the total strain. The latter mode becomes dominant beyond 𝜙 = 13° and accommodates all the strain between 𝜙 = 40° up to CA=[1*11]. Those results are consistent with experimental slip traces observations.
On the other hand, simulation results for 𝛺 orientations presented on Figure 4(c) and (d) are in contradiction with the reference tests. For 𝛺 < 25°, stress is underestimated (~50%) when compared to the experiment. The simulation is characterized by {100} multi-slip that does not agree with experimental observations which underlines {100}+{111} multi-slip [9]. For
11
the same orientations, two other experimental studies show multi-slip only on {100} at strains lower than 0.3% in addition to cross-slip from ½<110>{100} to ½<110>{111} slip systems [11],[12]. All these studies conclude that, plastic deformation occurs first in ½<110>{100} slip systems and then, cross slip happens in {111}. For 𝛺 ∈ [20; 35], the computed stress increases up to ~125 MPa while measurements exhibit a steady-state of about 110 MPa. In the experiment, slip traces observations are non-crystallographic and follow the Maximum Resolved Shear Stress Plane (MRSSP) while simulations are characterized merely by shear in the {100} (≥ 75%) and {110} (≤ 25%) modes.
Figure 4: Stress anisotropy. (a)-(c) flow stress at 2% strain versus 𝜙 and 𝛺 orientations. (b)-(d) Computed normalized plastic shear contribution for each slip mode (𝛾{2##}/𝛾
¡¢¡
in blue and 𝛾{22#}/𝛾
¡¢¡in red) versus 𝜙 and 𝛺 orientations.
4. DISCUSSIONS
The CPFE model reproduces correctly most of the CRSS anisotropy of UO2 single crystal
along 𝜙 and is also able to restitute qualitatively the stress-strain behavior (after stage 0) for most of the available experimental CA. However, three particular ranges of orientations remain under debate (i) 𝜙 ∈ [15; 40] where the stress is overestimated, (ii) the region close to [1*11] where stress is underestimated and, (iii) 𝛺 < 25° domain where the stress is underestimated.
Theses discrepancies may have different origins as e.g. dislocation interactions, cross-slip and/or glide in ½<110>{111} slip systems or composite slip. Indeed, the {111} slip hypothesis is supported by numerous evidences in the literature [5],[9],[11]-[14]. As a consequence, accounting for the {111} slip mode in the simulation seems to be of prime
12
importance. As pure ½<110>{111} slip is not referenced in the literature, the reverse engineering methodology developed section 2.2 cannot be applied in this case. Therefore, a parametric study focusing on ½<110>{111} is developed in what follows.
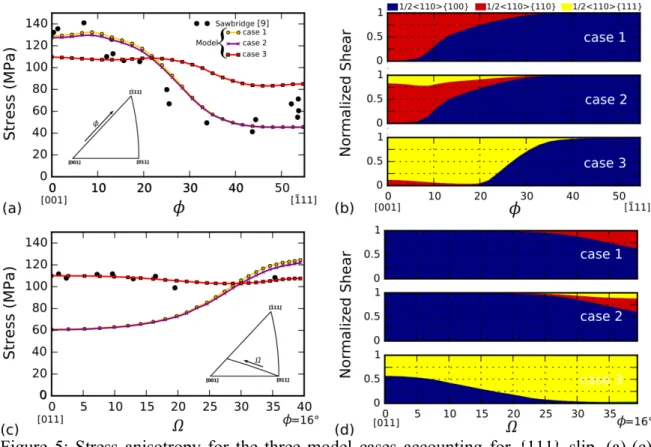
Derived from the original model that accounts for ½<110>{100} and ½<110>{110} (labelled case 1), two additional cases that also include ½<110>{111} slip systems are set. They are labelled case 2 and case 3 in the following. Relative mode activation sensitivity is described in Table 3. The model case 2 accounts for {111} slip using the same activation parameters than for {110}. This assumption should lead to a restricted activation of the {111} mode. With a less sever hypothesis ({111} slip slightly softer than {110}), Sawbridge and Sykes [9] underline that slip on ½<110>{100} slip systems is more favorable than in ½<110>{111} for 𝛺 orientations. Thus, case 3 is designed to check if a combination of {100} and {111} modes could improve the results, especially for 𝛺 orientations. As a consequence, the activity of {100} has been further reduced decreasing the mobile dislocation density on every ½<110>{100} slip systems down to 𝜌Z£ = 1 × 10U m-2 to promote {111} glide. Finally, other
{111} activation parameters are equivalent to those of {110} but with a 𝜏#{222}= 3.50 MPa (against 4.78 MPa for {110} mode). This new parameter set influences the CRSS as shown in Table 3. Results for all cases are provided in Figure 5.
Considering {111} as a hard mode (case 2) leads to a slight variation of the mechanical response (figure 5(a) and (c)) compare to case 1. In particular, {111} accommodates up to 25% of the plastic shear for 0° < 𝜙 < 30° and 25° < 𝛺 < 40° orientations. This result is consistent with several experimental observations where {111} slip traces were observed for CA close to [001].
Table 3: Description of the model cases accounting for ½<110>{111} slip systems. CRSS are provided for each slip mode. They are computed at T=1600 K and 𝜀̇ = 101V𝑠12 using
equation (9) and the maximum Schmid factor assumption.
Model Slip mode sensitivity {100} CRSS (MPa) {110} {111}
case 1 soft {100} + hard {110} 21.7 68.4
case 2 soft {100} + hard {110} + {111} as hard as {110} 21.7 68.4 68.4 case 3 harder {100} + intermediate {111} + hard {110} 39.8 68.4 50.1
For the case 3, strain is produced mainly by the {111} and {100} modes for 𝛺 < 25°. This result is consistent with experimental slip traces observations made for CA close to [011]. Furthermore, this model improves lattice rotations when compared to the experiment (see Figure 3(b)) what confirms the role of ½<110>{111} slip systems in the mechanical behavior of UO2, especially for orientations where CA is in the center of the standard triangle.
Nevertheless, the activity of ½<110>{111} slip systems increases too much and the {110} mode is nearly off, even close to CA=[001] (Figure 5(a)). Furthermore, CRSS become lower than expected for these orientations.
13
On the other hand, the {100} mode remains active especially close to CA=[1*11], but the stress level increases due to the changes of {100} activation parameters leading to significant discrepancies when compared to experimental data. Finally, along the 𝜙 direction, the agreement with Sawbridge and Sykes [9] stress measurement is only reached for 𝜙=16° i.e. at the intersection between 𝜙 and 𝛺 directions. However, lattice rotations are still not consistent with experiments for this orientation where CA rotates toward [1*11] due to the larger activation of the {111} mode.
Overall, ½<110>{111} slip systems improve stress predictions along 𝛺 but have an opposite influence along 𝜙 orientations. Therefore, {111} slip appears as a key feature to obtained reliable lattice rotations and CRSS in the central part of the standard triangle only. This latter observation suggests that UO2 slip system activity might be more complex than expected.
Among others, cross-slip responsible for probable composite glide between {100} and {111} or {110} and {111} systems (depending on the orientation) should be accounted in the future, as well as the strain hardening induced by dislocation interactions between the different slip systems. Indeed, forest hardening should be particularly effective in the cases of multi-slip orientations (e.g. 𝛺 = 0° and 𝜙 = 54°) that include several ½<110>{100} slip systems characterized by an athermal transition temperature Ta very close from Sawbridge and Sykes
[9] effective temperature.
Figure 5: Stress anisotropy for the three model cases accounting for {111} slip. (a)-(c) flow stress at 2% strain versus 𝜙 and 𝛺 orientations. (b)-(d) computed normalized shear contribution for each slip mode versus 𝜙 and 𝛺 orientations (𝛾{2##}/𝛾
¡¢¡ in blue,
𝛾{22#}/𝛾
14 5. CONCLUSIONS
The goal of this study was to build a viscoplastic model for UO2 single crystal based on the
dislocation glide mechanism to reproduce the plastic anisotropy of UO2. The activation
parameters for the ½<110>{100} and ½<110>{110} slip systems have been adjusted on experimental CRSS vs. temperature data and integrated into a CPFEM framework. Then, compression simulations have been performed and compared to Sawbridge and Sykes experimental work [9]. Accounting for the two slip modes, the plastic anisotropy is correctly assessed only in the case of single-mode orientations i.e. when only one of the two slip modes is activated. To improve the model, ½<110>{111} slip systems have been integrated based on several experimental observations. As a result, accounting for ½<110>{111} slip systems greatly improves stress predictions and lattice rotations in central part of the standard triangle but other orientations remain under debate. This confirms that ½<110>{111} slip systems may play an important role in UO2 single crystal mechanical response and related lattice
rotations, together with other slip modes. In particular, cross-slip, combined slip and dislocation interactions appear as key processes to investigate in the future in order to better understand UO2 single crystal mechanical properties.
ACKOWLEDGEMENT
This research is achieved in the framework of a simulation project devoted to the PLEIADES fuel software environment funding by the French nuclear institute between CEA, EDF and FRAMATOME.
APPENDIX 1
Empirical power laws (as e.g. equation (10) [43]) are commonly used to compute mean dislocation velocities and describe viscoplasticity at the grain scale. This kind of equation relies on dislocation glide in slip system α for 𝜏$ reaching a critical value 𝜏
#$. Thus, the
viscosity is given by the stress exponent 𝑛, i.e. the strain rate sensitivity is reduced when increasing n, up to a purely plastic behavior for high n values.
𝛾̇$ = 𝜌 Z𝑏𝑣#$𝑒𝑥𝑝 h− 𝛥𝐻#$ 𝑘l𝑇n ¦ 𝜏$ 𝜏#$¦ § 𝑠𝑖𝑔𝑛(𝜏$) (10)
Usually, 𝑛 is defined for a given stress and temperature range and the use of a single n value for larger stress range is proscribed. To avoid the identification of stress-temperature dependent exponent, an exponential form such as a hyperbolic sine equation (11) can be used [44-46]. Both equations (10) and (11) are equivalent for a given stress domain assuming different values of 𝜏#$. 𝛾̇$ = 𝜌 Z𝑏𝑣#$𝑒𝑥𝑝 h− 𝛥𝐻#$ 𝑘l𝑇n 𝑠𝑖𝑛ℎ h 𝜏$ 𝜏#$n 𝑠𝑖𝑔𝑛(𝜏$) (11)
15
Finally, the hyperbolic sine law (11) can be replaced by equations (5) and (8) to avoid dislocation glide at low stress and high temperature, in the void diffusion creep regime. This formulation originally introduced by Soulacroix [33] cancels the linear stress dependency†,
given by exponential or hyperbolic sinus law, for low stresses.
REFERENCES
[1] B. Michel, C. Nonon, J. Sercombe, F. Michel, V. Marelle, Simulation of the Pellet
Cladding Interaction phenomenon with the PLEIADES fuel performance software environment, Nuclear Technology, Vol.182, No.2, pages 124-137, 2013.
[2] B. Michel, J. Sercombe, G. Thouvenin, A new phenomenological criterion for pellet–
cladding interaction rupture, Nuclear Engineering and Design, Vol.238, No.7, pages
1612-1628, 2008.
[3] R.L. Williamson, K.A. Gamble, D.M. Perez, S.R. Novascone, G. Pastore, Validating
the BISON fuel performance code to integral LWR experiments, Vol.301, pages
232-244, 2008.
[4] L. Noirot, MARGARET: A comprehensive code for the description of fission gas
behavior, Nuclear Engineering and Design, Vol.241, No.6, pages 2099-2118, 2011.
[5] E.J. Rapperport and A.M. Huntress, Deformation modes of single crystals uranium
dioxide from 700°C to 1900°C, Nuclear Metals, Inc. Concord, Massachisetts, 1960.
[6] Byron, The yield and flox of single crystals of uranium dioxide, Journal of Nuclear Materials, Vol.28, No.1, pages 110-114, 1968.
[7] J.S. Nadeau, Dependence of flow stress on nonstoichiometriy in oxygen-rich uranium dioxide at high temperature, Journal of the American ceramic society, Vol.52, No.1, 1969.
[8] C.S. Yust and C.J. McHargue, Dislocation sbstructures in deformed uranium dioxide
single crystals, Journal of Nuclear Materials, Vol.31, No.2, pages 121-137, 1969.
[9] P.T. Sawbridge and E.C. Sykes. Dislocation glide in UO2 single crystals at 1600 K. Philosophical Magazine, Vol.24, pages 33-53, 1971.
[10] M.S Seltzer, C.L. Clauer, B.A. Wilcox, The influence of stoichiometry on compression
creep of uranium dioxide single crystals, Journal of Nuclear Materials, Vol.44, No.1,
pages 43-56, 1972.
† A first order Taylor’s development around 0 leads to a linear function for exp(x) and sinh(x) when it gives a
16
[11] J.M. Lefebvre, Contribution à l’étude de la déformation plastique d’une céramique de
strucuture fluorite : le bioxyde d’uranium, PhDthesis, faculté des sciences de poitiers,
1976.
[12] A. Alamo, J.M. Lefebvre, J. Soulard, Déformation plastique du bioxyde d’uranium :
observation des sous-structures de dislocations, Journal of Nuclear Materials, Vol.75,
No.1, pages 145-153, 1978.
[13] R.J. Keller, T.E. Mitchell, A.H. Heuer, Plastic deformation in nonstoichiometric
UO2+x single crystals – I. Deformation at low temperatures, Acta metallica, Vol.36,
No.4, pages 1061-1071, 1988.
[14] R.J. Keller, T.E. Mitchell, A.H. Heuer, Plastic deformation in nonstoichiometric
UO2+x single crystals – II. Deformation at high temperatures, Acta metallica, Vol.36,
No.4, pages 1073-1083, 1988.
[15] A.G. Evans, C. Roy, and P.L. Pratt, the role of grain boundaries in the plastic
deformation of calcium fluoride, Proceedings of British Ceramic Society, Vol.6 , pages
173-189, 1966.
[16] W.L. Phillips, Deformation and fracture processes in calcium fluoride single crystals, Journal of the American Ceramic Society, Vol.44, No.10, 499-506, 1961.
[17] R. Burn, G.T. Murray, Plasticity and dislocation etch pits in CaF2, Journal of the American Ceramic Society, Vol.45, No.5, pages 251-252, 1962.
[18] G.A. Keig and R.L. Coble, Mobility of edge dislocations in single crystal calcium
Fluoride, Journal of Applied Physics, Vol.39, No.13, pages 6090-&, 1968.
[19] T.S. Liu, C.H. Li, Plasticity and of barium fluoride single crystals, Journal of Applied Physics, Vol.35, No.11, pages 3325-3330, 1964.
[20] J.W. Edington, M.J. Klein, Slip and fracture in single crystals of thoria, Journal of Applied Physics, Vol.37, No.10, pages 3906-3908, 1966.
[21] A. Gilbert, Deformation and fracture of thoria, Pilosophical Magazine, Vol.12, No.15, pages 139-144, 1965.
[22] S. Ikeno, E. Furubayashi, Dislocation behavior in pure niobium at low temperatures, Physica Status Solidi (a), Vol.27, No.2, pages 581-590, 1975.
[23] F. Louchet, L.P. Kubin, D. Vesely, In situ deformation of b.c.c. crystals at low
temperatures in a high voltage electron microscope dislocation, Philosophical
Magazine A, Vol.39, No.4, pages 433-454, 1979.
[24] P. Fossati, L. Van Brutzel, B. Devincre, Molecular dynamics simulation of dislocations
17
[25] R. Skelton, A. Walker, Peierls-Nabarro modeling of dislocations in UO2, Journal of Nuclear Materials, Vol.495, pages 202-210, 2017.
[26] D. Parfitt, C.L. Bishop, M.R. Wenman, R.W. Grimes, Strain diels and line energies of
dislocations in uranium dioxide, Journal of Physics: Condensed Matter, Vol.22, No.17,
pages 1-8, 2010.
[27] A.V. Lunev, A. Yu Kushin, S.V. Starikov, Glide mobility of the ½[110](001) edge dislocation in UO2 from molecular dynamics simulation, International Journal of Plasticity, Vol.89, pages 85-95, 2016.
[28] A. Soulié, J.P. Crocombette, A. Kraych, F. Garrido, G. Satton, E. Clouet,
Atomistically-informed thermal glide model for edge dislocations in uranium dioxide, Acta
Materialia, Vol.150, pages 248-261, 2018.
[29] F. Sauter, S. Leclercq, Modeling of the non-monotonous viscoplastic behavior of
uranium dioxide, Journal of Nuclear Materials, Vol.322, No.1, pages 1-14, 2003.
[30] E. Kroner, Allgemeine kontinuumstheorie der versetzungen und eigenspannungen, Archive for Rational Mechanics and Analysis, Vol.4, No.4, pages 273-334,1960.
[31] E.H. Lee, Elastic plastic deformation at finite strains, Journal of Applied Machanics, Vol.36, No.1, pages 1-&, 1969.
[32] J. Mandel, Equations constitutives et directeurs dans les milieux plastiques et
viscoplastiques, International Journal of Solids and Structures, Vol.9, No.6, pages
725-740, 1973.
[33] J. Soulacroix, Approche micromécanique du comportement du combustible dioxyde
d’uranium, PhDthesis, École Nationale Supérieure D’Arts et Métiers, 2014.
[34] BTM. Willis, Neutron diffraction studies of actinide oxides. II. Thermal motions of
atoms in uranium dioxide and Thorium dioxide between room temperature and 1100 degrees C, Proceedings of the Royal Society of London A, Vol.274, No.1356, pages
134-144, 1963.
[35] H. Koç, E. Eser, B.A. Mamedov, Calculation of the nuclear fuels UO2 and NpO2 using integer and non integer n-dimensional Debye functions, Nuclear Engineering and
Design, Vol.241, pages 3678-3682, 2011.
[36] E. Eser, H. Koç, M. Gokbulut, G. Gursoy, Estimation of heat capacities for actinide
dioxide : UO2, NpO2, ThO2 and PuO2, Nuclear Engineering and Technology, Vol.46,
No.6, pages 863-868, 2014.
[37] T.Helfer, B. Michel, J.M. Proix, M. Salvo, J. Sercombe, M. Casella, Introducing the
18
material knowledge management within the PLEIADES fuel element modelling platform, Computers and Mathematics with Applications, Vol.70, No.5, pages
994-1023, 2015.
[38] T. Helfer, MFront, a code generation tool detdicated to material knowledge, URL: http://tfel.sourceforge.net/
[39] Commissariat à l’Énergie Atomique (CEA), Cast3M, Finite Element Software, URL:
http://www-cast3m.cea.fr
[40] M.T.Hutching, High temperature studies of UO2 and ThO2 using Neutron scattering techniques, Journal of the Chemical Society, Faraday Transactions 2: Molecular and
Chemical Physics, Vol.83, No.7, pages 1083-1103, 1987.
[41] N. Brown, R.A. Ekvall, Temperature dependence of the yield points in Iron, Acta Metallurgica, Vol. 10, Iss. 11 (1962), 1101-1107.
[42] T.E. Mitchell, R.A. Foxall, P.B. Hirsch, Work hardening in nobium single crystals, The Philosophical Magazine (A), Vol. 8, No. 95, (1963), 1895-1920.
[43] M. Fivel, S. Forest, Plasticité cristalline et transition d’échelle : cas du monocristal, Techniques de l’ingénieur, M4016, 2004.
[44] F.R.N. Nabarro, One-dimensional models of thermal activation under shear stress, Philosophical Magazine, Vol.83, No.26, pages 3047-3054, 2003.
[45] J. Amodeo, Ph. Carrez, B. Devincre, P. Cordier, Multiscale modelling of MgO
plasticity, Acta Materialia, Vol.59, No.6, pages 2291-2301, 2011.
[46] J. Amodeo, S. Dancette, L. Delannay, Atomististically-informed crystal plasticity in
![Figure 2: Stress-strain of 1600 K UO 2 single crystal compression tests. CPFEM (dashed line) is compared to experimental compression tests (full line) [9]](https://thumb-eu.123doks.com/thumbv2/123doknet/13219082.393890/9.892.126.765.741.911/figure-stress-strain-crystal-compression-compared-experimental-compression.webp)